
Houses for sale & to rent in Newnham And Westbury, Newnham
House Prices in Newnham And Westbury
Properties in Newnham And Westbury have an average house price of £315k and had 75 Property Transactions within the last 3 years¹.
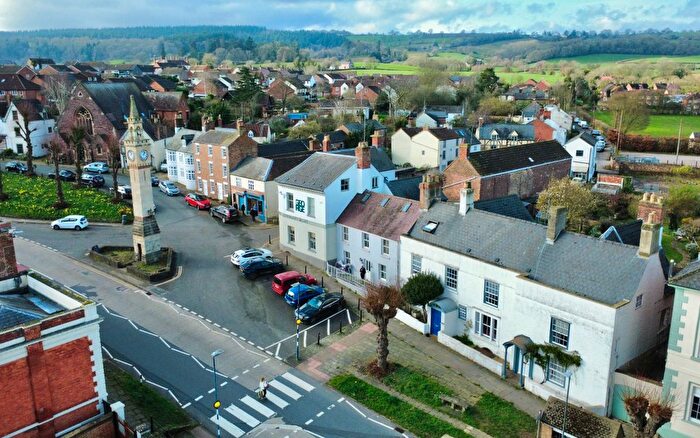
Newnham And Westbury is an area in Newnham, Gloucestershire with 596 households², where the most expensive property was sold for £775k.
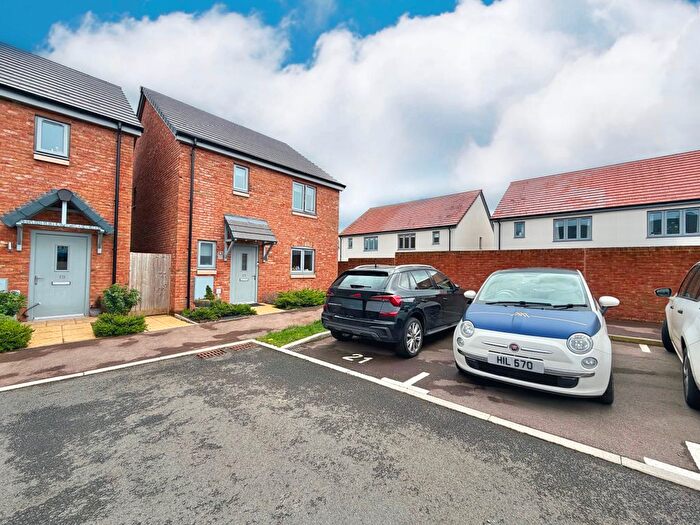
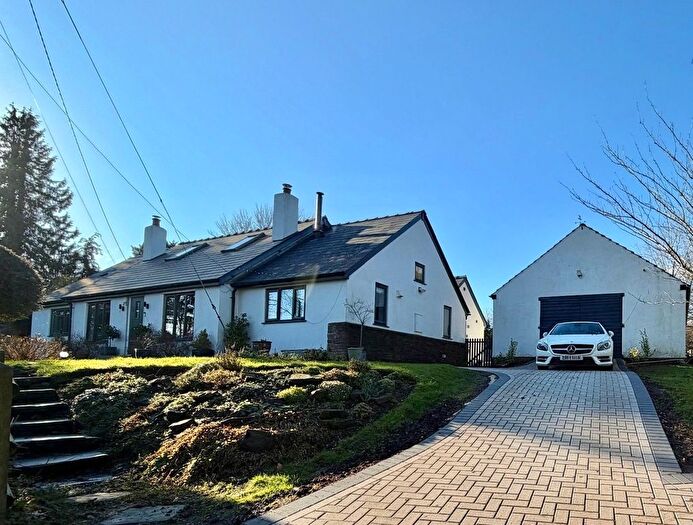
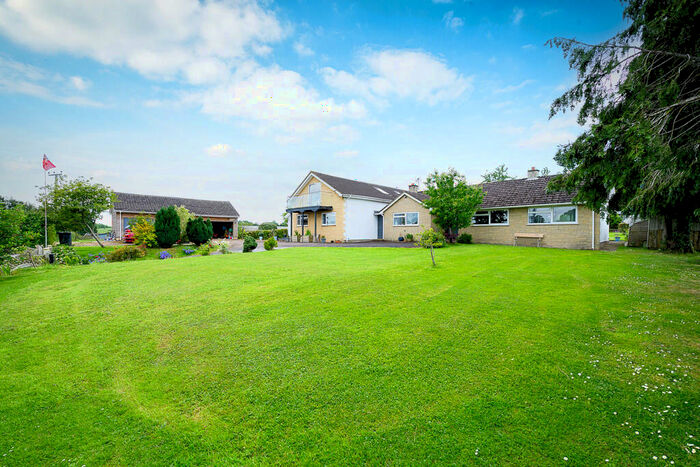
Properties for sale in Newnham And Westbury
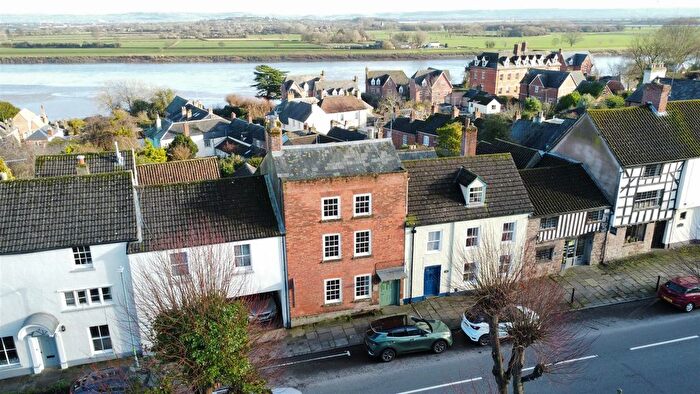
![]()
If you are looking to sell your house, let it out, or receive a property valuation, an expert can help you.
Click the button below to get started.


Previously listed properties in Newnham And Westbury

Roads and Postcodes in Newnham And Westbury
Navigate through our locations to find the location of your next house in Newnham And Westbury, Newnham for sale or to rent.
| Streets | Postcodes |
|---|---|
| Acacia Close | GL14 1DN |
| Allsopp Close | GL14 1DP |
| Artillery Place | GL14 1BH |
| Beeching Cottages | GL14 1EB |
| Brightlands | GL14 1AG |
| Bullo Pill | GL14 1DZ GL14 1ED |
| Church Road | GL14 1AP GL14 1AR GL14 1AX |
| Dean Road | GL14 1AB GL14 1HH |
| East View | GL14 1DG |
| Elton Lane | GL14 1JJ |
| Elton Road | GL14 1JN GL14 1JQ |
| Harrison Close | GL14 1DW |
| High Street | GL14 1AA GL14 1AD GL14 1BB GL14 1BE GL14 1BS GL14 1BU GL14 1BW GL14 1BY |
| Hyde Bank | GL14 1DF |
| Hyde Lane | GL14 1HQ |
| Kingsmead | GL14 1AN GL14 1AW |
| Littledean Road | GL14 1HJ GL14 1JU |
| Lumbars Lane | GL14 1LH |
| Mornington Terrace | GL14 1BG |
| Mythe Terrace | GL14 1DB |
| New Road | GL14 1JS |
| Orchard Rise | GL14 1AJ GL14 1AL |
| Queens Acre | GL14 1DJ |
| Riverside Lane | GL14 1JD GL14 1JE GL14 1JF |
| Severn Street | GL14 1AZ GL14 1BA |
| Severn Terrace | GL14 1AU |
| Sheens Meadow | GL14 1BP |
| Smithyman Court | GL14 1SA |
| St Peters Close | GL14 1AY |
| Station Road | GL14 1BZ GL14 1DA GL14 1DD GL14 1DH |
| The Green | GL14 1AF |
| The Haie | GL14 1HW |
| The Orchards | GL14 1EX |
| The Strood | GL14 1JL |
| Unlawater Lane | GL14 1BJ GL14 1BQ |
| Wellington Terrace | GL14 1DT |
| Wellington Villas | GL14 1DU |
| Whetstones | GL14 1BT |
| GL14 1DS GL14 1HL GL14 1JA GL14 1JB GL14 1JG GL14 1JH |
Transport near Newnham And Westbury

- FAQ
- Price Paid By Year
- Property Type Price
Frequently asked questions about Newnham And Westbury
What is the average price for a property for sale in Newnham And Westbury?
The average price for a property for sale in Newnham And Westbury is £314,519. This amount is 7% lower than the average price in Newnham. There are 201 property listings for sale in Newnham And Westbury.
What streets have the most expensive properties for sale in Newnham And Westbury?
The streets with the most expensive properties for sale in Newnham And Westbury are Bullo Pill at an average of £741,250, Wellington Terrace at an average of £470,000 and The Orchards at an average of £467,500.
What streets have the most affordable properties for sale in Newnham And Westbury?
The streets with the most affordable properties for sale in Newnham And Westbury are Harrison Close at an average of £203,333, Severn Street at an average of £224,999 and Orchard Rise at an average of £226,625.
Which train stations are available in or near Newnham And Westbury?
Some of the train stations available in or near Newnham And Westbury are Lydney, Cam and Dursley and Stonehouse.
Property Price Paid in Newnham And Westbury by Year
The average sold property price by year was:
| Year | Average Sold Price | Price Change |
Sold Properties
|
|---|---|---|---|
| 2025 | £334,812 | 2% |
24 Properties |
| 2024 | £327,361 | 11% |
18 Properties |
| 2023 | £292,757 | -17% |
33 Properties |
| 2022 | £342,307 | -4% |
26 Properties |
| 2021 | £357,516 | 16% |
45 Properties |
| 2020 | £301,000 | 7% |
16 Properties |
| 2019 | £279,019 | -13% |
26 Properties |
| 2018 | £316,333 | 32% |
26 Properties |
| 2017 | £215,490 | -16% |
28 Properties |
| 2016 | £249,927 | -10% |
35 Properties |
| 2015 | £274,222 | 10% |
20 Properties |
| 2014 | £246,584 | 19% |
29 Properties |
| 2013 | £200,704 | 8% |
32 Properties |
| 2012 | £184,434 | -4% |
23 Properties |
| 2011 | £191,706 | -21% |
24 Properties |
| 2010 | £231,431 | 7% |
19 Properties |
| 2009 | £215,795 | -9% |
11 Properties |
| 2008 | £235,796 | 2% |
21 Properties |
| 2007 | £231,164 | 1% |
37 Properties |
| 2006 | £229,397 | 6% |
44 Properties |
| 2005 | £216,021 | 12% |
28 Properties |
| 2004 | £190,448 | 16% |
30 Properties |
| 2003 | £160,882 | 16% |
32 Properties |
| 2002 | £134,415 | -0,3% |
45 Properties |
| 2001 | £134,777 | 15% |
44 Properties |
| 2000 | £114,210 | 22% |
33 Properties |
| 1999 | £89,331 | 9% |
36 Properties |
| 1998 | £81,482 | 21% |
35 Properties |
| 1997 | £64,644 | -24% |
38 Properties |
| 1996 | £79,863 | 21% |
41 Properties |
| 1995 | £63,137 | - |
50 Properties |
Property Price per Property Type in Newnham And Westbury
Here you can find historic sold price data in order to help with your property search.
The average Property Paid Price for specific property types in the last three years are:
| Property Type | Average Sold Price | Sold Properties |
|---|---|---|
| Semi Detached House | £304,720.00 | 25 Semi Detached Houses |
| Detached House | £419,466.00 | 15 Detached Houses |
| Terraced House | £286,619.00 | 25 Terraced Houses |
| Flat | £251,350.00 | 10 Flats |