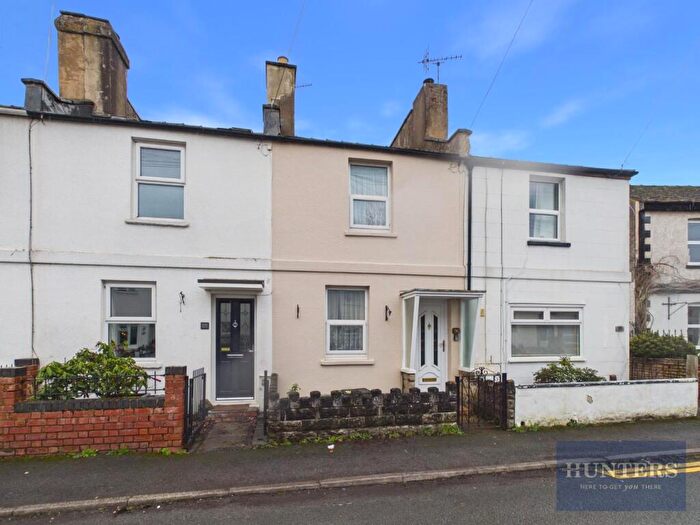
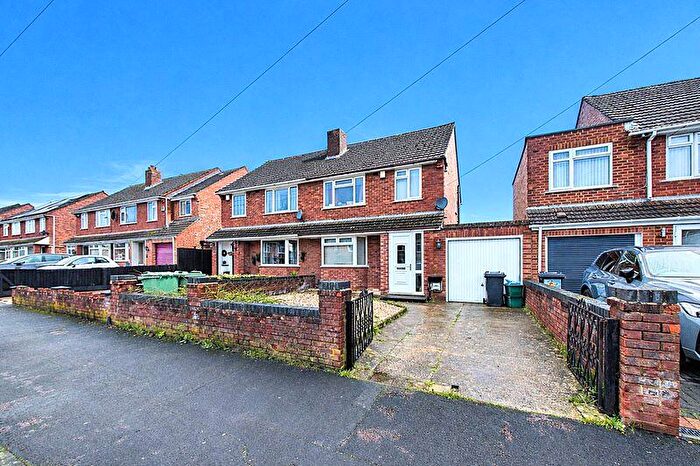
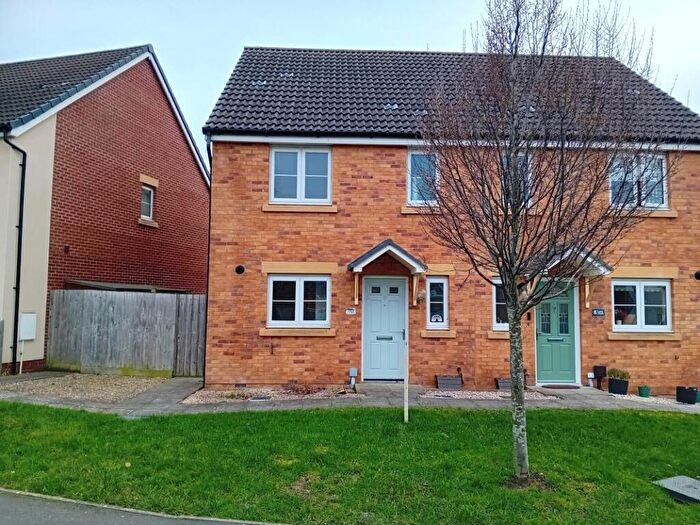
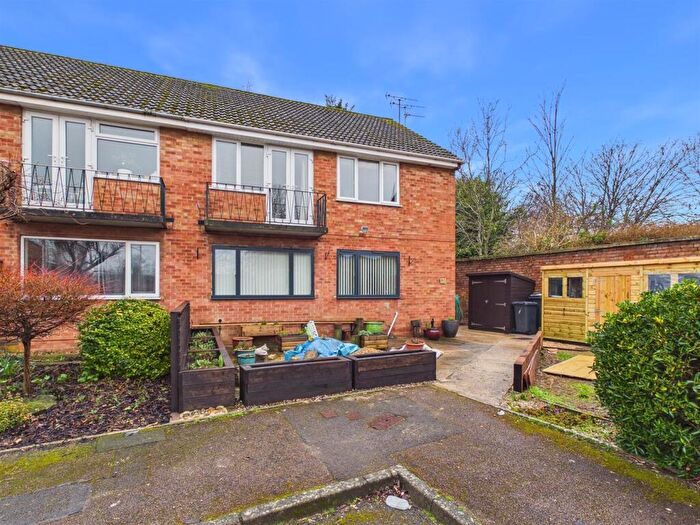
Houses for sale & to rent in Badgeworth, Cheltenham
House Prices in Badgeworth
Properties in Badgeworth have an average house price of £630,264.00 and had 59 Property Transactions within the last 3 years¹.
Badgeworth is an area in Cheltenham, Gloucestershire with 632 households², where the most expensive property was sold for £3,550,000.00.
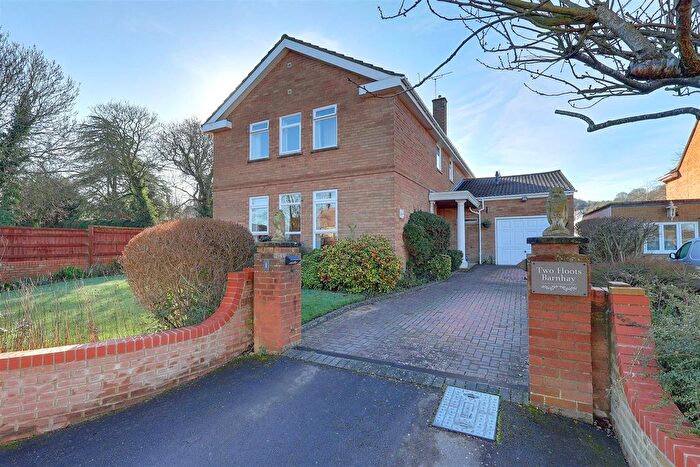
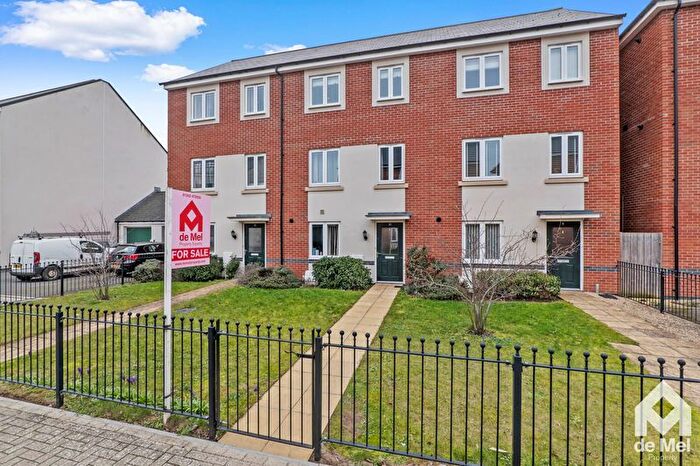
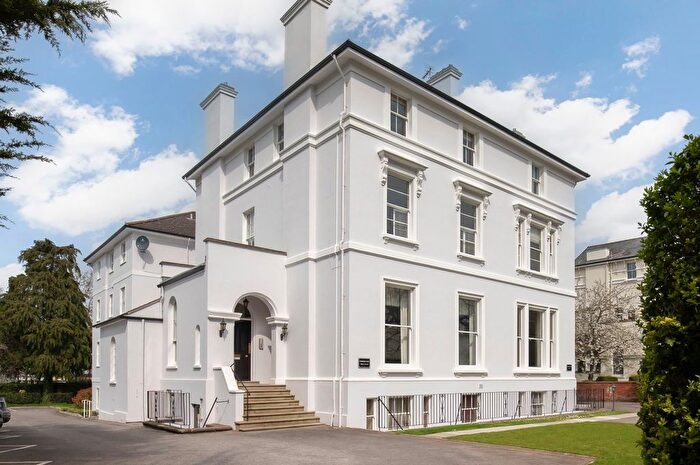
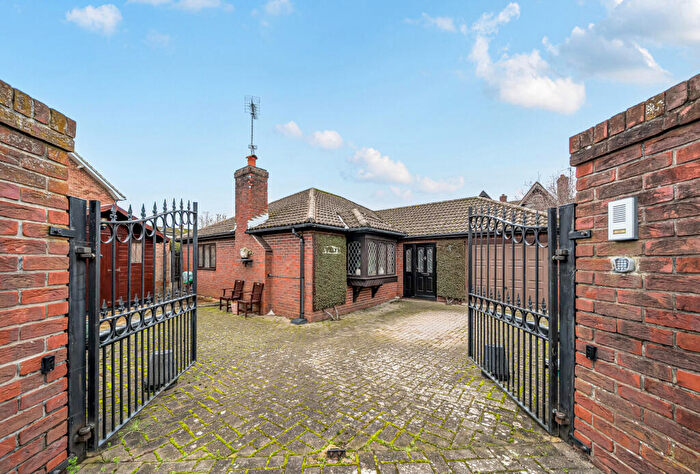
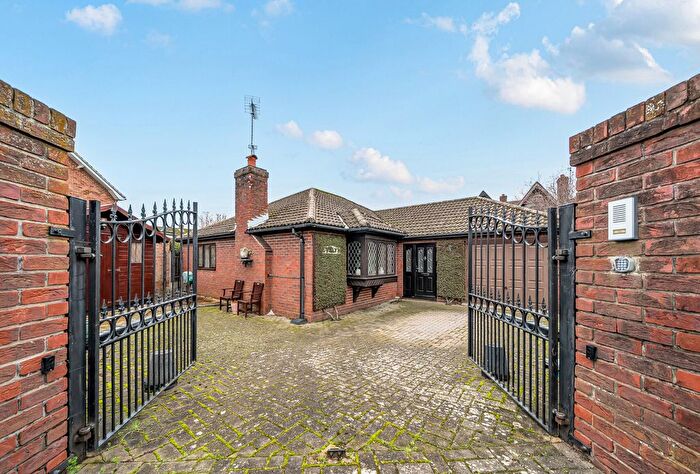
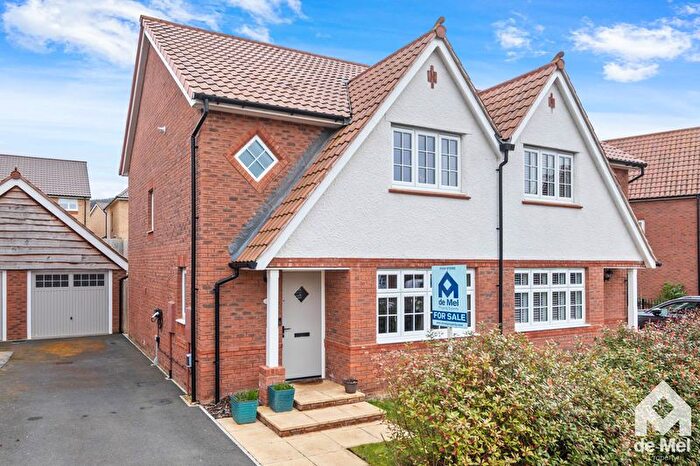
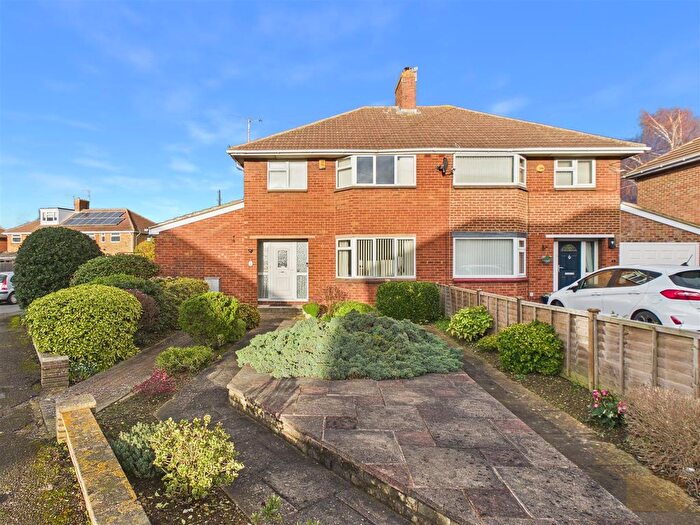
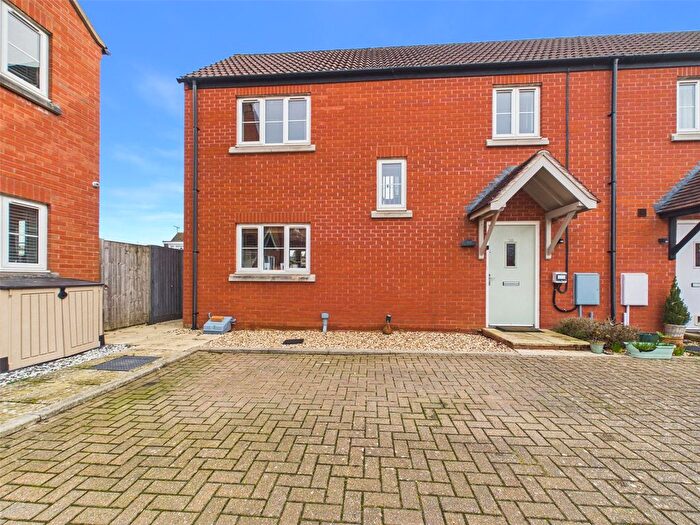
Properties for sale in Badgeworth
Roads and Postcodes in Badgeworth
Navigate through our locations to find the location of your next house in Badgeworth, Cheltenham for sale or to rent.
| Streets | Postcodes |
|---|---|
| Aerotech Business Park | GL51 6TU |
| Badgeworth Lane | GL51 4UH GL51 4UJ GL51 4UQ GL51 4UW |
| Badgeworth Road | GL51 6RJ GL51 6RQ GL51 6TE |
| Bamfurlong Industrial Park | GL51 6SX |
| Bamfurlong Lane | GL51 6SL GL51 6SW GL51 6ST GL51 6SU |
| Barrow | GL51 0TL |
| Beni Close | GL51 6GQ |
| Bentham Lane | GL51 4UT |
| Boddington Lane | GL51 0TJ |
| Boddington Road | GL51 0TN |
| Cherry Orchard | GL51 0TR |
| Cold Pool Lane | GL51 4UP GL51 6LA |
| Egdon Crescent | GL51 6GF |
| Elm Gardens Drive | GL51 6TF |
| Fantasia Drive | GL51 6GS |
| Farhill Close | GL51 0UG |
| Gloucester Road | GL51 0SS GL51 0SU GL51 0TF |
| Green Lane | GL51 4TZ |
| Green Meadows | GL51 6SN |
| Hayden Court Park | GL51 0ST |
| Hayden Lane | GL51 0SP GL51 0SR |
| Herrick Close | GL51 6TL |
| Herrick Way | GL51 6TQ |
| Holst Grove | GL51 6GA GL51 6GB |
| Lambert Avenue | GL51 4SS |
| Little Shurdington | GL51 4TX GL51 4TY |
| Main Road | GL51 4UD GL51 4TU |
| Manor Cottages | GL51 9SZ |
| Messenger Way | GL51 6GH |
| Mystic Corner | GL51 6GE GL51 6GU |
| Old Gloucester Road | GL51 0SW GL51 0TG |
| Orchard Drive | GL51 4AD |
| Planets Lane | GL51 6GR |
| Rhapsody Court | GL51 6GD |
| Sandy Pluck Lane | GL51 4UB |
| Shurdington Road | GL51 4UA GL51 4AE GL51 4UE |
| Slade Barton Cottages | GL51 6GT |
| St Clare Cottages | GL51 0TW |
| Staverton Park | GL51 6TB GL51 6TD |
| Symphony Road | GL51 6GJ |
| Verda Place | GL51 6GL GL51 6GN GL51 6GP |
| Whitelands Lane | GL51 4AF |
| Withy Bridge | GL51 0TH |
| Withybridge Gardens | GL51 9TL |
| GL51 4UL GL51 0TE GL51 0UX GL51 4UG GL53 9QR |
Transport near Badgeworth
- FAQ
- Price Paid By Year
- Property Type Price
Frequently asked questions about Badgeworth
What is the average price for a property for sale in Badgeworth?
The average price for a property for sale in Badgeworth is £630,264. This amount is 49% higher than the average price in Cheltenham. There are more than 10,000 property listings for sale in Badgeworth.
What streets have the most expensive properties for sale in Badgeworth?
The streets with the most expensive properties for sale in Badgeworth are Green Lane at an average of £1,492,000, Little Shurdington at an average of £1,325,000 and St Clare Cottages at an average of £1,214,000.
What streets have the most affordable properties for sale in Badgeworth?
The streets with the most affordable properties for sale in Badgeworth are Mystic Corner at an average of £272,000, Hayden Lane at an average of £300,000 and Bamfurlong Lane at an average of £325,750.
Which train stations are available in or near Badgeworth?
Some of the train stations available in or near Badgeworth are Cheltenham Spa, Gloucester and Ashchurch.
Property Price Paid in Badgeworth by Year
The average sold property price by year was:
| Year | Average Sold Price | Price Change |
Sold Properties
|
|---|---|---|---|
| 2025 | £592,200 | 7% |
14 Properties |
| 2024 | £551,828 | -33% |
23 Properties |
| 2023 | £736,489 | 14% |
22 Properties |
| 2022 | £631,611 | 32% |
36 Properties |
| 2021 | £429,272 | 8% |
22 Properties |
| 2020 | £394,878 | 11% |
31 Properties |
| 2019 | £352,265 | -18% |
32 Properties |
| 2018 | £415,798 | 13% |
31 Properties |
| 2017 | £361,054 | 2% |
36 Properties |
| 2016 | £355,129 | -19% |
27 Properties |
| 2015 | £422,101 | 17% |
23 Properties |
| 2014 | £351,695 | 19% |
41 Properties |
| 2013 | £284,496 | 9% |
82 Properties |
| 2012 | £257,904 | -107% |
72 Properties |
| 2011 | £533,727 | 33% |
11 Properties |
| 2010 | £357,229 | -13% |
17 Properties |
| 2009 | £404,268 | 27% |
11 Properties |
| 2008 | £294,225 | -25% |
10 Properties |
| 2007 | £368,800 | 7% |
16 Properties |
| 2006 | £344,272 | 14% |
20 Properties |
| 2005 | £295,608 | -67% |
12 Properties |
| 2004 | £493,626 | 30% |
12 Properties |
| 2003 | £346,100 | 18% |
15 Properties |
| 2002 | £284,467 | 16% |
17 Properties |
| 2001 | £239,666 | 12% |
12 Properties |
| 2000 | £210,362 | -29% |
20 Properties |
| 1999 | £272,418 | 49% |
22 Properties |
| 1998 | £140,083 | -2% |
15 Properties |
| 1997 | £143,085 | 12% |
21 Properties |
| 1996 | £126,318 | 10% |
19 Properties |
| 1995 | £113,500 | - |
11 Properties |
Property Price per Property Type in Badgeworth
Here you can find historic sold price data in order to help with your property search.
The average Property Paid Price for specific property types in the last three years are:
| Property Type | Average Sold Price | Sold Properties |
|---|---|---|
| Semi Detached House | £371,504.00 | 14 Semi Detached Houses |
| Detached House | £790,290.00 | 38 Detached Houses |
| Terraced House | £279,071.00 | 7 Terraced Houses |

