
Houses for sale in Cheltenham, Gloucestershire
House Prices in Cheltenham
Properties in Cheltenham have an average house price of £424k and had 8,417 Property Transactions within the last 3 years.¹
Cheltenham is an area in Gloucestershire with 75,729 households², where the most expensive property was sold for £5M.
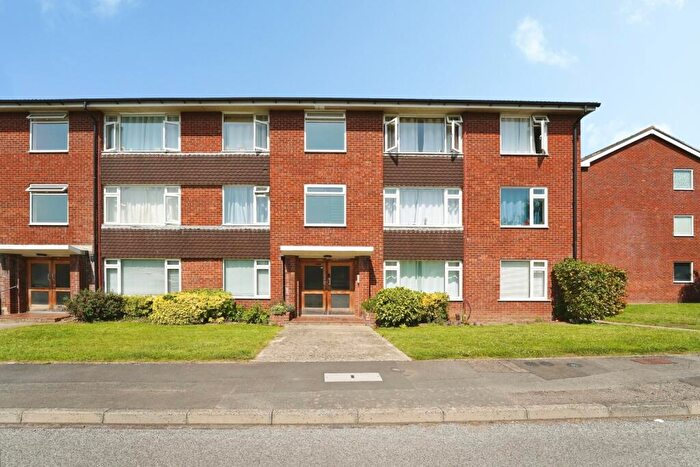
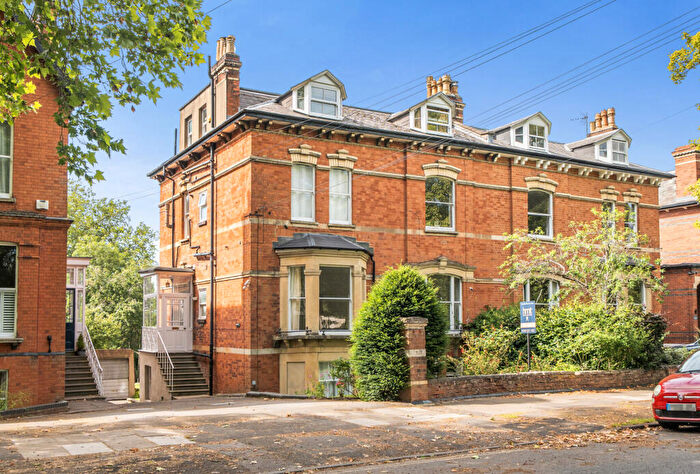
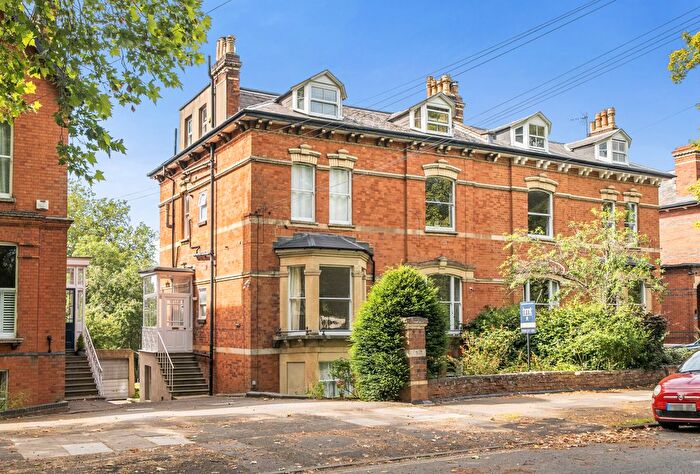
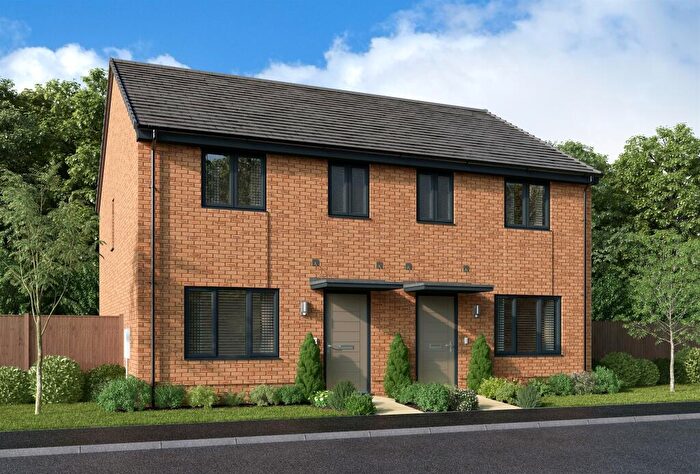
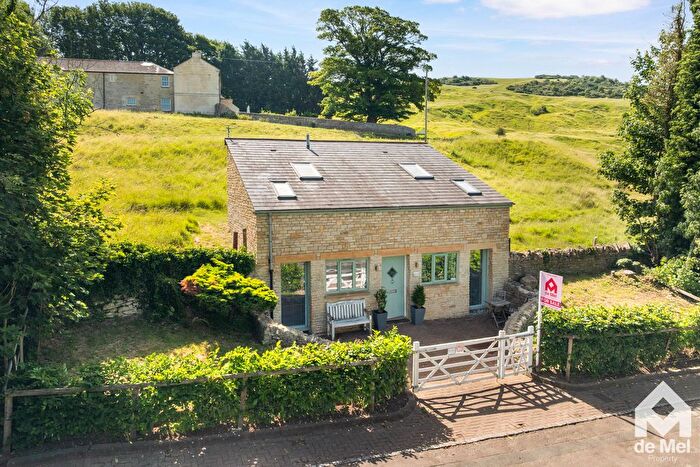
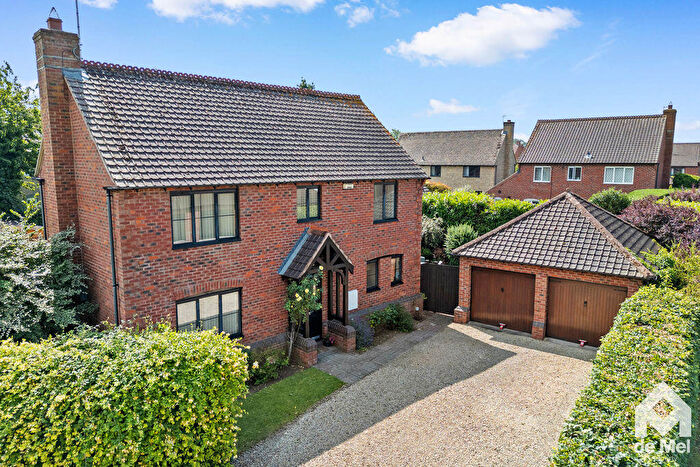
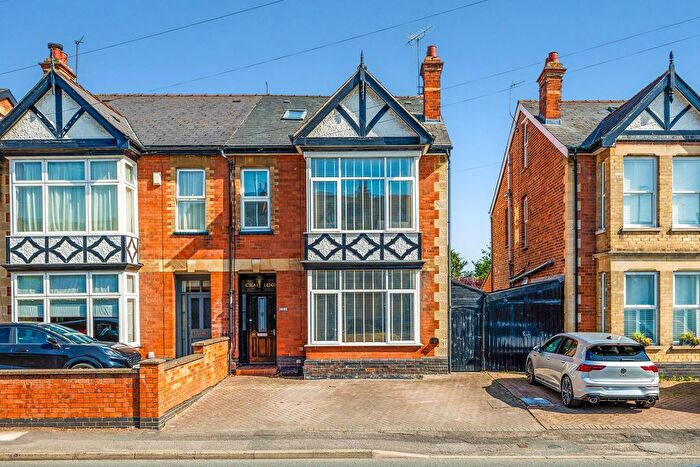
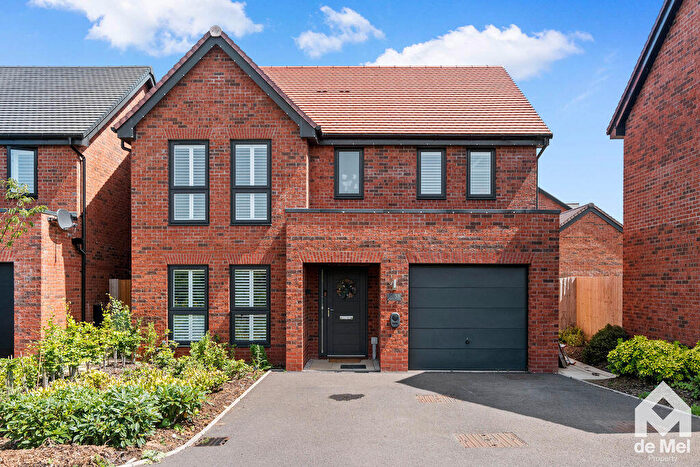
Properties for sale in Cheltenham

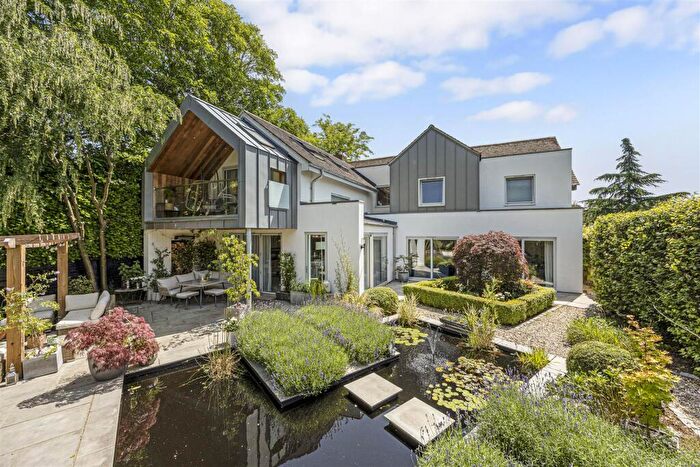
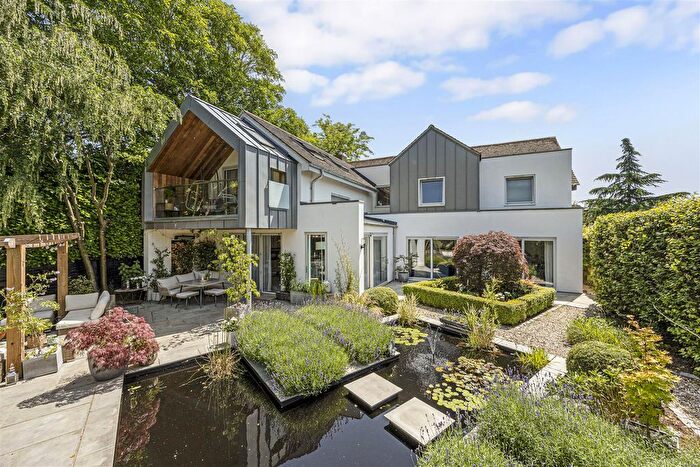
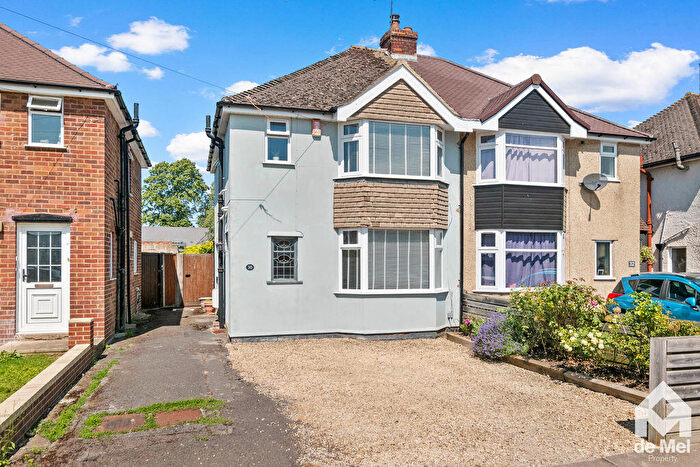
![]()
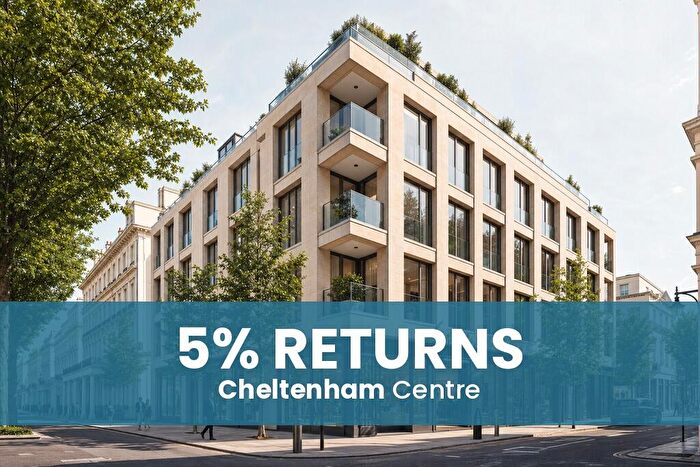
If you are looking to sell your house, let it out, or receive a property valuation, an expert can help you.
Click the button below to get started.


Neighbourhoods in Cheltenham
Navigate through our locations to find the location of your next house in Cheltenham, Gloucestershire for sale or to rent.
- All Saints
- Ampney-coln
- Badgeworth
- Battledown
- Beacon-stow
- Benhall And The Reddings
- Bourton-on-the-water
- Charlton Kings
- Charlton Park
- Chedworth
- Churn Valley
- Cleeve Grange
- Cleeve Hill
- Cleeve St Michaels
- Cleeve West
- College
- Coombe Hill
- Ermin
- Fosseridge
- Hesters Way
- Isbourne
- Lansdown
- Leckhampton
- Northleach
- Oakley
- Oxenton Hill
- Park
- Pittville
- Prestbury
- Rissingtons
- Riversmeet
- Sandywell
- Shurdington
- Springbank
- St Marks
- St Pauls
- St Peters
- Swindon Village
- Three Rivers
- Up Hatherley
- Warden Hill
- Winchcombe
- Severn Vale South
- Churchdown St John's
- Severn Vale North
- Bourton Vale
- The Rissingtons
- Bourton Village
- Coln Valley
- Chedworth & Churn Valley
- Stow
Property price trends in Cheltenham
According to the latest Land Registry data, the average home in Cheltenham sold for £392,362 in 2026. That figure comes from a substantial record of 106,625 sales logged over the past 31 years.
Prices have fallen back over the last three years. Compared with 2023, when the typical sale came in around £422,360, that's a fall of roughly 7.1%.
Looking back five years, average prices are down about 1.7% since 2021, a drop of around £6,675 in cash terms.
Zoom out to the past decade for the fuller picture. Back in 2016, homes here averaged £309,537, so the typical sold price has climbed about 26.8% since then, roughly 2.4% a year. Stretch the view to fifteen years and that annual pace edges up closer to 2.6%.
Frequently asked questions about Cheltenham
What is the average price for a property for sale in Cheltenham?
The average price for a property for sale in Cheltenham is £424,275. This amount is 13% higher than the average price in Gloucestershire. There are more than 10,000 property listings for sale in Cheltenham.
What locations have the most expensive properties for sale in Cheltenham?
The locations with the most expensive properties for sale in Cheltenham are Bourton Vale at an average of £1,516,666, Ermin at an average of £1,482,043 and Ampney-coln at an average of £1,319,166.
What locations have the most affordable properties for sale in Cheltenham?
The locations with the most affordable properties for sale in Cheltenham are St Pauls at an average of £244,016, Springbank at an average of £253,281 and Hesters Way at an average of £254,481.
Which train stations are available in or near Cheltenham?
Some of the train stations available in or near Cheltenham are Cheltenham Spa, Ashchurch and Gloucester.
Property Price Paid in Cheltenham by Year
The average sold property price by year was:
| Year | Average Sold Price | Price Change |
Sold Properties
|
|---|---|---|---|
| 2026 | £392,362 | -6% |
179 Properties |
| 2025 | £417,547 | -4% |
2,765 Properties |
| 2024 | £434,350 | 3% |
2,902 Properties |
| 2023 | £422,360 | 0,1% |
2,571 Properties |
| 2022 | £422,110 | 5% |
3,211 Properties |
| 2021 | £399,037 | 6% |
4,069 Properties |
| 2020 | £375,411 | 6% |
2,900 Properties |
| 2019 | £352,851 | 2% |
3,204 Properties |
| 2018 | £344,229 | 3% |
3,654 Properties |
| 2017 | £335,073 | 8% |
3,819 Properties |
Property Price per Property Type in Cheltenham
Here you can find historic sold price data in order to help with your property search.
The average Property Paid Price for specific property types in the last three years are:
| Property Type | Average Sold Price | Sold Properties |
|---|---|---|
| Semi Detached House | £407,337.00 | 2,412 Semi Detached Houses |
| Terraced House | £349,392.00 | 2,163 Terraced Houses |
| Detached House | £707,841.00 | 1,936 Detached Houses |
| Flat | £242,661.00 | 1,906 Flats |
Transport in Cheltenham
Please see below transportation links in this area:
