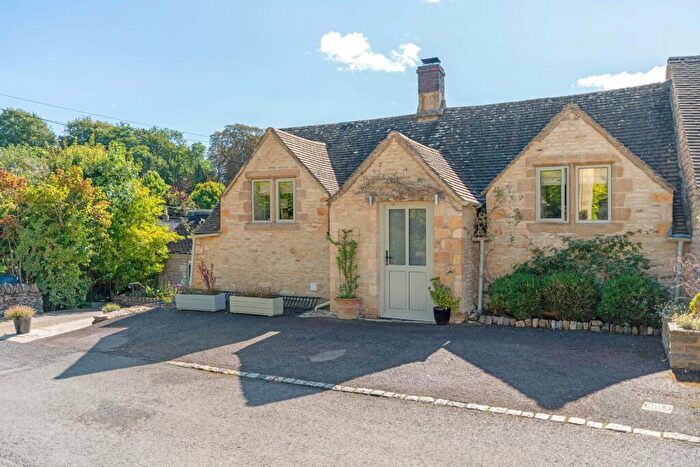
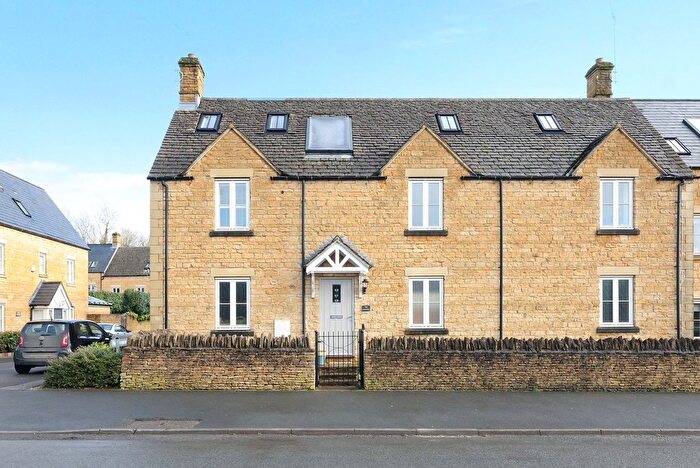
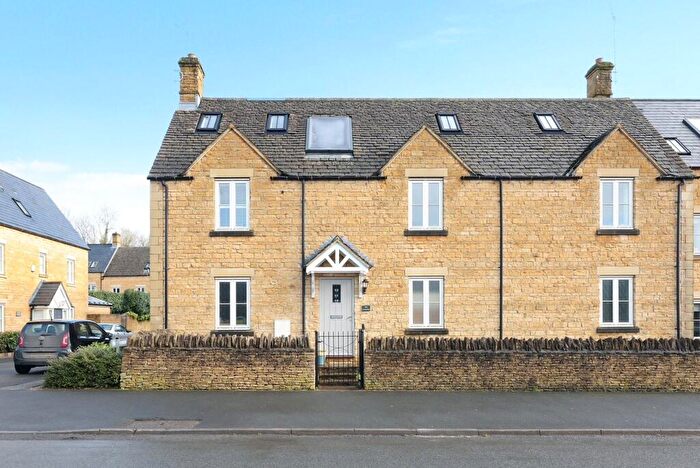
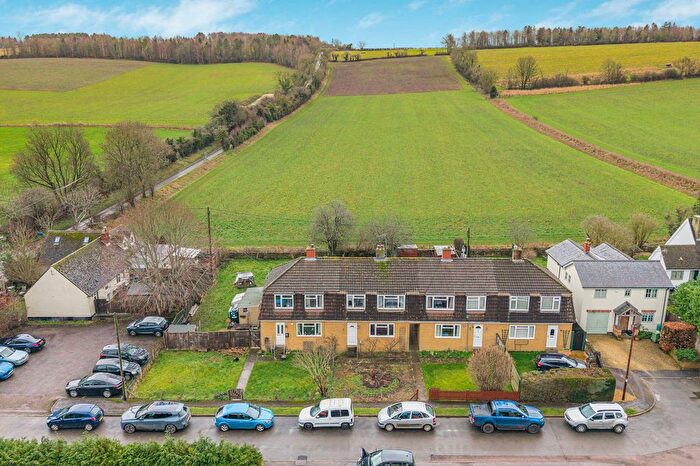
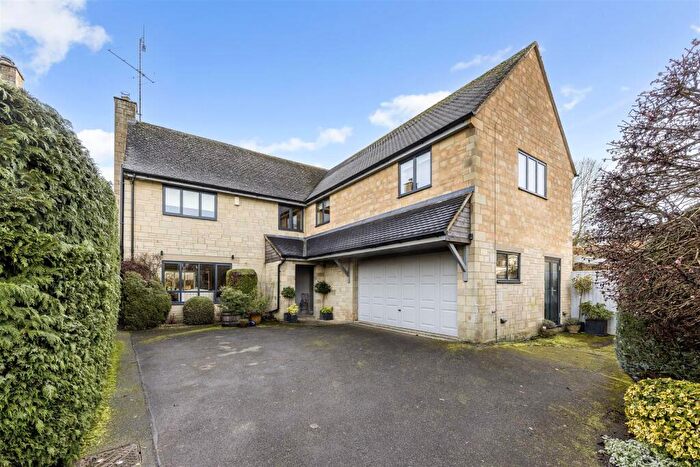
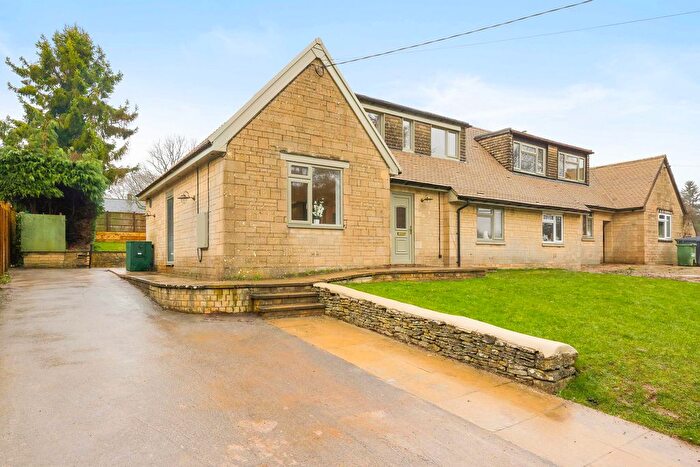
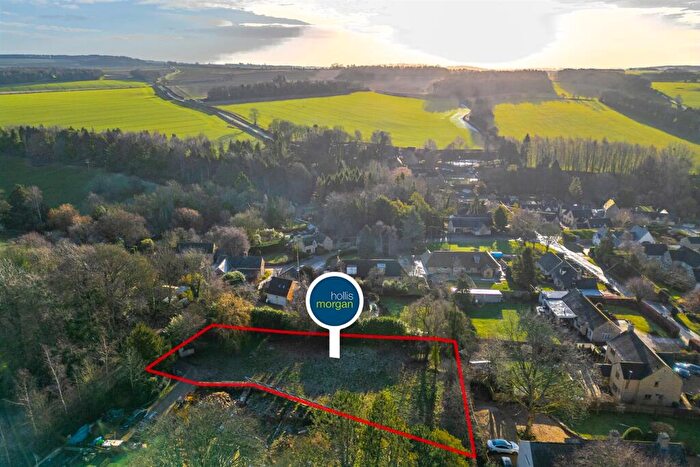
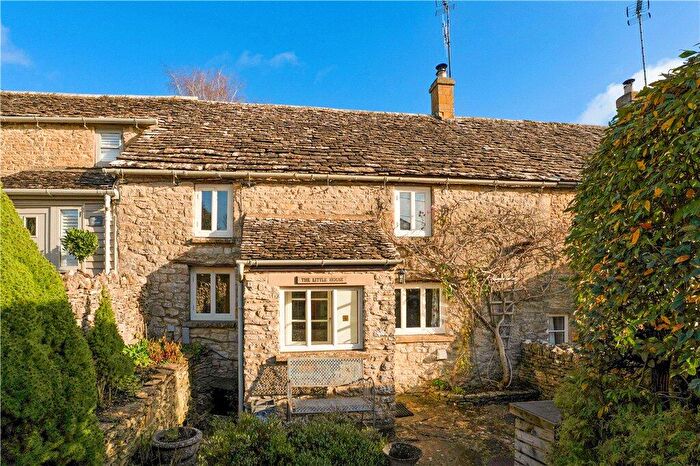
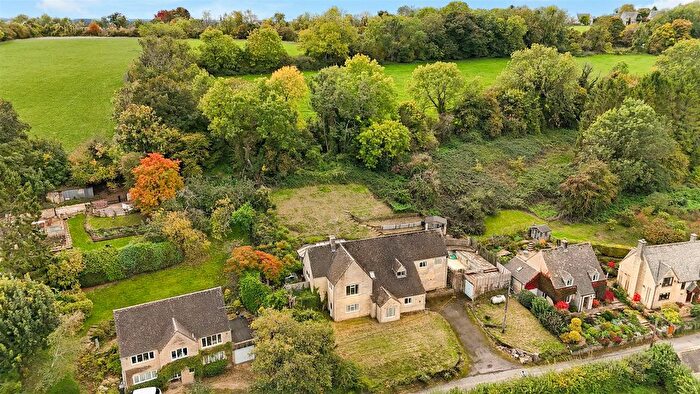
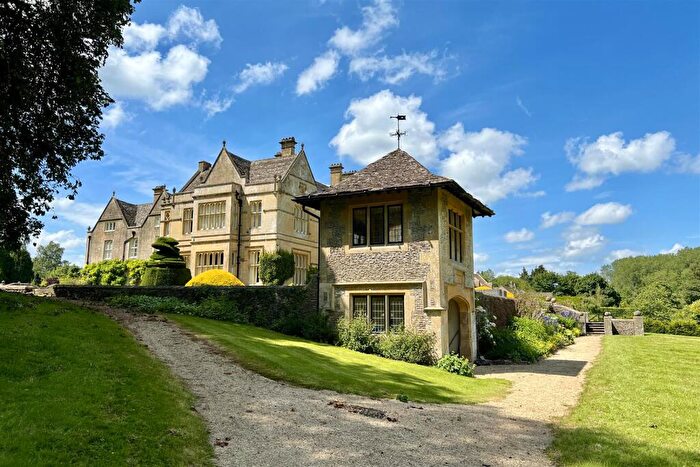
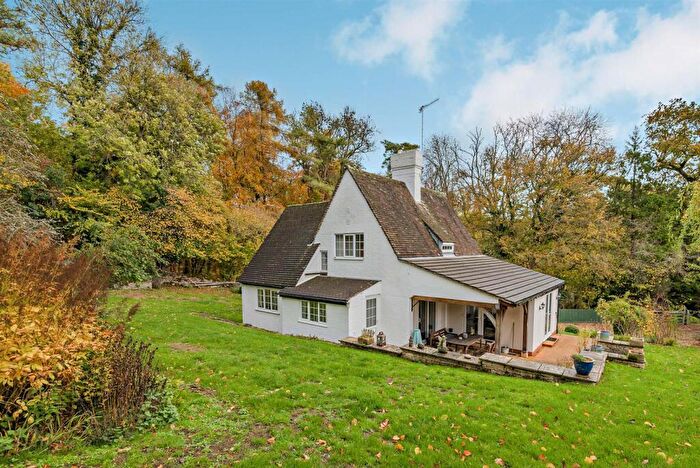
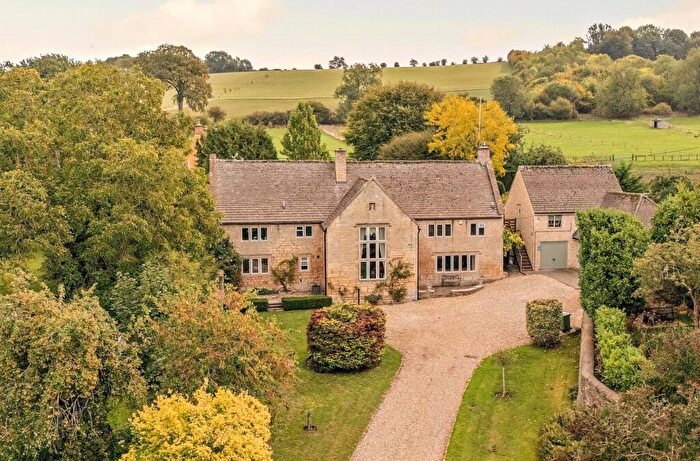
Houses for sale & to rent in Chedworth, Cheltenham
House Prices in Chedworth
Properties in Chedworth have an average house price of £820,424.00 and had 43 Property Transactions within the last 3 years¹.
Chedworth is an area in Cheltenham, Gloucestershire with 593 households², where the most expensive property was sold for £2,200,000.00.
Properties for sale in Chedworth
Roads and Postcodes in Chedworth
Navigate through our locations to find the location of your next house in Chedworth, Cheltenham for sale or to rent.
| Streets | Postcodes |
|---|---|
| Ballingers Row | GL54 4AQ |
| Brassington Gardens | GL54 4DG |
| Calves Hill | GL54 4AH |
| Cheap Street | GL54 4AA GL54 4AB |
| Compton Farm Cottages | GL54 4DL |
| Compton Rise | GL54 4DB |
| Courts Close | GL54 4AF |
| Field Road | GL54 4NG |
| Fields Road | GL54 4NJ GL54 4NQ |
| Fossebridge | GL54 3JP GL54 3JR GL54 3JS |
| Foxcote | GL54 4LP GL54 4LW |
| Green Lane | GL54 4AR GL54 4AS |
| Harnham Lane | GL54 4DD |
| Hemplands | GL54 4NH |
| High Street | GL54 4BQ |
| Kilkenny | GL54 4LN |
| Kings Head Lane | GL54 4BD |
| London Road | GL54 4HG |
| Lower Chedworth | GL54 4AN |
| Lower Dowdeswell | GL54 4LX |
| Middle Chedworth | GL54 4AJ GL54 4AL |
| Pancake Hill | GL54 4AP GL54 4AW |
| Pike Hill Rise | GL54 4DW |
| Queen Street | GL54 4AG |
| Romans Yard | GL54 4NY |
| The Farthings | GL54 4DF |
| The Laines | GL54 4NS |
| Upper Cottages | GL54 4DP |
| Upper Dowdeswell | GL54 4LT GL54 4LU |
| Withington Road | GL54 4LL |
| Woodbridge Lane | GL54 4BA GL54 4BP |
| Woodview Cottages | GL54 4BN |
| GL54 4BB GL54 4BE GL54 4BS GL54 4DA GL54 4DN GL54 4DR GL54 4DS GL54 4NE GL54 4NF |
Transport near Chedworth
-
Cheltenham Spa Station
-
Kemble Station
-
Gloucester Station
-
Stroud Station
-
Kingham Station
-
Ashchurch Station
-
Shipton Station
- FAQ
- Price Paid By Year
- Property Type Price
Frequently asked questions about Chedworth
What is the average price for a property for sale in Chedworth?
The average price for a property for sale in Chedworth is £820,424. This amount is 94% higher than the average price in Cheltenham. There are 317 property listings for sale in Chedworth.
What streets have the most expensive properties for sale in Chedworth?
The streets with the most expensive properties for sale in Chedworth are Lower Chedworth at an average of £1,552,500, High Street at an average of £1,525,000 and Middle Chedworth at an average of £1,177,500.
What streets have the most affordable properties for sale in Chedworth?
The streets with the most affordable properties for sale in Chedworth are Hemplands at an average of £260,000, Ballingers Row at an average of £305,000 and Brassington Gardens at an average of £317,000.
Which train stations are available in or near Chedworth?
Some of the train stations available in or near Chedworth are Cheltenham Spa, Kemble and Gloucester.
Property Price Paid in Chedworth by Year
The average sold property price by year was:
| Year | Average Sold Price | Price Change |
Sold Properties
|
|---|---|---|---|
| 2025 | £718,255 | -7% |
15 Properties |
| 2024 | £768,638 | -26% |
13 Properties |
| 2023 | £967,474 | 28% |
15 Properties |
| 2022 | £696,954 | 0,1% |
22 Properties |
| 2021 | £696,522 | -13% |
18 Properties |
| 2020 | £789,500 | -22% |
24 Properties |
| 2019 | £966,884 | 36% |
13 Properties |
| 2018 | £616,763 | 1% |
19 Properties |
| 2017 | £611,442 | -0,2% |
26 Properties |
| 2016 | £612,858 | 10% |
17 Properties |
| 2015 | £551,797 | -13% |
20 Properties |
| 2014 | £624,739 | 11% |
23 Properties |
| 2013 | £558,931 | 24% |
26 Properties |
| 2012 | £423,072 | -0,3% |
11 Properties |
| 2011 | £424,538 | -10% |
13 Properties |
| 2010 | £467,461 | 4% |
13 Properties |
| 2009 | £448,249 | -29% |
12 Properties |
| 2008 | £576,500 | 23% |
11 Properties |
| 2007 | £442,804 | -25% |
23 Properties |
| 2006 | £552,627 | 34% |
21 Properties |
| 2005 | £363,060 | 12% |
23 Properties |
| 2004 | £319,590 | -20% |
11 Properties |
| 2003 | £382,166 | 28% |
27 Properties |
| 2002 | £273,721 | -17% |
30 Properties |
| 2001 | £319,038 | 43% |
30 Properties |
| 2000 | £182,779 | -6% |
21 Properties |
| 1999 | £193,638 | -20% |
21 Properties |
| 1998 | £232,473 | 34% |
23 Properties |
| 1997 | £152,844 | 1% |
25 Properties |
| 1996 | £151,011 | 7% |
27 Properties |
| 1995 | £141,163 | - |
23 Properties |
Property Price per Property Type in Chedworth
Here you can find historic sold price data in order to help with your property search.
The average Property Paid Price for specific property types in the last three years are:
| Property Type | Average Sold Price | Sold Properties |
|---|---|---|
| Semi Detached House | £530,000.00 | 6 Semi Detached Houses |
| Detached House | £1,020,801.00 | 29 Detached Houses |
| Terraced House | £311,875.00 | 8 Terraced Houses |

