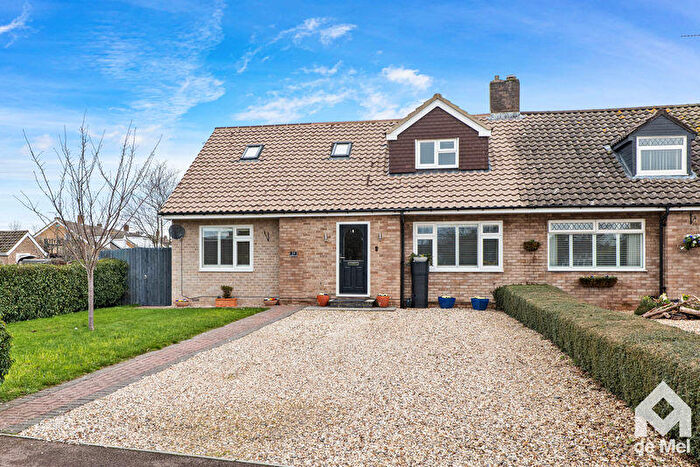
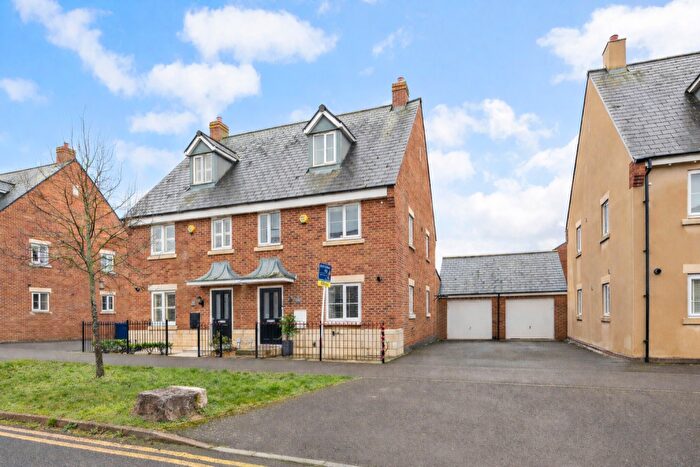
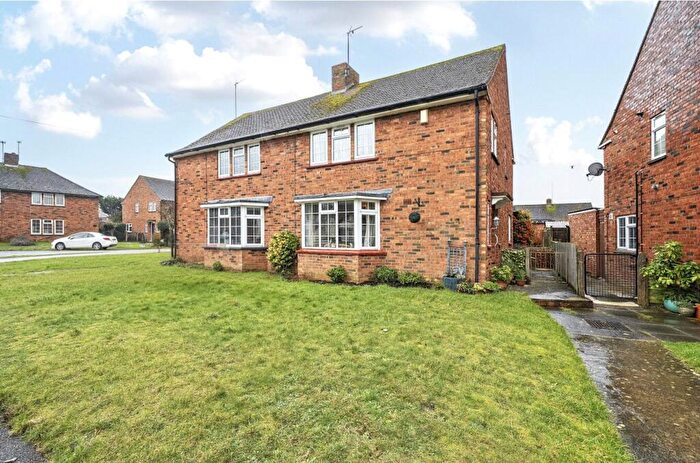
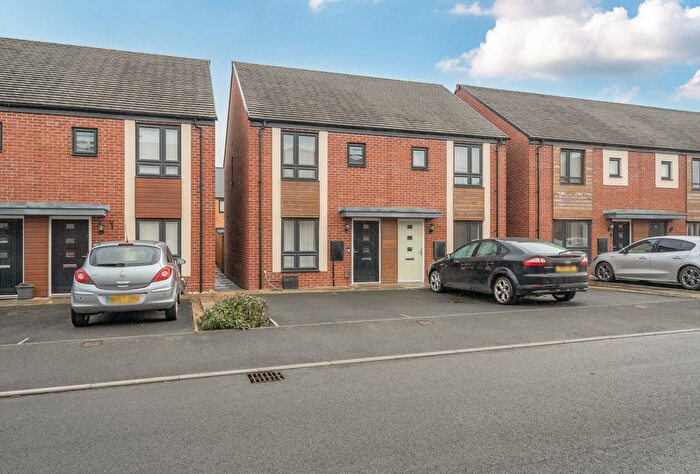
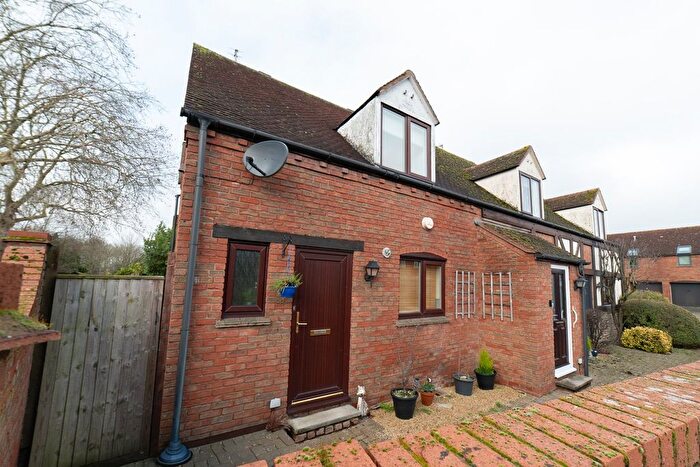
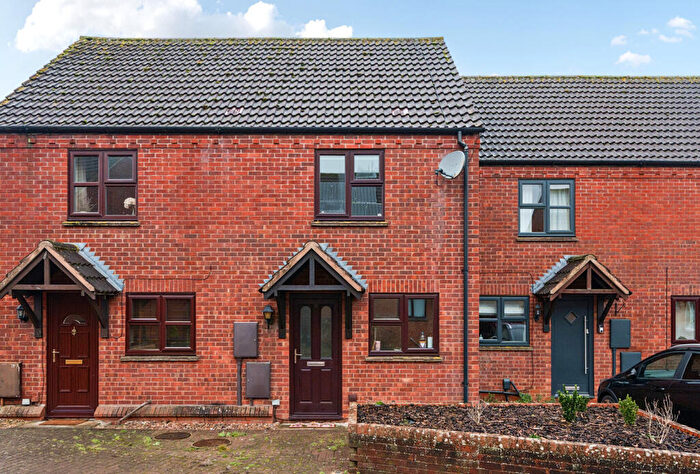
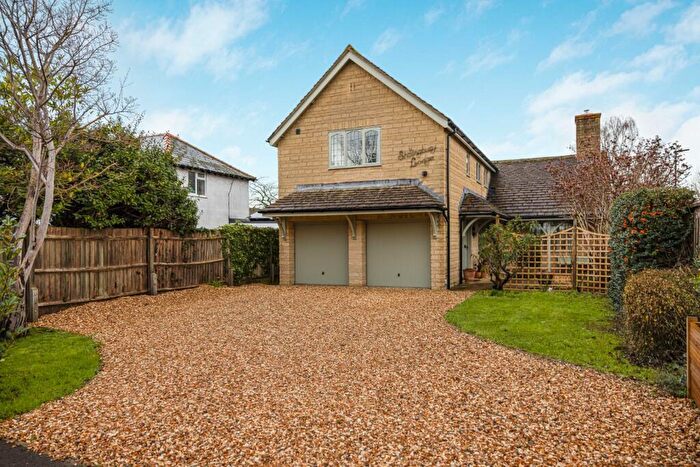
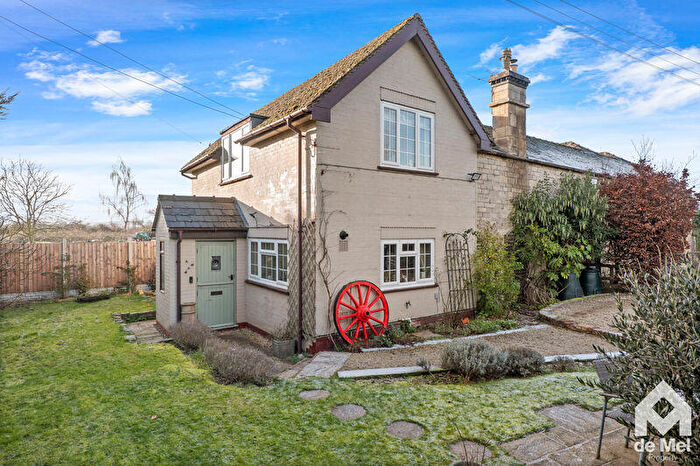
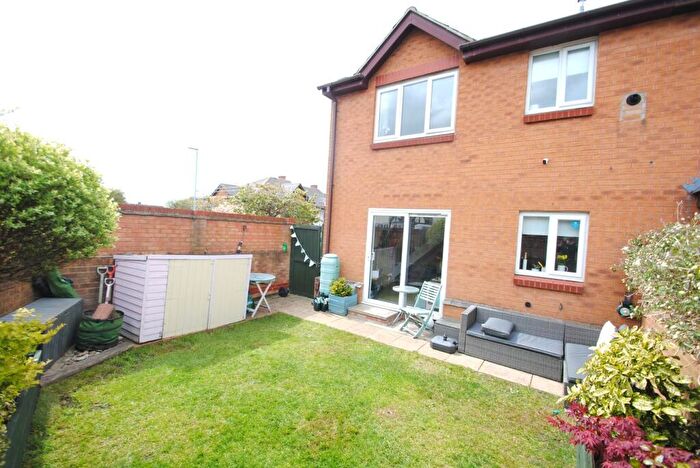
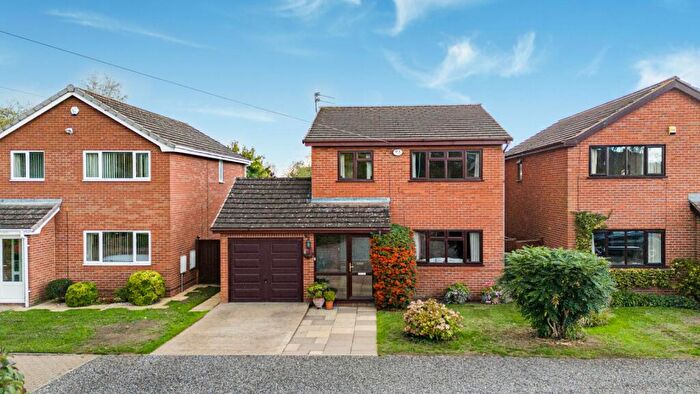
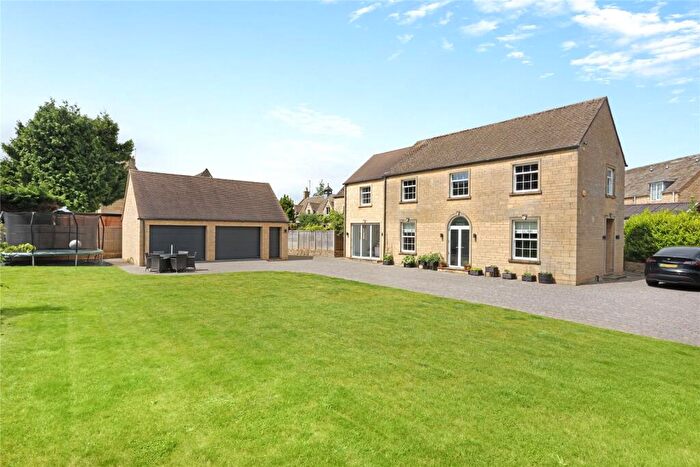
Houses for sale & to rent in Cleeve Grange, Cheltenham
House Prices in Cleeve Grange
Properties in Cleeve Grange have an average house price of £332,303.00 and had 111 Property Transactions within the last 3 years¹.
Cleeve Grange is an area in Cheltenham, Gloucestershire with 956 households², where the most expensive property was sold for £675,000.00.
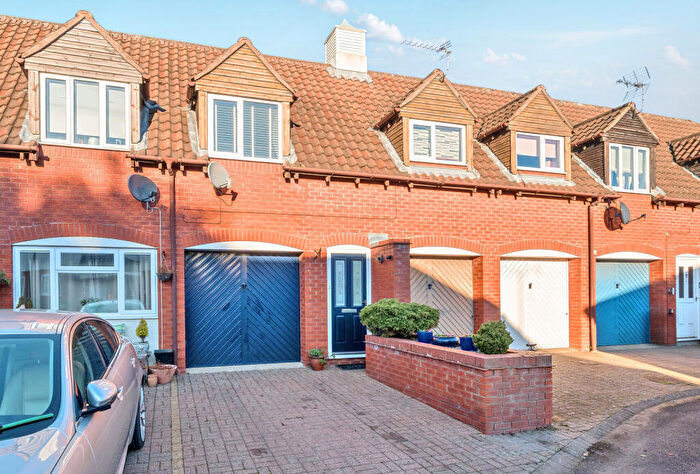
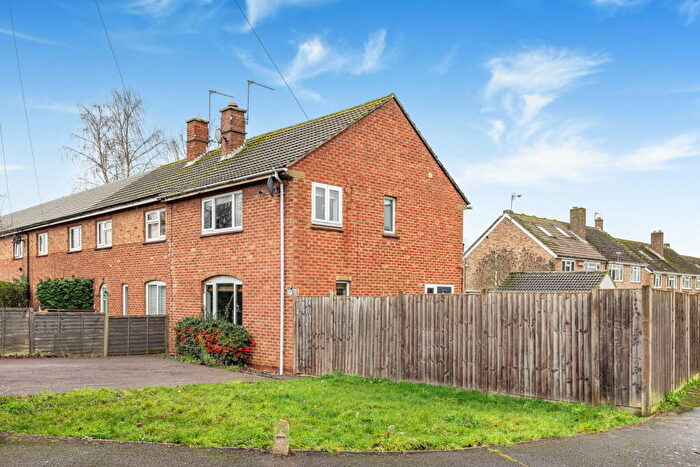
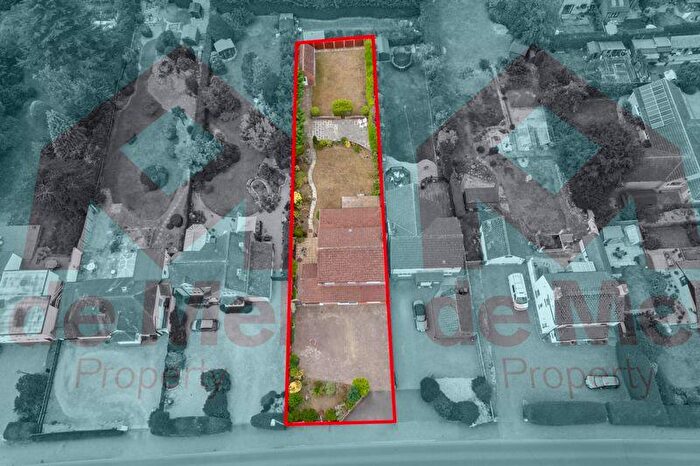
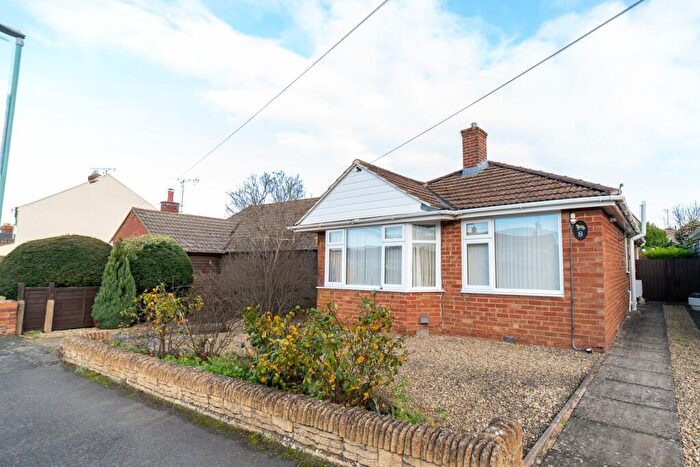
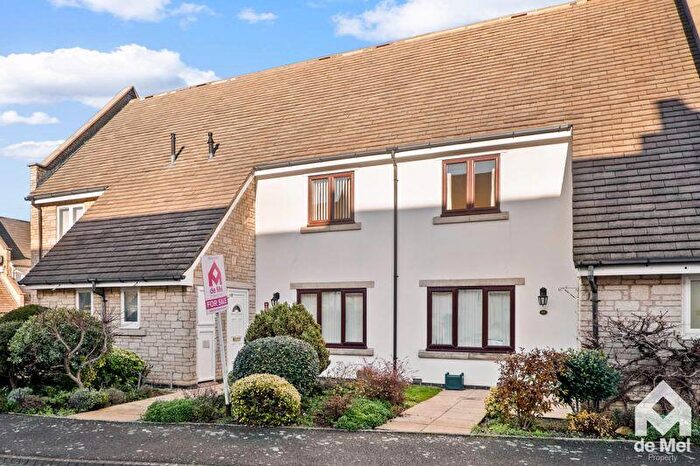
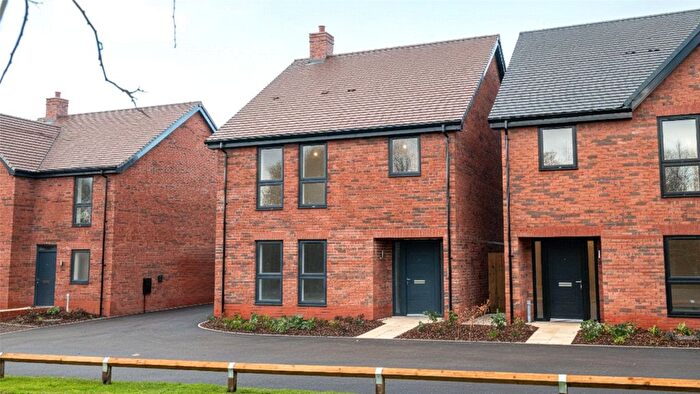
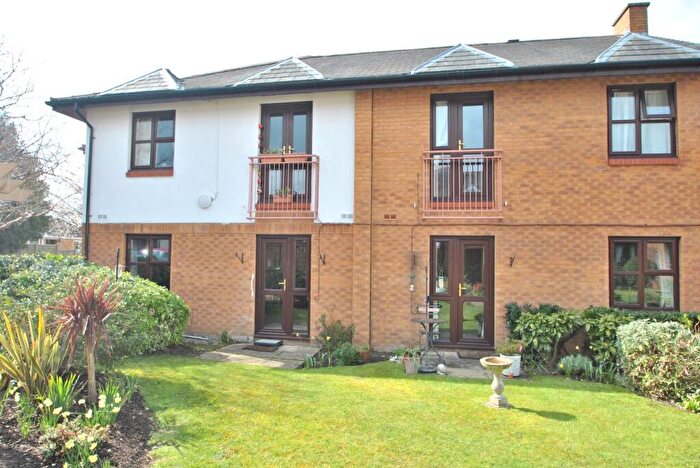
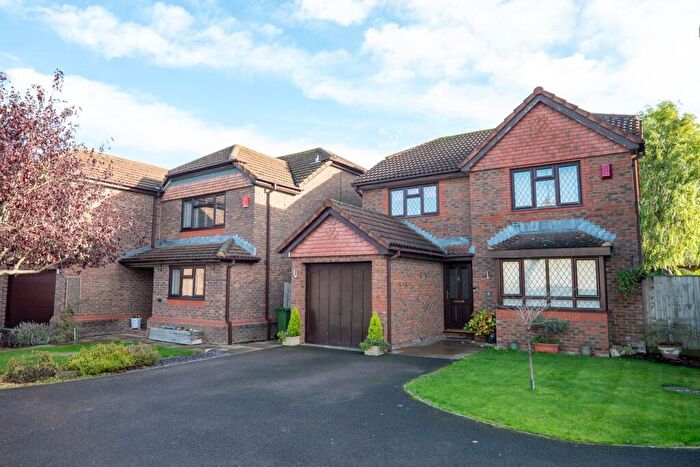
Properties for sale in Cleeve Grange
Roads and Postcodes in Cleeve Grange
Navigate through our locations to find the location of your next house in Cleeve Grange, Cheltenham for sale or to rent.
| Streets | Postcodes |
|---|---|
| Abbots Mews | GL52 8UP |
| Alverton Drive | GL52 8TD |
| Bregawn Close | GL52 8SZ |
| Brockhampton Lane | GL51 9RS |
| Cantors Court | GL52 8WA |
| Cantors Drive | GL52 8YF GL52 8YG |
| Chandler Road | GL52 8EJ |
| Chantry Gate | GL52 8UR |
| Cheltenham Road | GL52 8LZ GL52 8NH |
| Crown Close | GL52 8DZ |
| Crown Drive | GL52 8AZ GL52 8DY GL52 8EA GL52 8EF GL52 8TA |
| Deacons Place | GL52 8UQ |
| Delabere Road | GL52 8AJ GL52 8AL GL52 8AN |
| Denley Close | GL52 8EG |
| Ellenborough Road | GL52 8AH GL52 8AQ |
| Gilder Road | GL52 8AY |
| Gotherington Lane | GL52 8GJ |
| Grangefield Approach | GL52 8GL |
| Harpfield Close | GL52 8EE |
| Harpfield Road | GL52 8EB GL52 8ED |
| Holder Road | GL52 8EQ |
| Kayte Close | GL52 8AX |
| Kayte Lane | GL52 8AP GL52 8AR GL52 8AT GL52 8AS |
| Kingswood Close | GL52 8SL |
| Mayfield Close | GL52 8NA |
| Meadow Lea | GL52 8UX |
| Meadoway | GL52 8NB GL52 8ND |
| Moreton Close | GL52 8AW |
| Pagets Road | GL52 8AG |
| Read Way | GL52 8EH GL52 8EL |
| Sunnycroft Close | GL52 8AU |
| The Holt | GL52 8NQ |
| The Nurseries | GL52 8XB |
| Two Hedges Road | GL52 8AD GL52 8DS GL52 8DX GL52 8AE |
| GL52 8RD GL52 8YQ |
Transport near Cleeve Grange
- FAQ
- Price Paid By Year
- Property Type Price
Frequently asked questions about Cleeve Grange
What is the average price for a property for sale in Cleeve Grange?
The average price for a property for sale in Cleeve Grange is £332,303. This amount is 21% lower than the average price in Cheltenham. There are 938 property listings for sale in Cleeve Grange.
What streets have the most expensive properties for sale in Cleeve Grange?
The streets with the most expensive properties for sale in Cleeve Grange are The Holt at an average of £613,333, The Nurseries at an average of £530,000 and Bregawn Close at an average of £485,000.
What streets have the most affordable properties for sale in Cleeve Grange?
The streets with the most affordable properties for sale in Cleeve Grange are Abbots Mews at an average of £171,833, Chantry Gate at an average of £196,875 and Deacons Place at an average of £213,000.
Which train stations are available in or near Cleeve Grange?
Some of the train stations available in or near Cleeve Grange are Cheltenham Spa, Ashchurch and Gloucester.
Property Price Paid in Cleeve Grange by Year
The average sold property price by year was:
| Year | Average Sold Price | Price Change |
Sold Properties
|
|---|---|---|---|
| 2025 | £328,095 | 3% |
32 Properties |
| 2024 | £318,917 | -11% |
46 Properties |
| 2023 | £355,045 | 14% |
33 Properties |
| 2022 | £305,252 | -3% |
53 Properties |
| 2021 | £314,285 | -1% |
40 Properties |
| 2020 | £318,640 | 19% |
32 Properties |
| 2019 | £259,563 | -5% |
43 Properties |
| 2018 | £272,243 | 4% |
45 Properties |
| 2017 | £261,966 | 9% |
37 Properties |
| 2016 | £237,868 | -12% |
44 Properties |
| 2015 | £266,360 | 17% |
36 Properties |
| 2014 | £220,783 | -7% |
59 Properties |
| 2013 | £236,328 | 11% |
35 Properties |
| 2012 | £210,915 | 10% |
30 Properties |
| 2011 | £188,936 | -23% |
33 Properties |
| 2010 | £232,018 | 24% |
24 Properties |
| 2009 | £175,345 | -14% |
26 Properties |
| 2008 | £199,792 | -10% |
29 Properties |
| 2007 | £218,874 | 11% |
45 Properties |
| 2006 | £194,041 | 13% |
77 Properties |
| 2005 | £167,978 | -16% |
46 Properties |
| 2004 | £194,764 | 18% |
41 Properties |
| 2003 | £159,597 | 14% |
43 Properties |
| 2002 | £137,923 | 12% |
54 Properties |
| 2001 | £121,624 | 13% |
60 Properties |
| 2000 | £105,288 | 20% |
47 Properties |
| 1999 | £84,157 | -42% |
91 Properties |
| 1998 | £119,337 | 32% |
71 Properties |
| 1997 | £80,919 | 18% |
67 Properties |
| 1996 | £66,729 | 5% |
60 Properties |
| 1995 | £63,277 | - |
57 Properties |
Property Price per Property Type in Cleeve Grange
Here you can find historic sold price data in order to help with your property search.
The average Property Paid Price for specific property types in the last three years are:
| Property Type | Average Sold Price | Sold Properties |
|---|---|---|
| Semi Detached House | £338,017.00 | 60 Semi Detached Houses |
| Detached House | £477,717.00 | 25 Detached Houses |
| Terraced House | £216,566.00 | 15 Terraced Houses |
| Flat | £128,477.00 | 11 Flats |

