
Houses for sale in Fosseridge, Cheltenham
House Prices in Fosseridge
Properties in Fosseridge have an average house price of £1.06M and had 7 Property Transactions within the last 3 years¹.
Fosseridge is an area in Cheltenham, Gloucestershire with 109 households², where the most expensive property was sold for £2.95M.
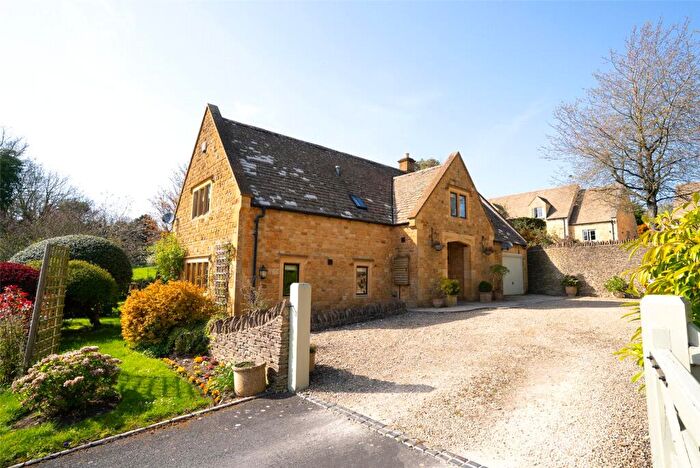
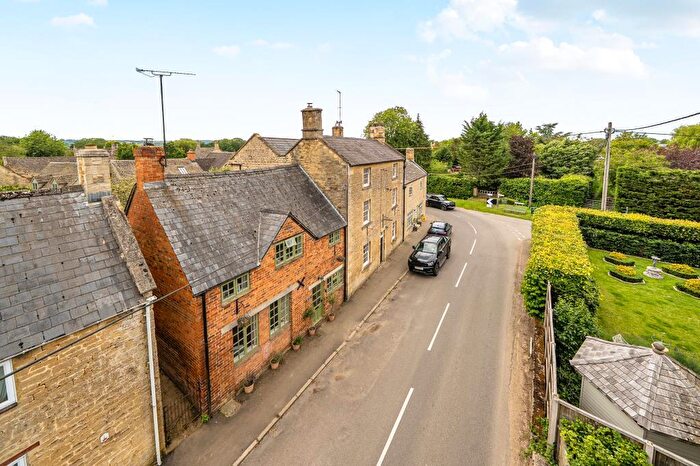
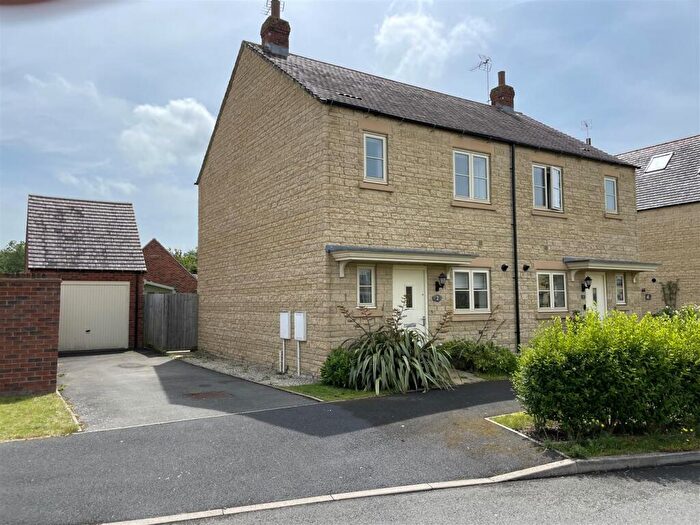
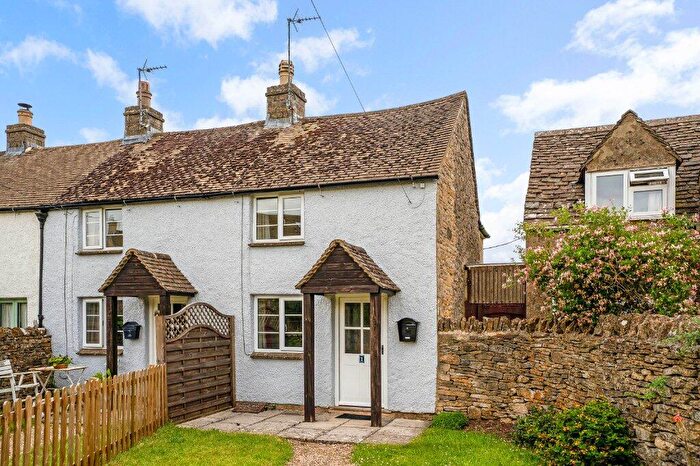
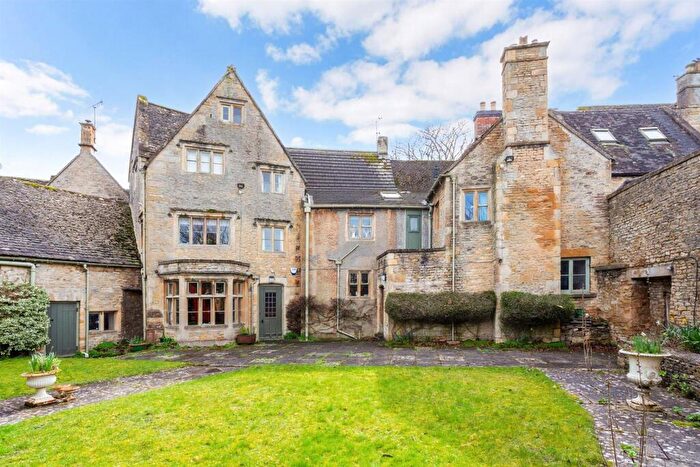
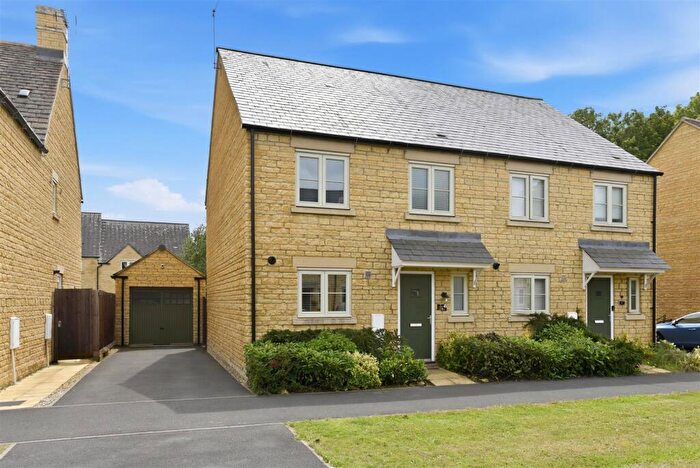
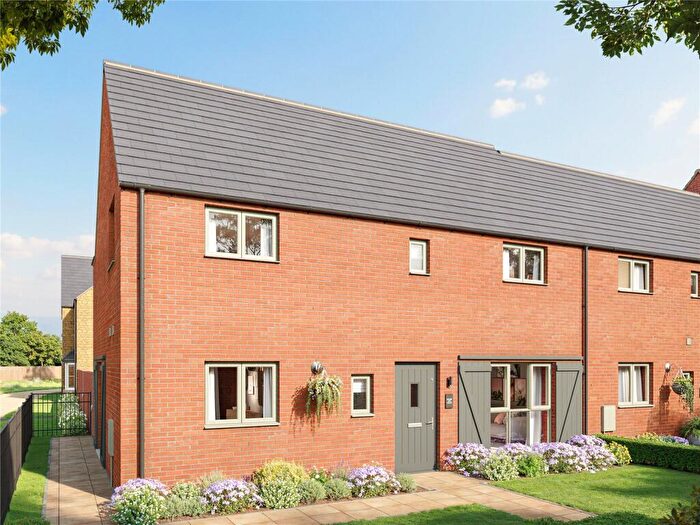
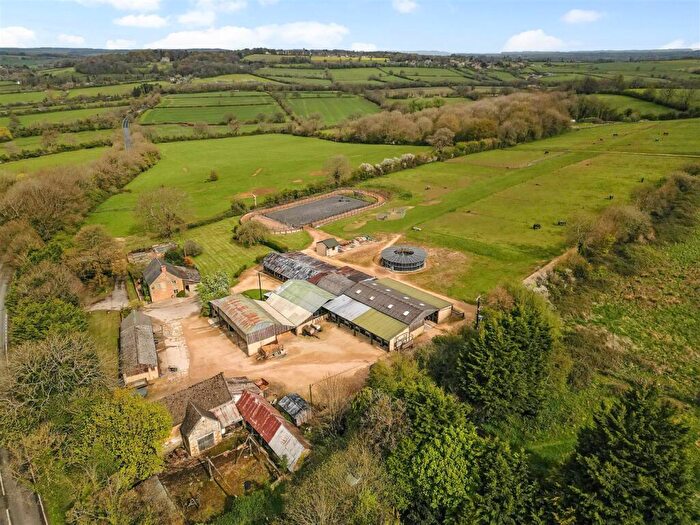
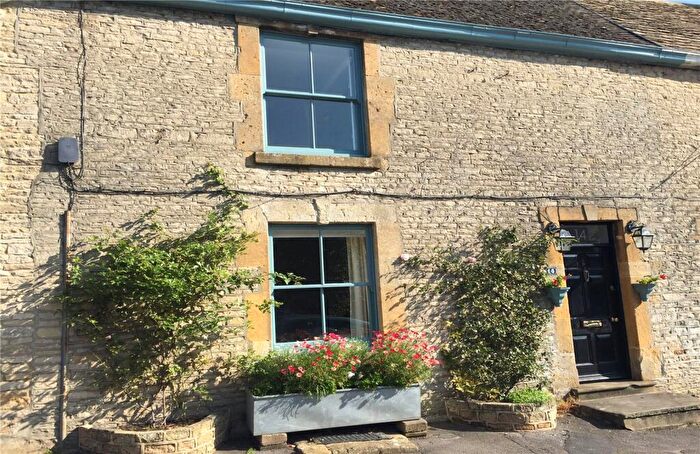
Properties for sale in Fosseridge
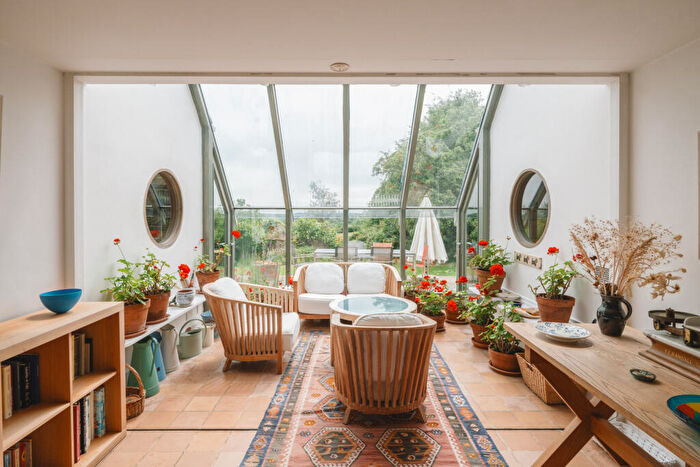
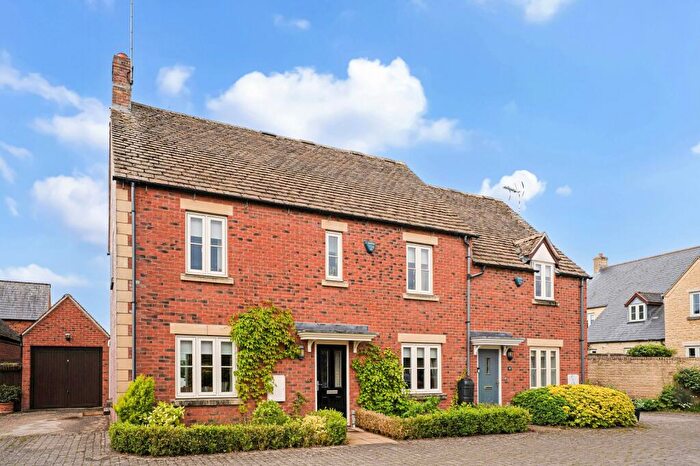
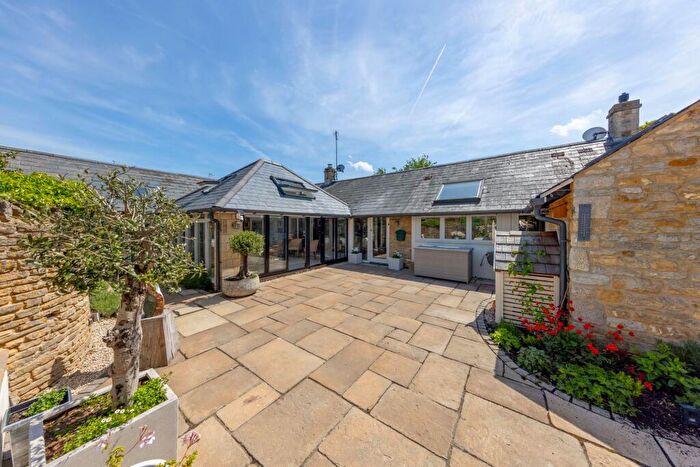
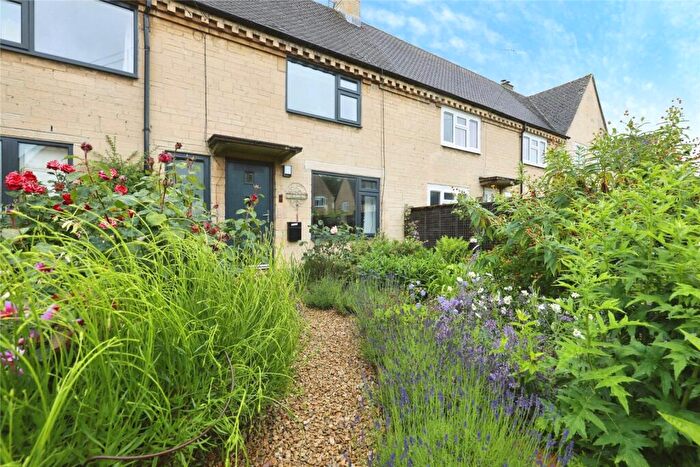
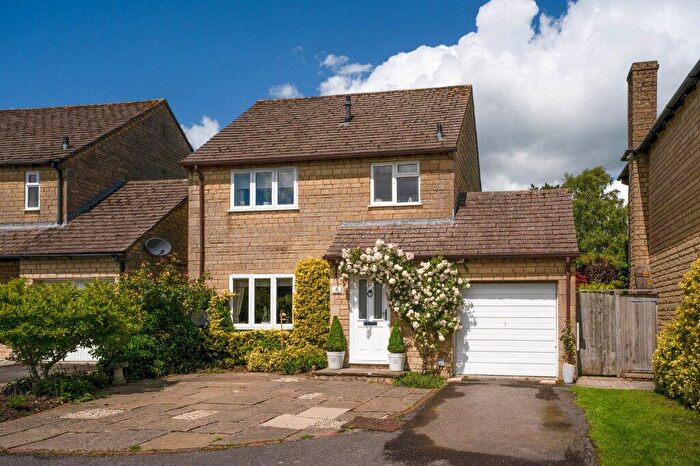
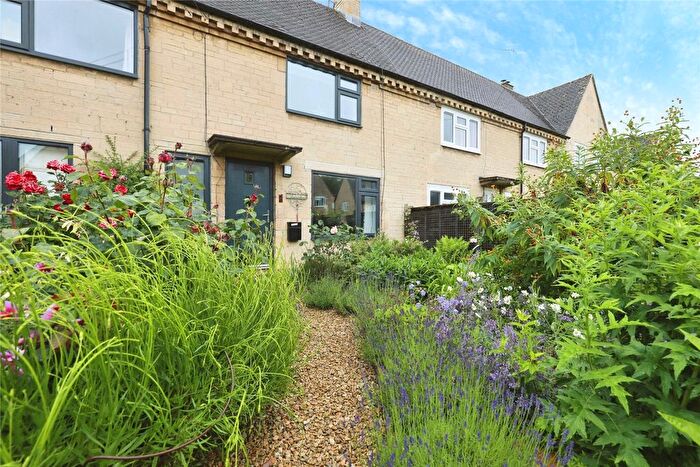
![]()
If you are looking to sell your house, let it out, or receive a property valuation, an expert can help you.
Click the button below to get started.
Roads and Postcodes in Fosseridge
Navigate through our locations to find the location of your next house in Fosseridge, Cheltenham for sale or to rent.
| Streets | Postcodes |
|---|---|
| Church Road | GL54 1JL |
| Icomb Road | OX7 6XJ |
| Oddington Road | GL54 1JJ |
| Old Forge Close | OX7 6FE |
| Old Hinchwick | GL54 1EU GL54 1EX |
| GL54 1EP GL54 1ES GL54 1ET GL54 1HZ GL54 1JG GL54 1JQ OX7 6SG OX7 6SJ OX7 6SN OX7 6SR OX7 6SS |
Property price trends in Fosseridge
According to the latest Land Registry data, the average home in Fosseridge sold for £1,925,000 in 2025. That figure comes from 78 sales logged over the past 30 years.
Prices have continued to climb over the last three years. Compared with 2021, when the typical sale came in around £797,000, that's a rise of roughly 141.5%.
Looking back five years, average prices are up about 121.1% since 2020, a gain of around £1,054,417 in cash terms.
Zoom out to the past decade for the fuller picture. Back in 2015, homes here averaged £296,666, so the typical sold price has climbed about 548.9% since then, roughly 20.6% a year. Stretch the view to fifteen years and that annual pace eases back to about 7.1%.
Frequently asked questions about Fosseridge
What is the average price for a property for sale in Fosseridge?
The average price for a property for sale in Fosseridge is £1,058,571. This amount is 150% higher than the average price in Cheltenham. There are 1,503 property listings for sale in Fosseridge.
Which train stations are available in or near Fosseridge?
Some of the train stations available in or near Fosseridge are Kingham, Moreton-In-Marsh and Shipton.
Property Price Paid in Fosseridge by Year
The average sold property price by year was:
| Year | Average Sold Price | Price Change |
Sold Properties
|
|---|---|---|---|
| 2025 | £1,925,000 | 63% |
2 Properties |
| 2024 | £712,000 | -12% |
5 Properties |
| 2021 | £797,000 | -9% |
5 Properties |
| 2020 | £870,583 | -25% |
6 Properties |
| 2019 | £1,092,500 | 23% |
2 Properties |
| 2018 | £836,666 | 43% |
3 Properties |
| 2017 | £474,000 | -12% |
1 Property |
| 2016 | £533,000 | 44% |
5 Properties |
| 2015 | £296,666 | -106% |
3 Properties |
| 2014 | £612,500 | -82% |
3 Properties |
Property Price per Property Type in Fosseridge
Here you can find historic sold price data in order to help with your property search.
The average Property Paid Price for specific property types in the last three years are:
| Property Type | Average Sold Price | Sold Properties |
|---|---|---|
| Semi Detached House | £760,000.00 | 1 Semi Detached House |
| Detached House | £1,108,333.00 | 6 Detached Houses |
