
Houses for sale & to rent in Oakley, Cheltenham
House Prices in Oakley
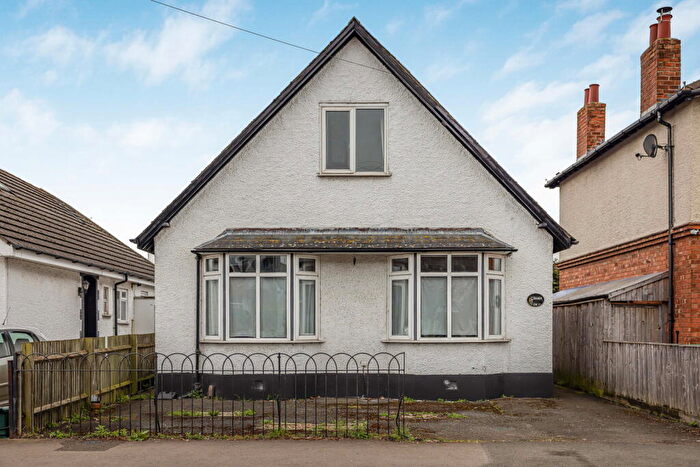
Properties in Oakley have an average house price of £294k and had 178 Property Transactions within the last 3 years¹.
Oakley is an area in Cheltenham, Gloucestershire with 2,428 households², where the most expensive property was sold for £885k.
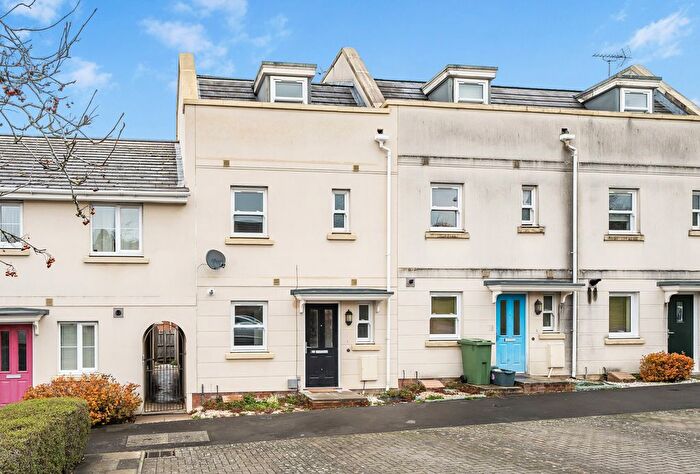
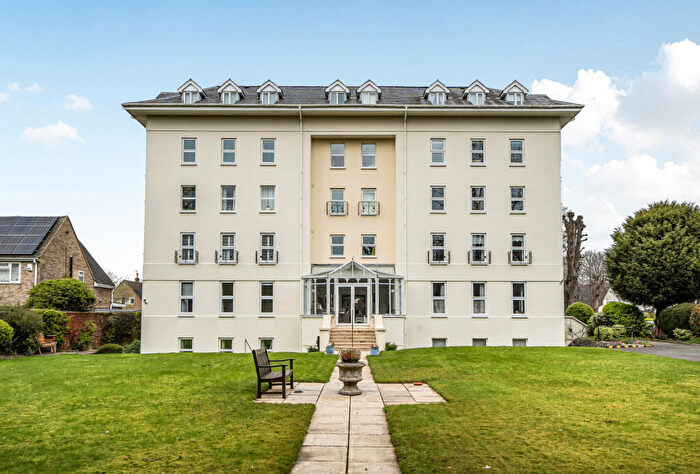
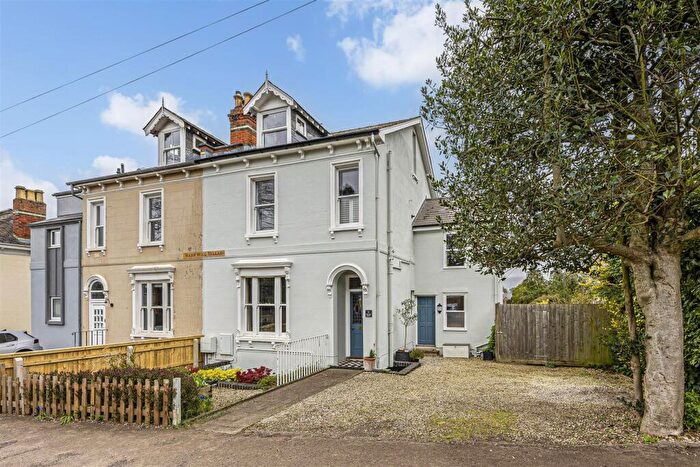
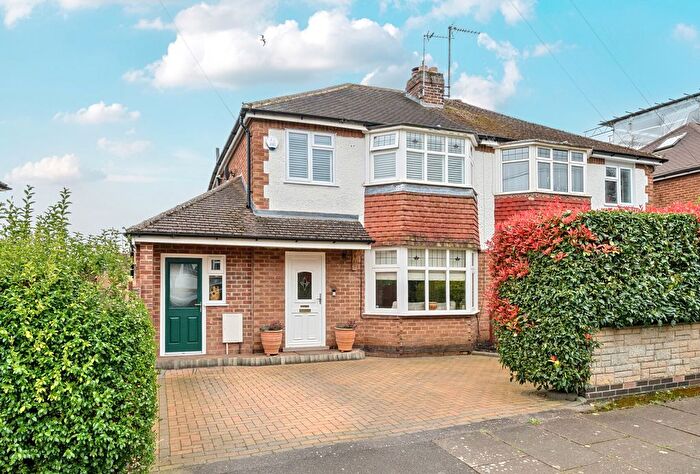
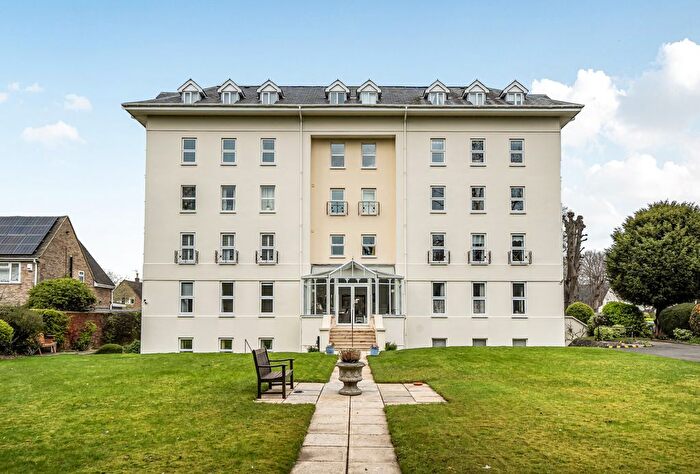
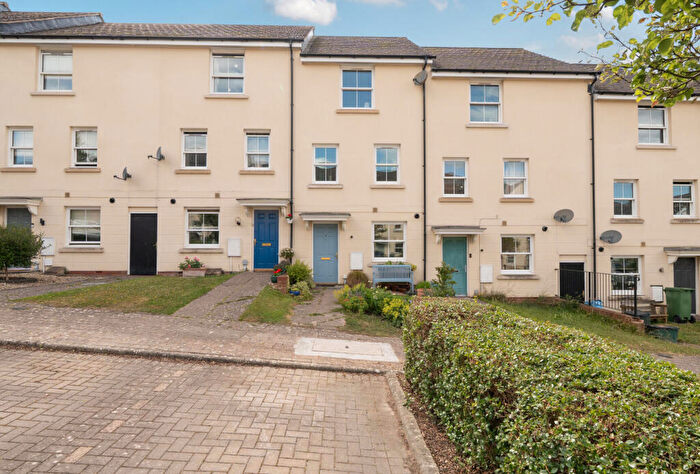
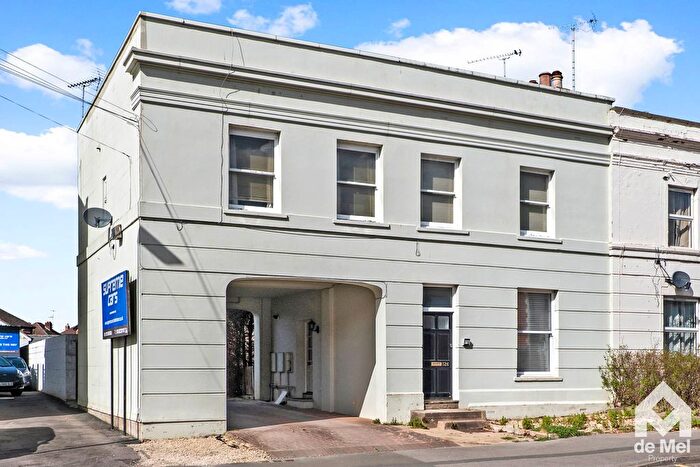
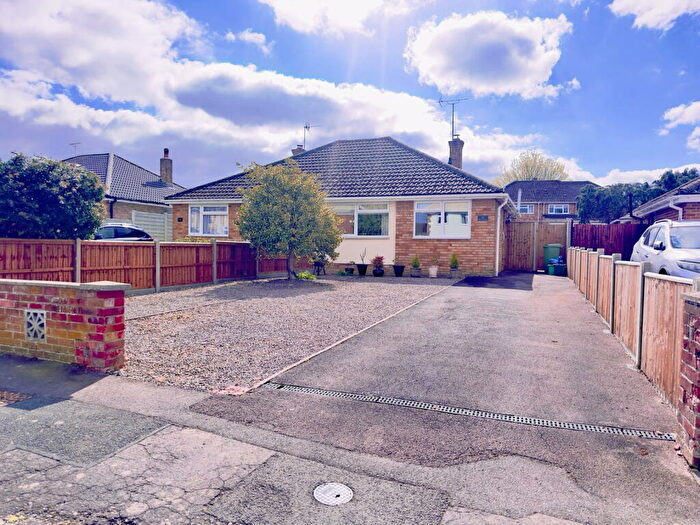
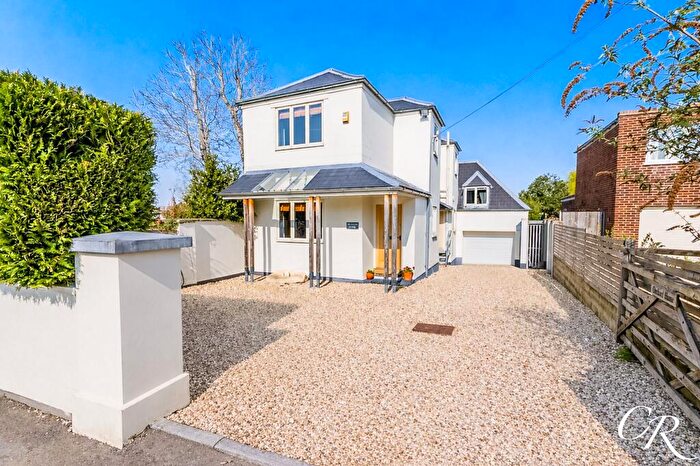
Properties for sale in Oakley
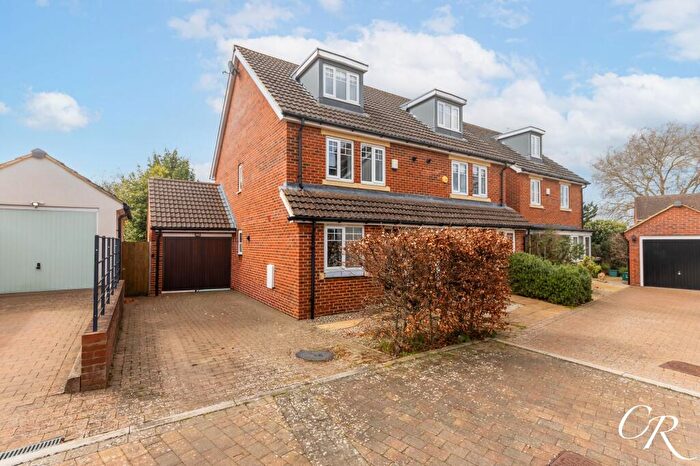
![]()
If you are looking to sell your house, let it out, or receive a property valuation, an expert can help you.
Click the button below to get started.

Roads and Postcodes in Oakley
Navigate through our locations to find the location of your next house in Oakley, Cheltenham for sale or to rent.
Transport near Oakley

- FAQ
- Price Paid By Year
- Property Type Price
Frequently asked questions about Oakley
What is the average price for a property for sale in Oakley?
The average price for a property for sale in Oakley is £293,947. This amount is 31% lower than the average price in Cheltenham. There are 1,497 property listings for sale in Oakley.
What streets have the most expensive properties for sale in Oakley?
The streets with the most expensive properties for sale in Oakley are Prestbury Road at an average of £530,227, Bouncers Lane at an average of £527,250 and Hewlett Road at an average of £489,800.
What streets have the most affordable properties for sale in Oakley?
The streets with the most affordable properties for sale in Oakley are Westbourne Drive at an average of £105,000, Wymans Road at an average of £180,000 and Isbourne Road at an average of £192,500.
Which train stations are available in or near Oakley?
Some of the train stations available in or near Oakley are Cheltenham Spa, Ashchurch and Gloucester.
Property Price Paid in Oakley by Year
The average sold property price by year was:
| Year | Average Sold Price | Price Change |
Sold Properties
|
|---|---|---|---|
| 2026 | £95,000 | -240% |
1 Property |
| 2025 | £323,360 | 16% |
65 Properties |
| 2024 | £272,258 | -4% |
50 Properties |
| 2023 | £283,811 | 1% |
62 Properties |
| 2022 | £281,239 | 6% |
67 Properties |
| 2021 | £263,963 | 2% |
93 Properties |
| 2020 | £259,177 | 18% |
80 Properties |
| 2019 | £213,046 | -6% |
75 Properties |
| 2018 | £224,995 | 4% |
94 Properties |
| 2017 | £215,743 | 5% |
81 Properties |
| 2016 | £204,901 | 10% |
84 Properties |
| 2015 | £183,766 | 6% |
81 Properties |
| 2014 | £173,053 | -6% |
84 Properties |
| 2013 | £183,358 | 12% |
78 Properties |
| 2012 | £160,723 | 11% |
63 Properties |
| 2011 | £142,793 | -8% |
73 Properties |
| 2010 | £153,842 | 2% |
59 Properties |
| 2009 | £150,186 | -17% |
46 Properties |
| 2008 | £176,231 | 12% |
57 Properties |
| 2007 | £155,698 | - |
91 Properties |
| 2006 | £155,707 | 13% |
112 Properties |
| 2005 | £136,115 | 3% |
82 Properties |
| 2004 | £132,583 | 18% |
99 Properties |
| 2003 | £108,448 | -1% |
98 Properties |
| 2002 | £109,275 | 29% |
79 Properties |
| 2001 | £77,318 | -12% |
99 Properties |
| 2000 | £86,887 | 24% |
74 Properties |
| 1999 | £65,630 | 13% |
115 Properties |
| 1998 | £56,832 | 6% |
76 Properties |
| 1997 | £53,494 | -0,2% |
85 Properties |
| 1996 | £53,577 | 19% |
56 Properties |
| 1995 | £43,389 | - |
47 Properties |
Property Price per Property Type in Oakley
Here you can find historic sold price data in order to help with your property search.
The average Property Paid Price for specific property types in the last three years are:
| Property Type | Average Sold Price | Sold Properties |
|---|---|---|
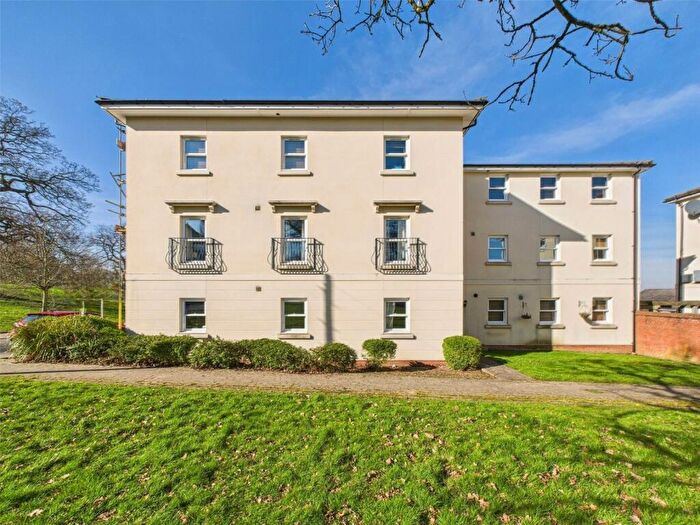
| Flat | £184,147.00 | 38 Flats |
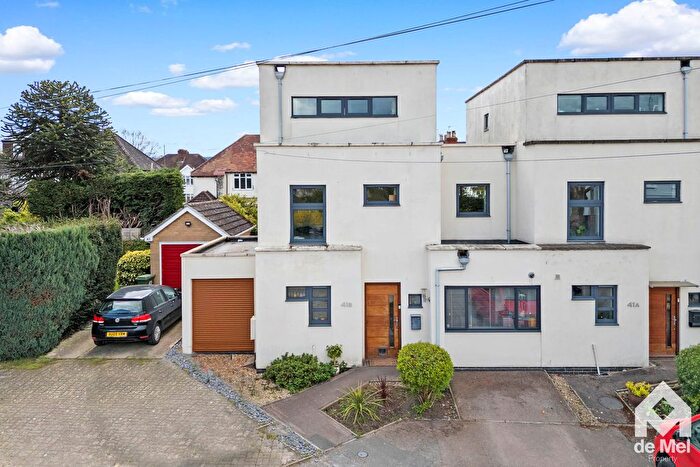
| Semi Detached House | £329,748.00 | 81 Semi Detached Houses |
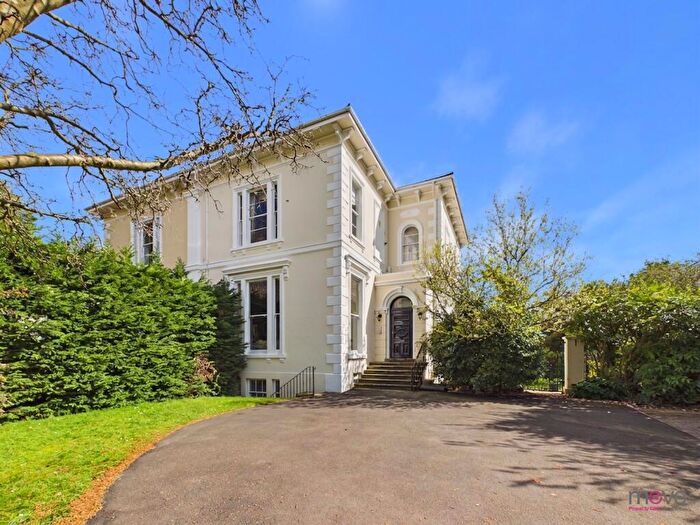
| Detached House | £483,131.00 | 11 Detached Houses |
| Terraced House | £277,102.00 | 48 Terraced Houses |