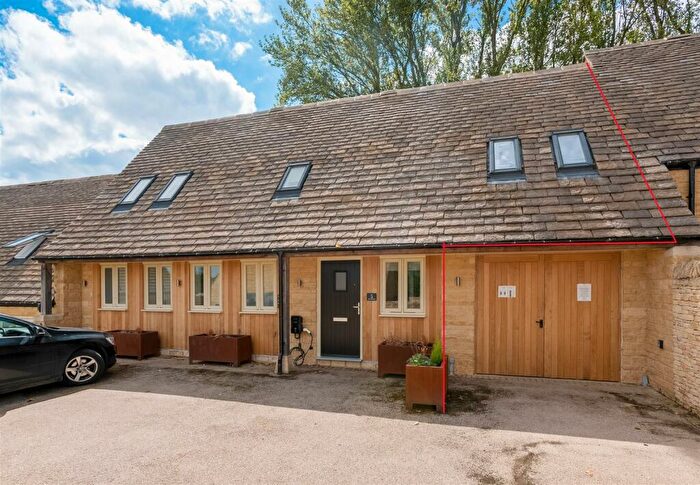
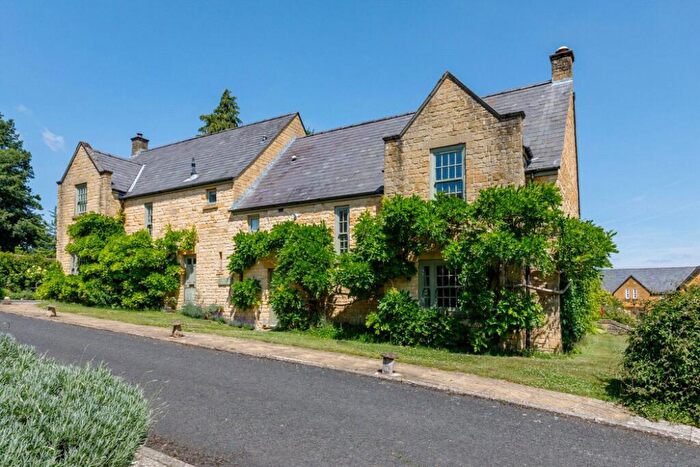
Houses for sale & to rent in Blockley, Chipping Campden
House Prices in Blockley
Properties in Blockley have an average house price of £730,357.00 and had 7 Property Transactions within the last 3 years¹.
Blockley is an area in Chipping Campden, Gloucestershire with 118 households², where the most expensive property was sold for £1,050,000.00.
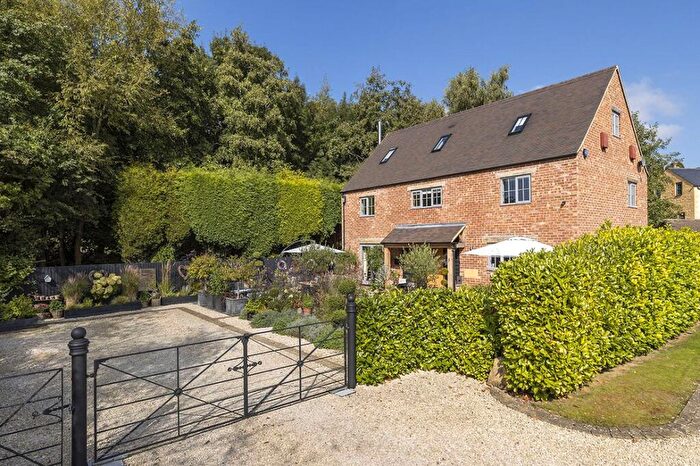
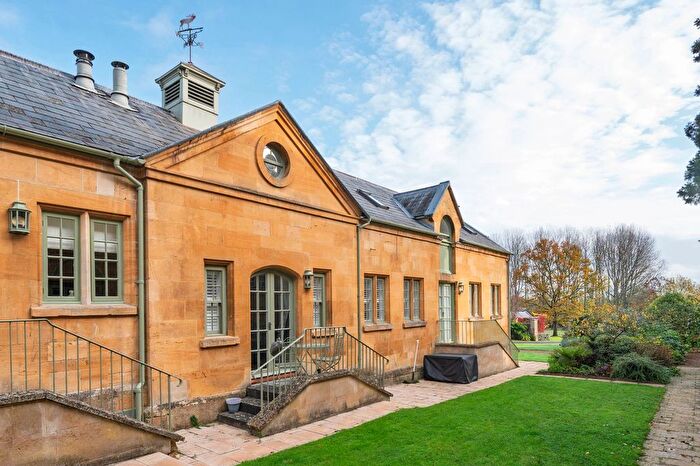
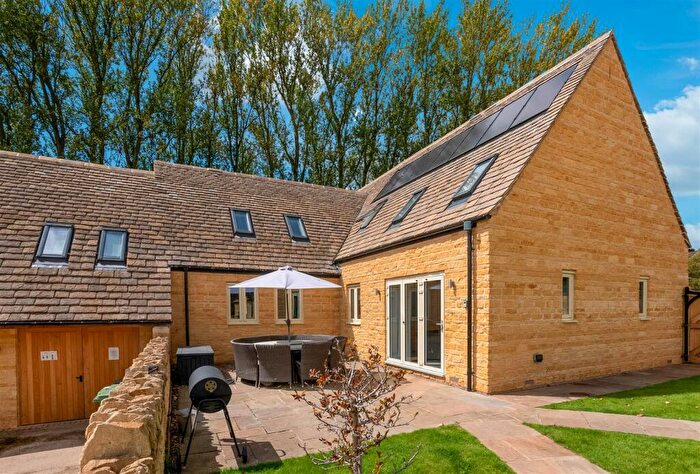
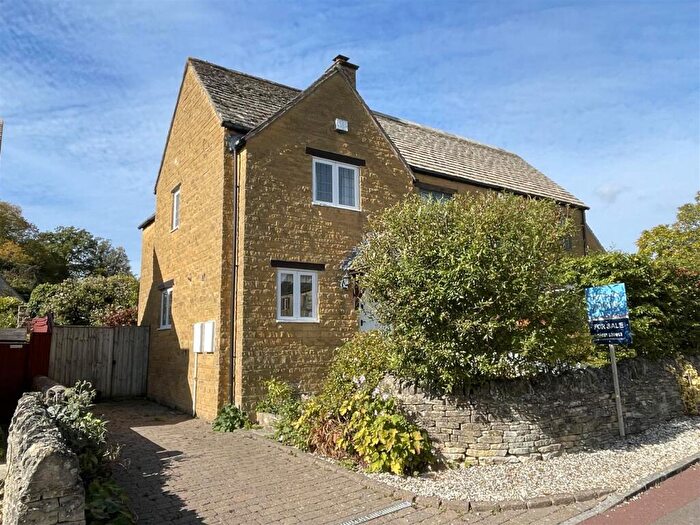
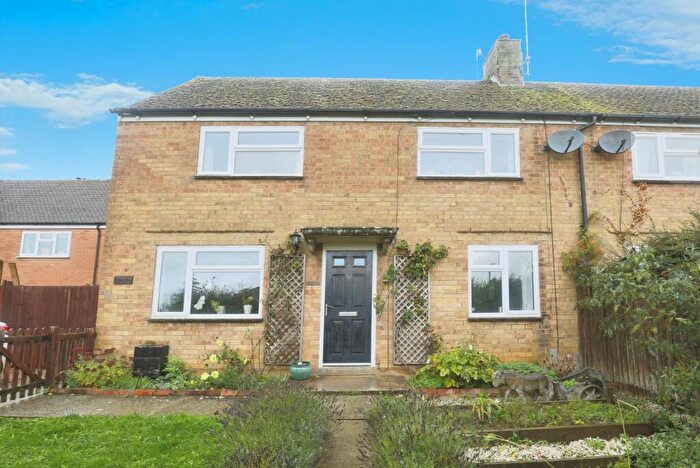
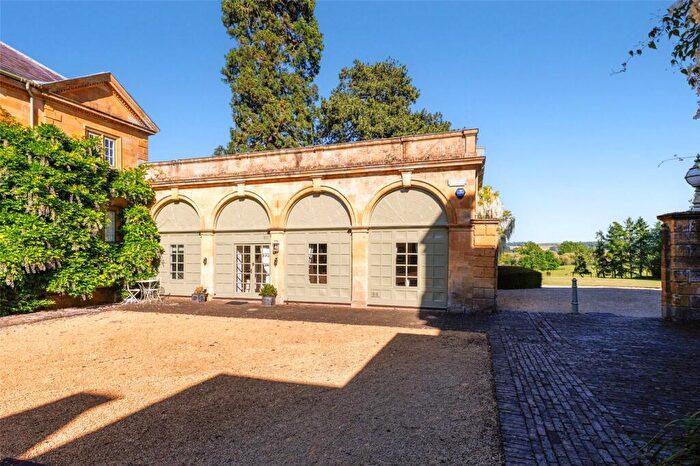
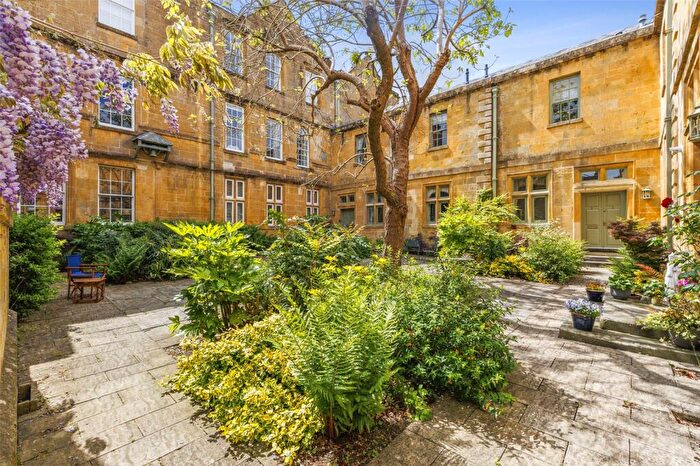
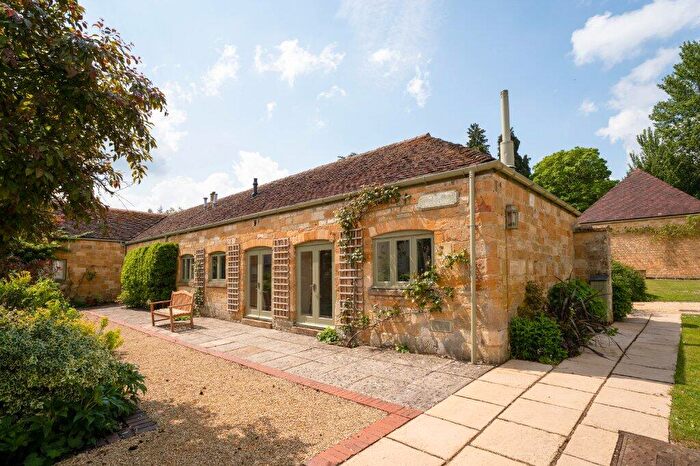
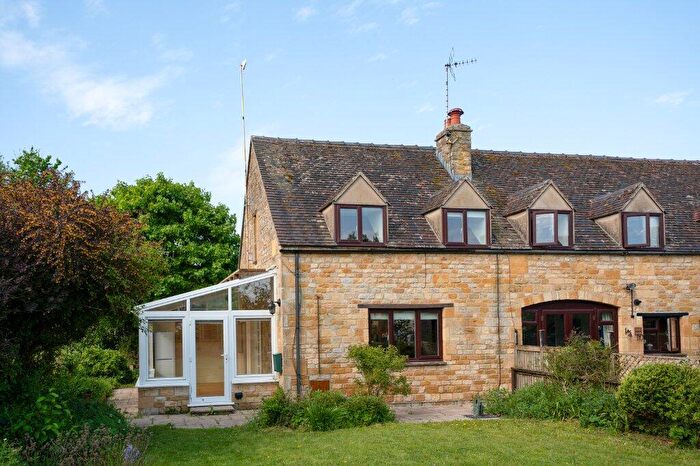
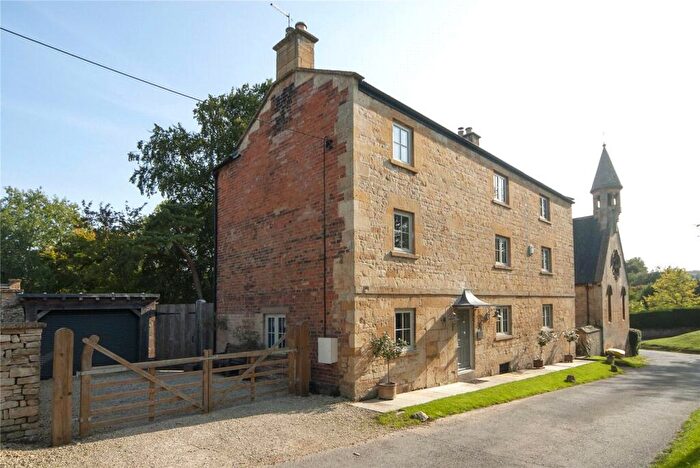
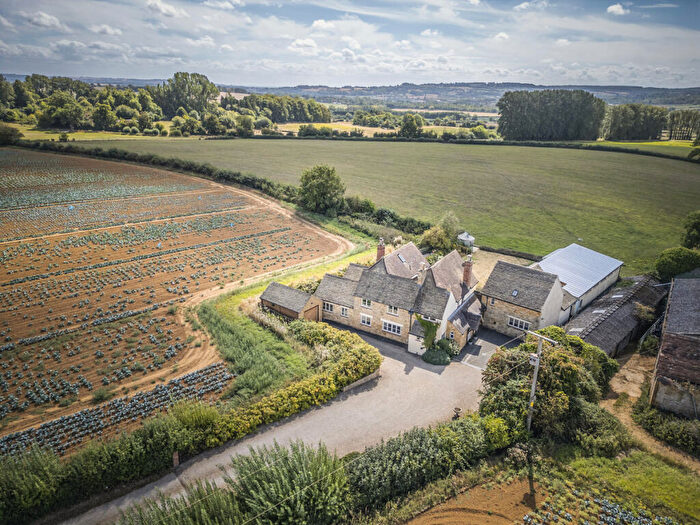
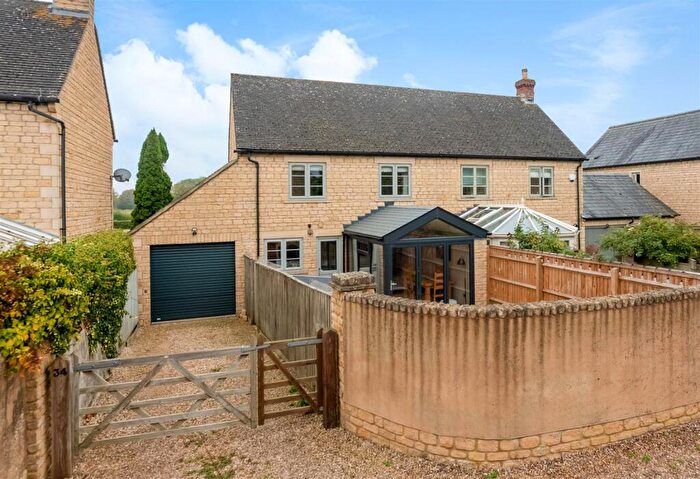
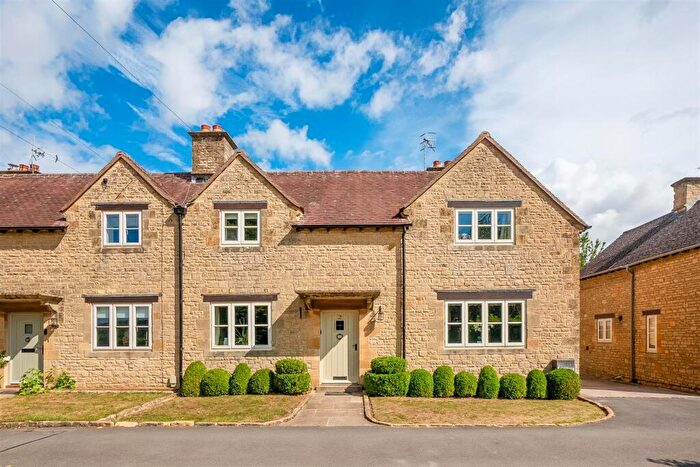
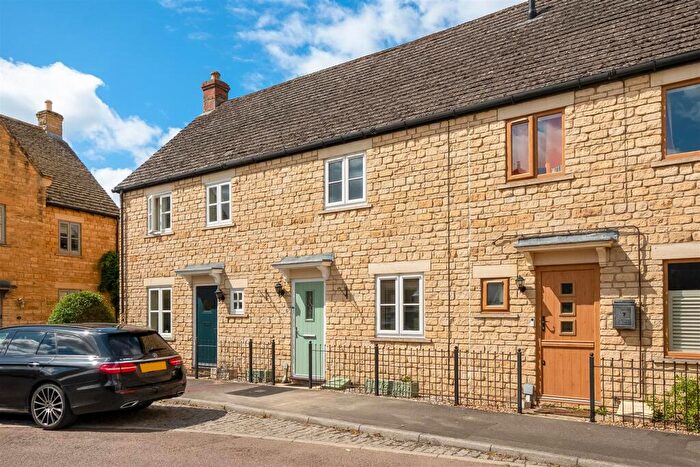
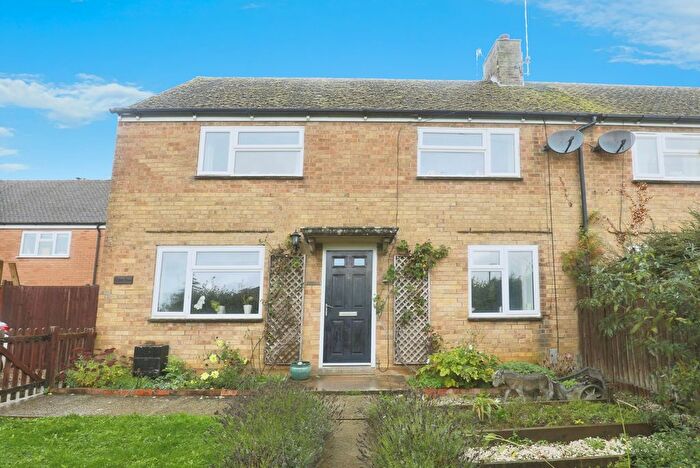
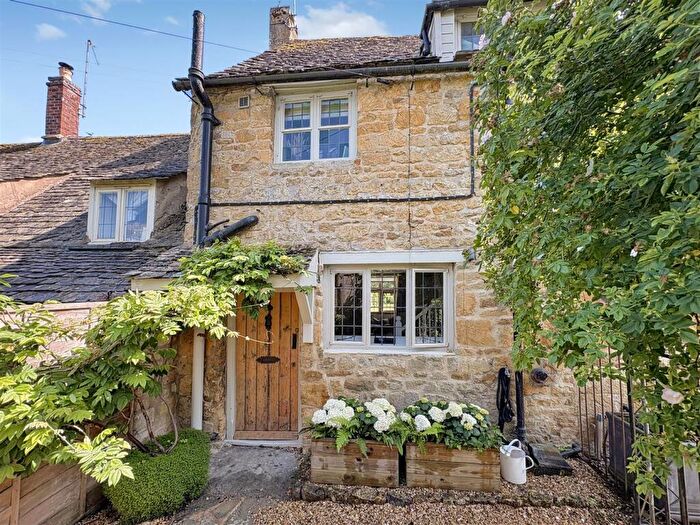
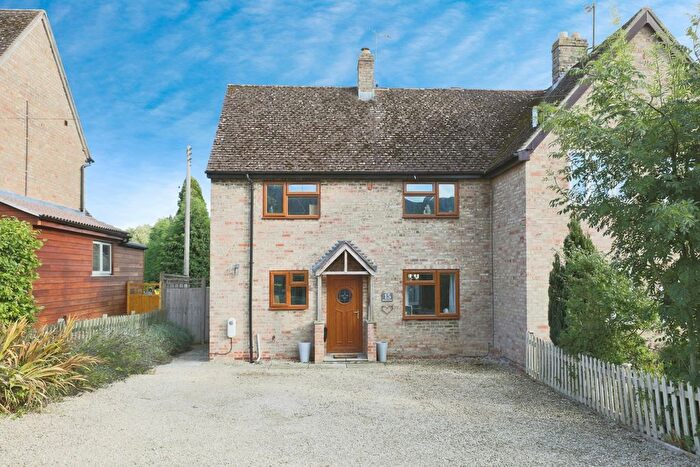
Properties for sale in Blockley
Previously listed properties in Blockley
Roads and Postcodes in Blockley
Navigate through our locations to find the location of your next house in Blockley, Chipping Campden for sale or to rent.
| Streets | Postcodes |
|---|---|
| Bran Mill Lane | GL55 6XJ GL55 6XN |
| Brookside | GL55 6XE |
| Campden Road | GL55 6NF |
| Church Close | GL55 6NE |
| Clay Lane | GL55 6XT GL55 6FD |
| Lower Folley | GL55 6XF |
| May Lane | GL55 6FB |
| Old Manor Cottages | GL55 6XL |
| Saxon Fields | GL55 6EY |
| Station Road | GL55 6LD |
| The Old Farmyard | GL55 6WZ |
| GL55 6XD GL55 6XH GL55 6XP GL55 6XR GL55 6XS GL55 6XW GL55 6LP GL55 6LR GL55 6LS GL55 6LU GL55 6LY GL55 6NG GL55 6NS GL55 6NX GL55 6XG GL55 6XQ GL55 6XZ |
Transport near Blockley
- FAQ
- Price Paid By Year
- Property Type Price
Frequently asked questions about Blockley
What is the average price for a property for sale in Blockley?
The average price for a property for sale in Blockley is £730,357. This amount is 12% higher than the average price in Chipping Campden. There are 151 property listings for sale in Blockley.
What streets have the most expensive properties for sale in Blockley?
The street with the most expensive properties for sale in Blockley is The Old Farmyard at an average of £630,000.
What streets have the most affordable properties for sale in Blockley?
The street with the most affordable properties for sale in Blockley is Old Manor Cottages at an average of £495,000.
Which train stations are available in or near Blockley?
Some of the train stations available in or near Blockley are Moreton-In-Marsh, Honeybourne and Evesham.
Property Price Paid in Blockley by Year
The average sold property price by year was:
| Year | Average Sold Price | Price Change |
Sold Properties
|
|---|---|---|---|
| 2025 | £838,750 | 8% |
2 Properties |
| 2024 | £772,500 | 18% |
2 Properties |
| 2023 | £630,000 | -7% |
3 Properties |
| 2022 | £671,666 | 11% |
3 Properties |
| 2021 | £597,571 | -72% |
7 Properties |
| 2020 | £1,030,555 | 60% |
9 Properties |
| 2019 | £414,833 | -19% |
6 Properties |
| 2018 | £493,888 | -39% |
9 Properties |
| 2017 | £687,600 | 19% |
5 Properties |
| 2016 | £556,437 | 24% |
4 Properties |
| 2015 | £423,683 | -58% |
10 Properties |
| 2014 | £667,500 | 52% |
2 Properties |
| 2013 | £321,250 | -106% |
2 Properties |
| 2012 | £661,510 | 31% |
1 Property |
| 2011 | £453,900 | 28% |
5 Properties |
| 2010 | £326,750 | -72% |
4 Properties |
| 2009 | £562,500 | 11% |
2 Properties |
| 2008 | £500,000 | 59% |
1 Property |
| 2007 | £203,987 | -63% |
4 Properties |
| 2006 | £333,500 | 9% |
6 Properties |
| 2005 | £302,333 | -55% |
3 Properties |
| 2004 | £469,983 | 30% |
3 Properties |
| 2003 | £331,200 | 20% |
9 Properties |
| 2002 | £263,980 | 13% |
5 Properties |
| 2000 | £229,000 | 30% |
1 Property |
| 1999 | £161,400 | 3% |
5 Properties |
| 1998 | £156,240 | 5% |
5 Properties |
| 1997 | £147,900 | 6% |
5 Properties |
| 1996 | £139,428 | 23% |
7 Properties |
| 1995 | £107,800 | - |
5 Properties |
Property Price per Property Type in Blockley
Here you can find historic sold price data in order to help with your property search.
The average Property Paid Price for specific property types in the last three years are:
| Property Type | Average Sold Price | Sold Properties |
|---|---|---|
| Semi Detached House | £585,000.00 | 2 Semi Detached Houses |
| Detached House | £861,875.00 | 4 Detached Houses |
| Terraced House | £495,000.00 | 1 Terraced House |

