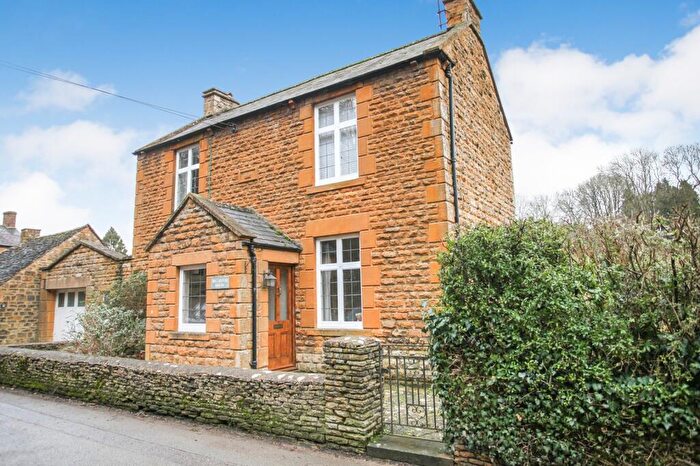
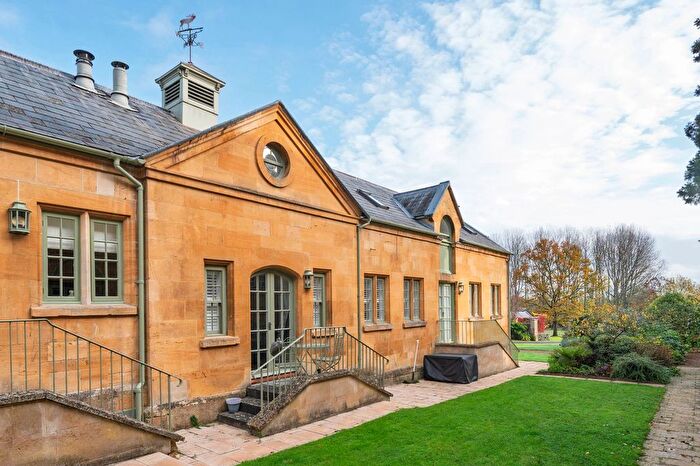
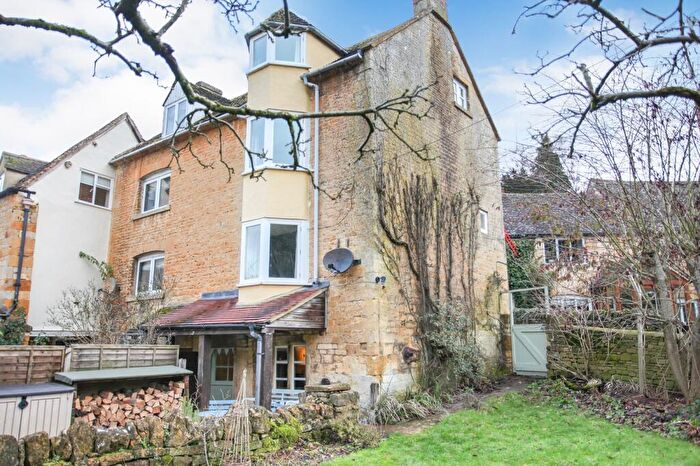
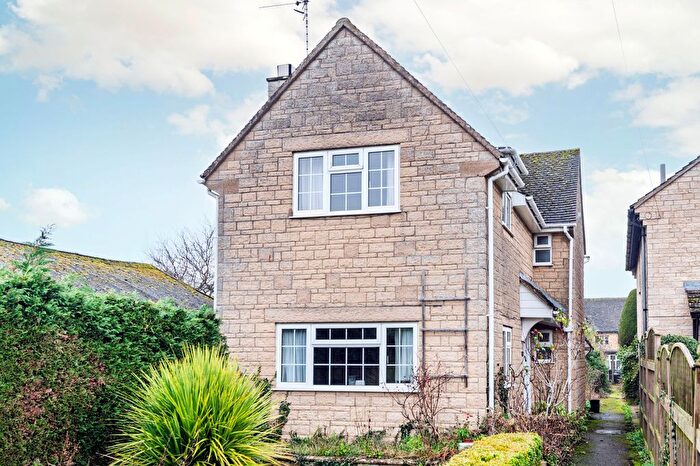
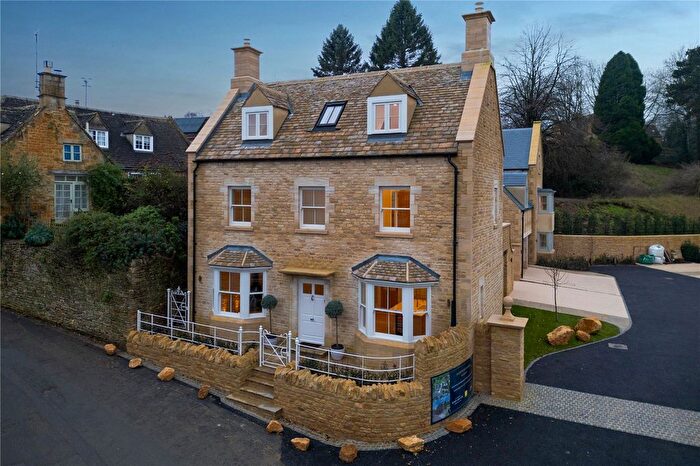
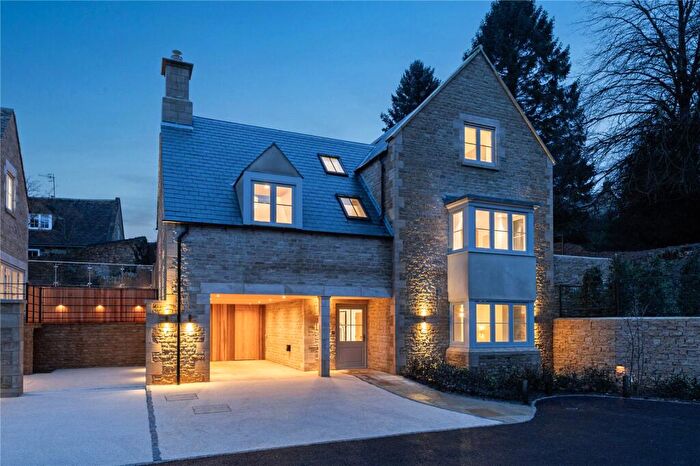
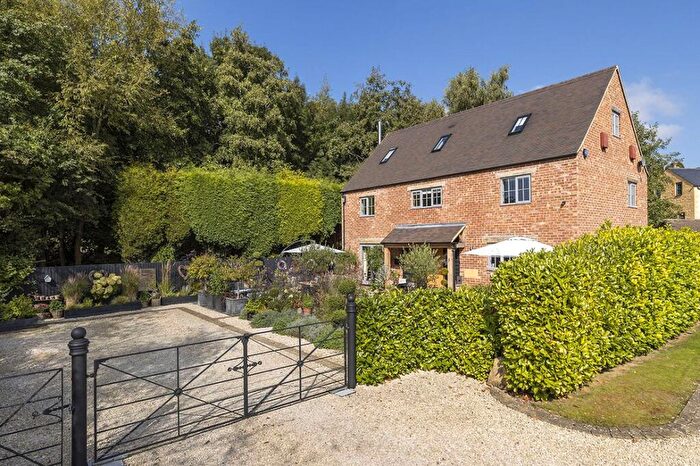
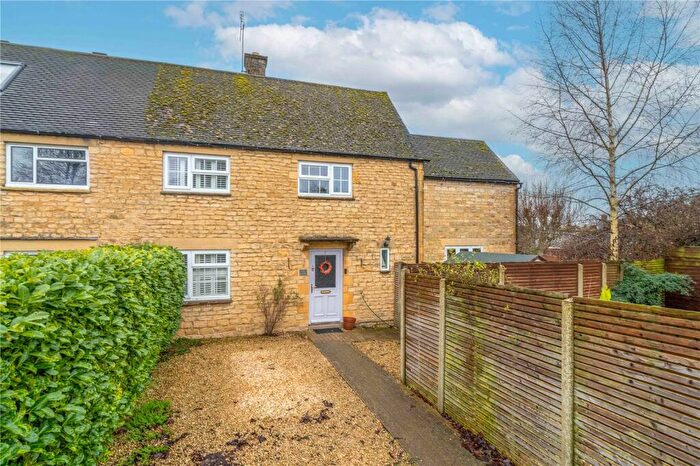
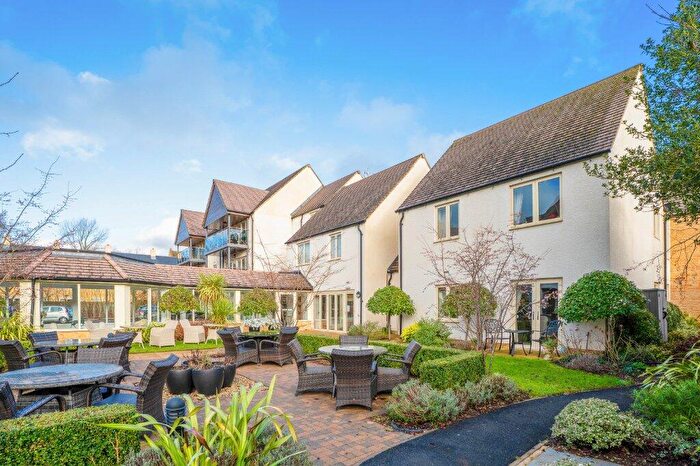
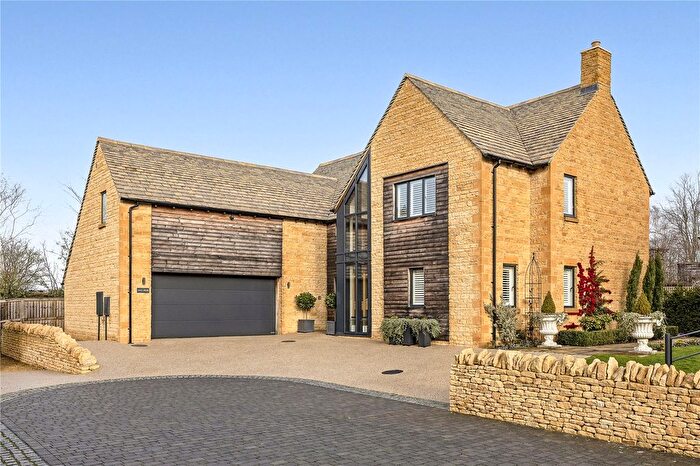
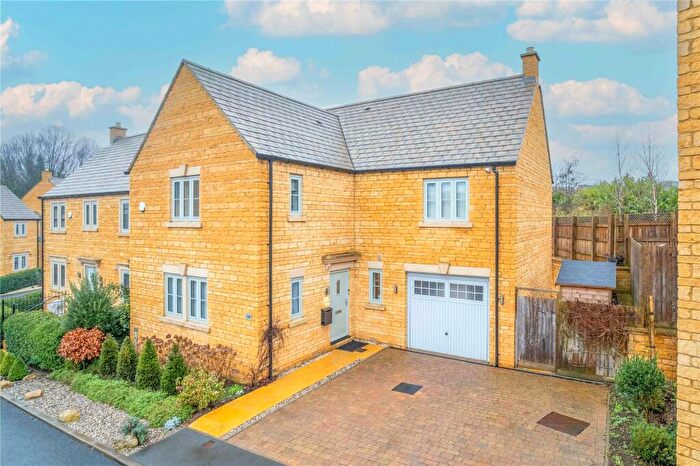
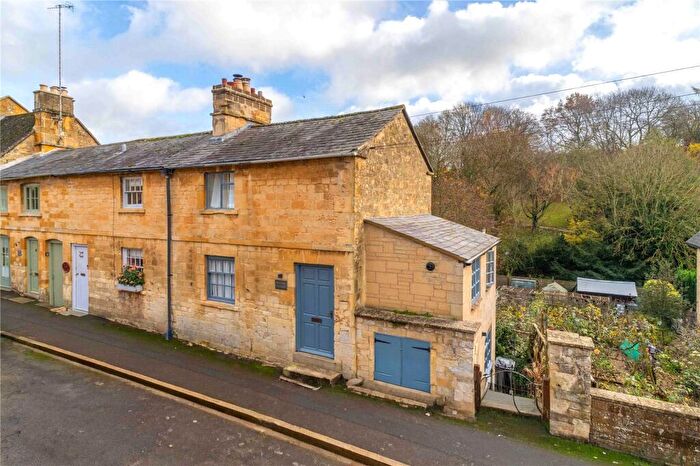
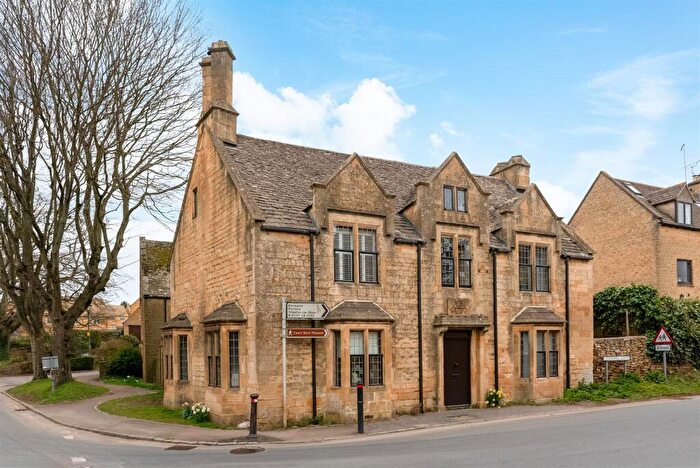
Houses for sale & to rent in Blockley, Moreton-in-marsh
House Prices in Blockley
Properties in Blockley have an average house price of £604,598.00 and had 108 Property Transactions within the last 3 years¹.
Blockley is an area in Moreton-in-marsh, Gloucestershire with 812 households², where the most expensive property was sold for £2,700,000.00.
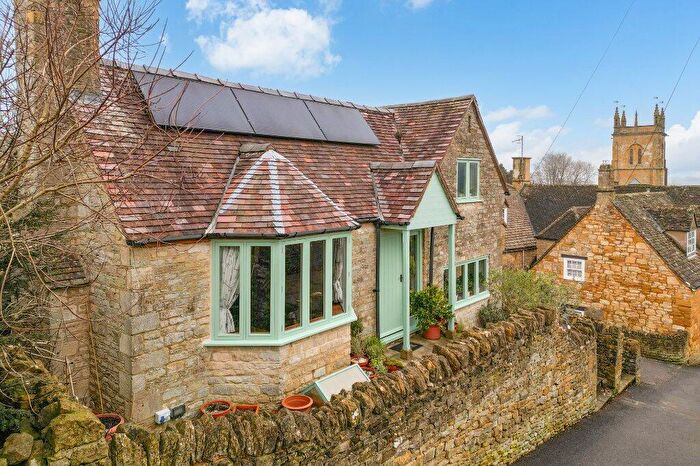
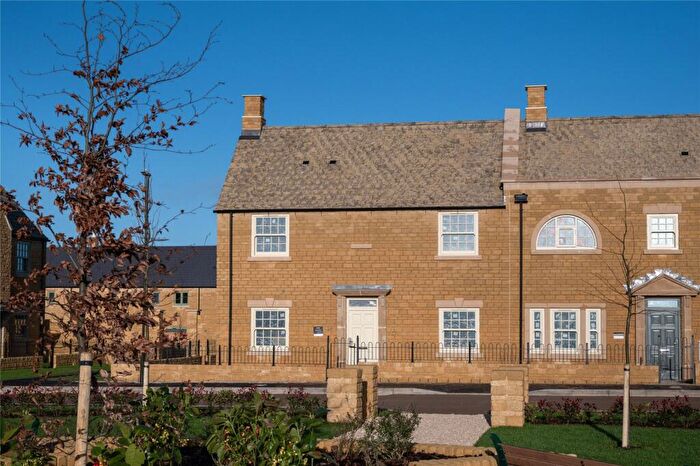
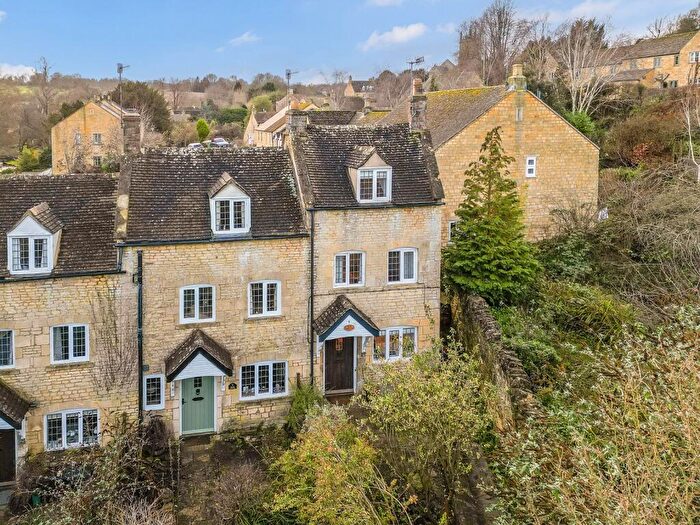
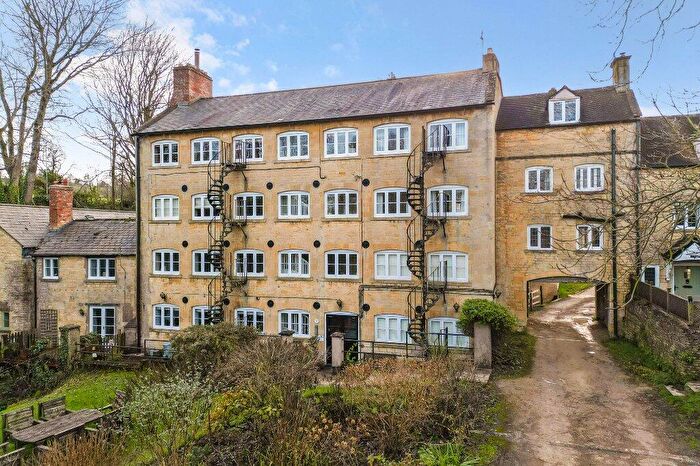
Properties for sale in Blockley
Roads and Postcodes in Blockley
Navigate through our locations to find the location of your next house in Blockley, Moreton-in-marsh for sale or to rent.
| Streets | Postcodes |
|---|---|
| Barn Ground Close | GL56 9AY |
| Bell Lane | GL56 9BB |
| Blockley Court | GL56 9BP GL56 9BS |
| Brook Lane | GL56 9HR |
| Chapel Lane | GL56 9BE GL56 9BG |
| Church Farm Lane | GL56 9RG |
| Churchill Square | GL56 9RR |
| Court Cottages | GL56 9BT |
| Days Lane | GL56 9HG |
| Ditchford Hill | GL56 9QS |
| Dovedale | GL56 9HN |
| Dovedale End | GL56 9HQ |
| Draycott Industrial Estate | GL56 9JY |
| Draycott Road | GL56 9DD |
| Gable Mews | GL56 9DY |
| Greenway Road | GL56 9BJ GL56 9BQ |
| High Street | GL56 9ES GL56 9ET GL56 9EU GL56 9EX GL56 9EY GL56 9HA GL56 9HB GL56 9HD GL56 9HF GL56 9HH GL56 9HJ GL56 9HE GL56 9HW |
| John Woolf Court | GL56 9RS |
| Julianas Court | GL56 9RP |
| Lower Terrace | GL56 9DS |
| Meadow View | GL56 9EH |
| Mill Close | GL56 9DN |
| Mill Lane | GL56 9HT |
| Mill Row | GL56 9JS |
| Millview | GL56 9AZ |
| Mop Hale | GL56 9EQ |
| Mount Pleasant | GL56 9BU |
| Neighbrook | GL56 9QP |
| Northcot Lane | GL56 9LR |
| Northwick Business Centre | GL56 9RF |
| Northwick Park | GL56 9LL GL56 9RJ |
| Northwick Terrace | GL56 9BL |
| Orchard Bank | GL56 9EZ |
| Orchard View | GL56 9LW |
| Park Road | GL56 9BZ GL56 9BY |
| Pasture Lane | GL56 9DR GL56 9HY |
| Paxford Road | GL56 9QL |
| Post Office Lane | GL56 9JZ |
| School Lane | GL56 9HU |
| Snugborough Lane | GL56 9DU |
| Springfield | GL56 9EE |
| Springhill | GL56 9TG |
| St Georges Terrace | GL56 9BN |
| Station Road | GL56 9DT GL56 9DZ GL56 9ED GL56 9DX GL56 9EA GL56 9EB GL56 9JR GL56 9LH |
| Summerfield Close | GL56 9EG |
| The Clementines | GL56 9ER |
| The Dell | GL56 9DB |
| The Landgate | GL56 9BX |
| Upper Terrace | GL56 9BH |
| William Emes Garden | GL56 9RL |
| Winterway | GL56 9EF |
| Woolaway Bungalows | GL56 9QJ |
| Wydelands | GL56 9LA |
| GL56 9BA GL56 9BD GL56 9BW GL56 9DP GL56 9DW GL56 9HL GL56 9HP GL56 9HX GL56 9JT GL56 9LB GL56 9LE GL56 9LF GL56 9LG GL56 9LJ GL56 9LQ GL56 9NU GL56 9QN GL56 9QQ GL56 9QT GL56 9QW GL56 9JU GL56 9QG GL56 9QR GL56 9RH GL56 9TA GL56 9TR GL56 9TS GL56 9AX |
Transport near Blockley
- FAQ
- Price Paid By Year
- Property Type Price
Frequently asked questions about Blockley
What is the average price for a property for sale in Blockley?
The average price for a property for sale in Blockley is £604,598. This amount is 12% higher than the average price in Moreton-in-marsh. There are 604 property listings for sale in Blockley.
What streets have the most expensive properties for sale in Blockley?
The streets with the most expensive properties for sale in Blockley are John Woolf Court at an average of £1,200,000, School Lane at an average of £1,100,000 and Station Road at an average of £1,045,000.
What streets have the most affordable properties for sale in Blockley?
The streets with the most affordable properties for sale in Blockley are Woolaway Bungalows at an average of £197,000, Mount Pleasant at an average of £296,123 and Days Lane at an average of £298,750.
Which train stations are available in or near Blockley?
Some of the train stations available in or near Blockley are Moreton-In-Marsh, Honeybourne and Kingham.
Property Price Paid in Blockley by Year
The average sold property price by year was:
| Year | Average Sold Price | Price Change |
Sold Properties
|
|---|---|---|---|
| 2025 | £541,395 | -29% |
36 Properties |
| 2024 | £699,372 | 19% |
38 Properties |
| 2023 | £565,594 | 4% |
34 Properties |
| 2022 | £542,791 | 3% |
48 Properties |
| 2021 | £528,877 | -8% |
51 Properties |
| 2020 | £569,734 | 21% |
40 Properties |
| 2019 | £450,787 | 11% |
32 Properties |
| 2018 | £402,200 | -15% |
35 Properties |
| 2017 | £463,508 | 16% |
41 Properties |
| 2016 | £389,003 | -16% |
40 Properties |
| 2015 | £451,044 | 19% |
47 Properties |
| 2014 | £363,984 | -6% |
39 Properties |
| 2013 | £387,000 | -9% |
37 Properties |
| 2012 | £421,688 | 20% |
40 Properties |
| 2011 | £338,289 | -29% |
37 Properties |
| 2010 | £436,110 | 21% |
39 Properties |
| 2009 | £345,981 | -5% |
49 Properties |
| 2008 | £364,607 | 8% |
35 Properties |
| 2007 | £334,381 | -11% |
44 Properties |
| 2006 | £371,498 | 10% |
70 Properties |
| 2005 | £335,634 | 13% |
46 Properties |
| 2004 | £293,430 | 2% |
63 Properties |
| 2003 | £287,807 | 22% |
51 Properties |
| 2002 | £225,026 | 4% |
70 Properties |
| 2001 | £215,590 | 17% |
58 Properties |
| 2000 | £178,711 | -9% |
50 Properties |
| 1999 | £194,685 | 20% |
59 Properties |
| 1998 | £154,877 | -1% |
49 Properties |
| 1997 | £156,920 | 28% |
67 Properties |
| 1996 | £112,603 | 10% |
50 Properties |
| 1995 | £101,753 | - |
63 Properties |
Property Price per Property Type in Blockley
Here you can find historic sold price data in order to help with your property search.
The average Property Paid Price for specific property types in the last three years are:
| Property Type | Average Sold Price | Sold Properties |
|---|---|---|
| Semi Detached House | £532,575.00 | 28 Semi Detached Houses |
| Detached House | £959,812.00 | 28 Detached Houses |
| Terraced House | £441,596.00 | 49 Terraced Houses |
| Flat | £623,833.00 | 3 Flats |

