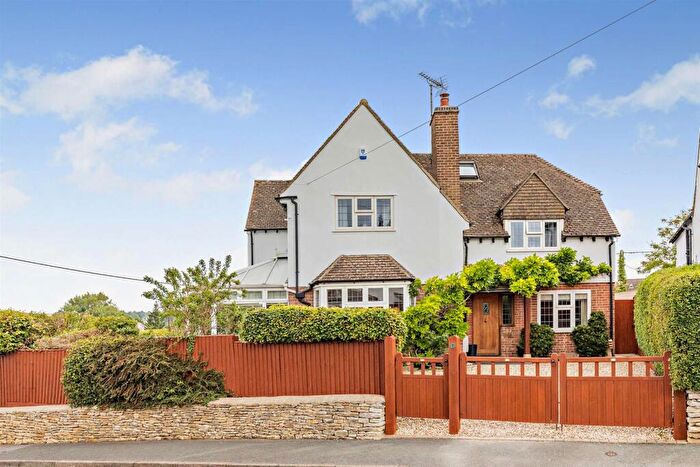
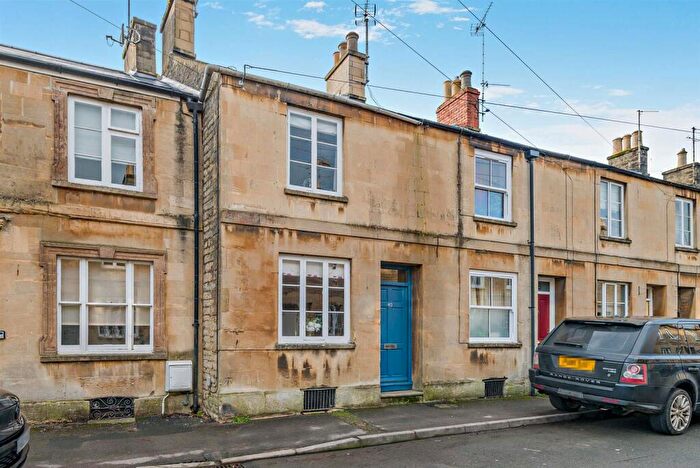
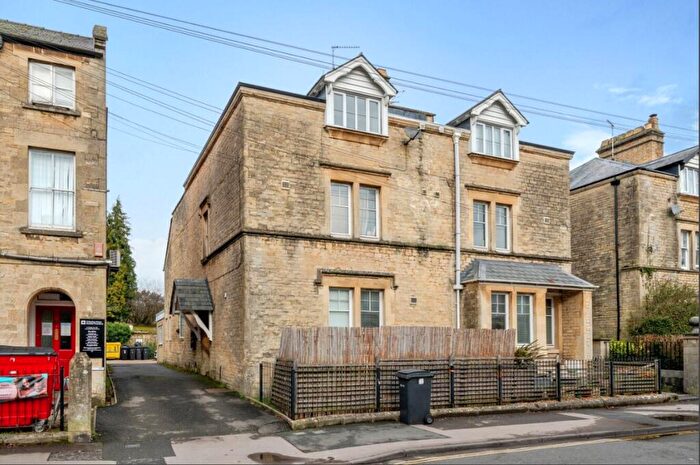
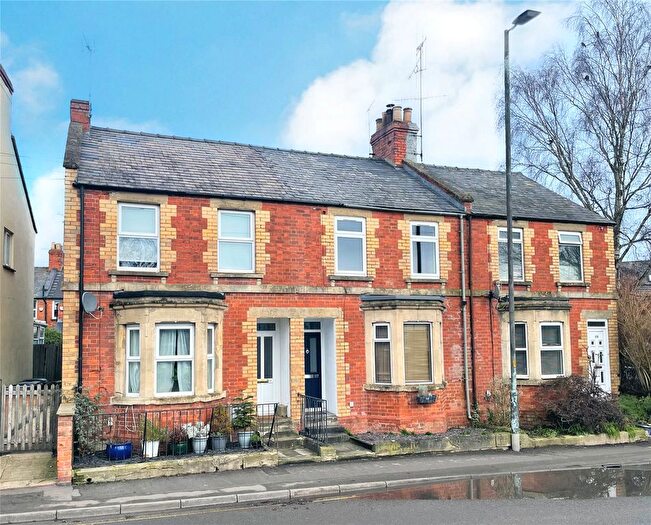
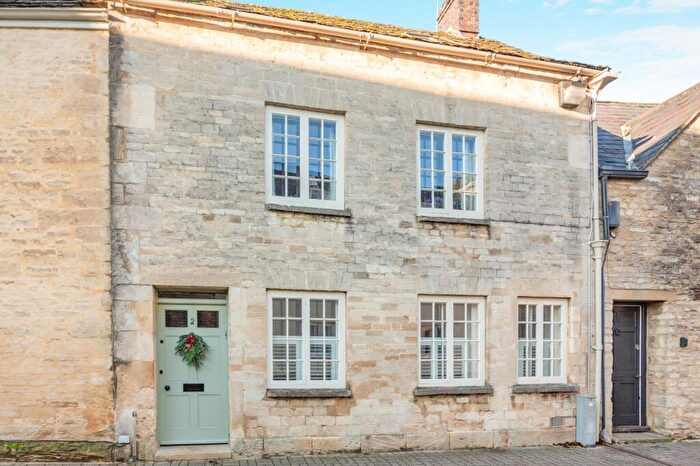
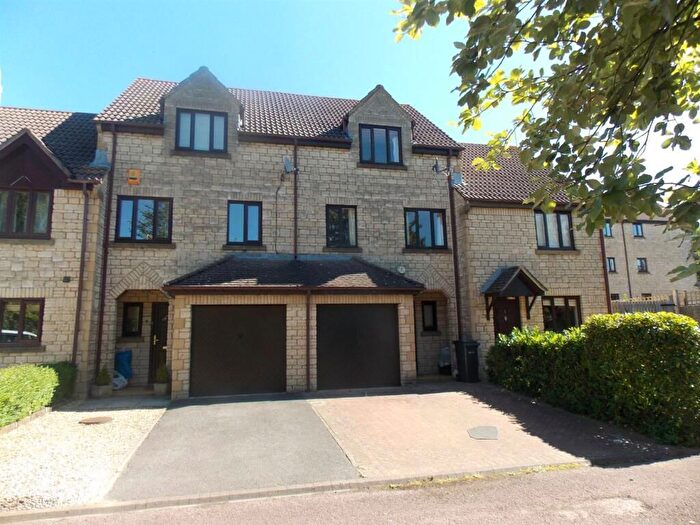
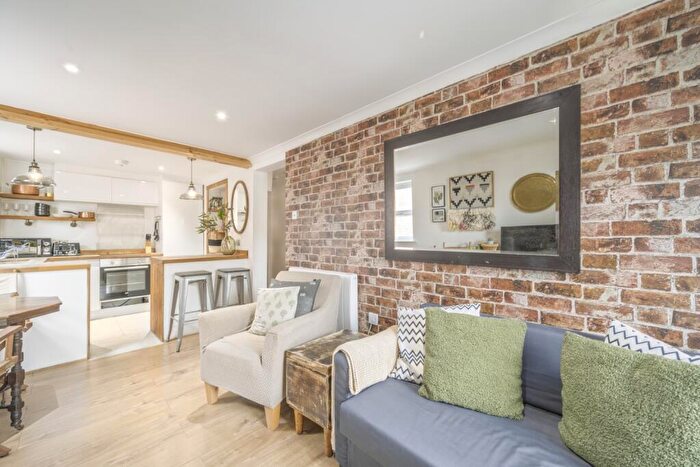
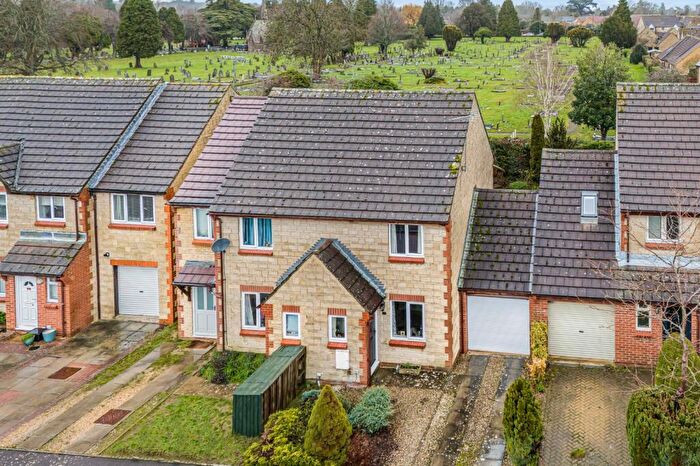
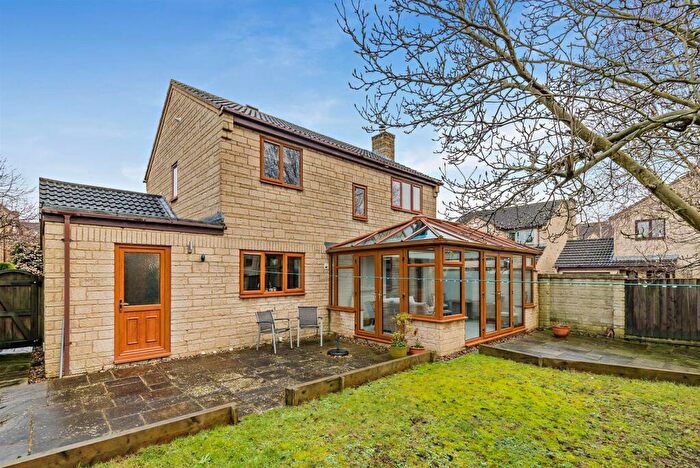
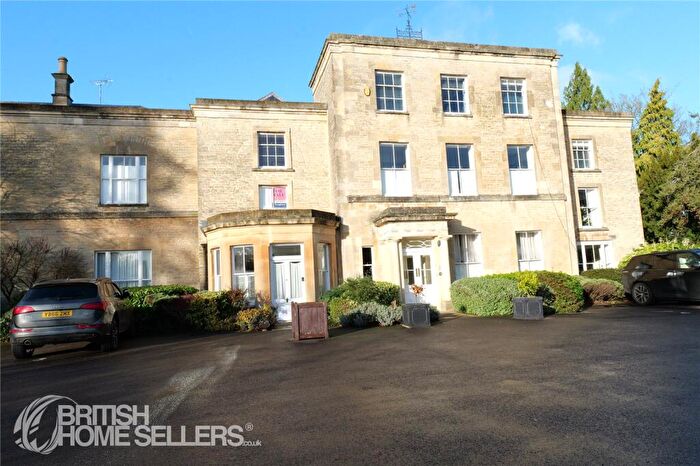
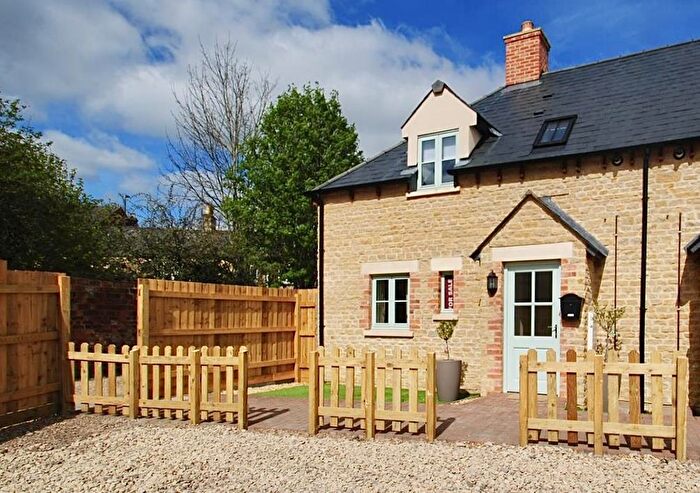
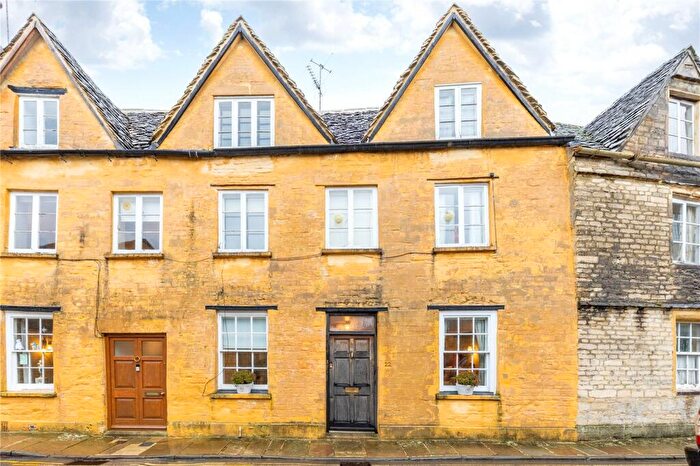
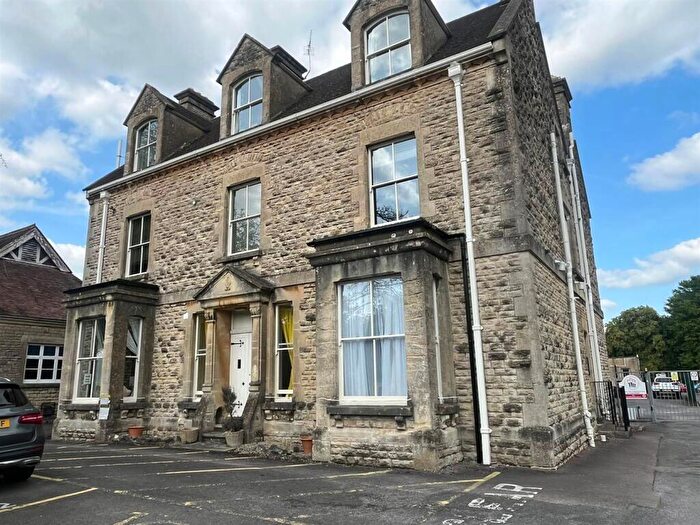
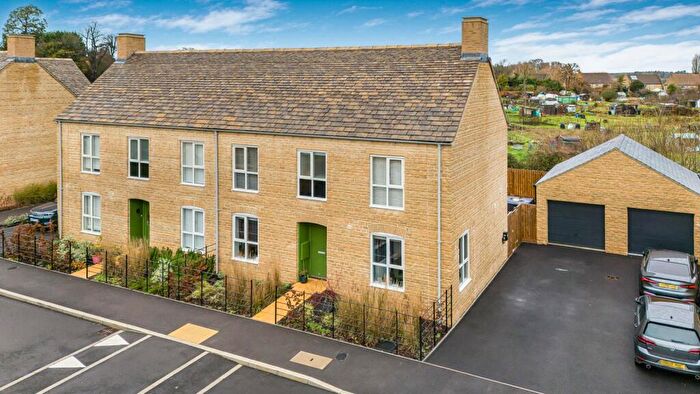
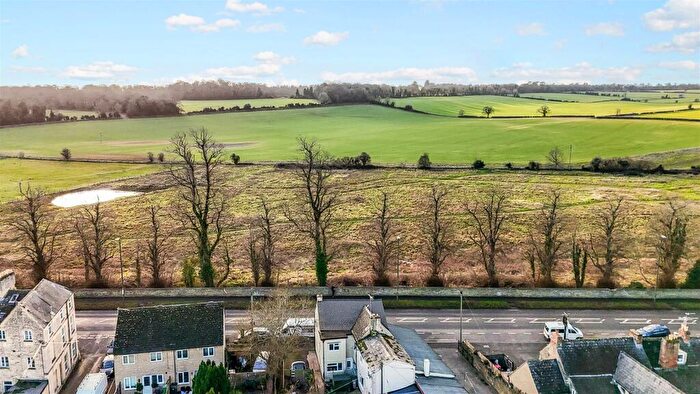
Houses for sale & to rent in Cirencester Park, Cirencester
House Prices in Cirencester Park
Properties in Cirencester Park have an average house price of £359,157.00 and had 173 Property Transactions within the last 3 years¹.
Cirencester Park is an area in Cirencester, Gloucestershire with 1,420 households², where the most expensive property was sold for £1,500,000.00.
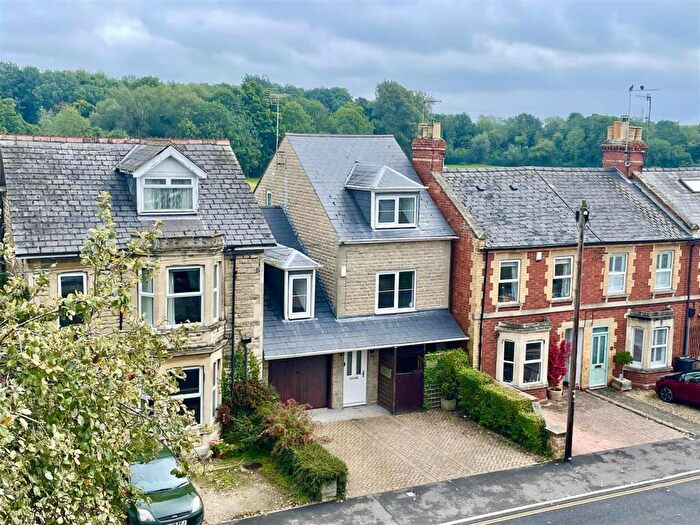
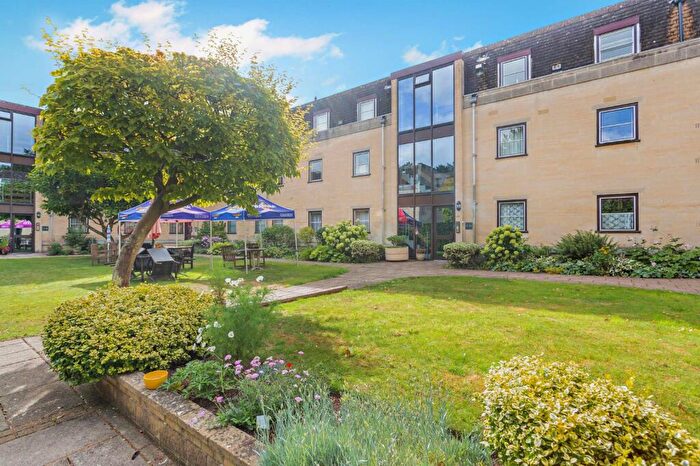
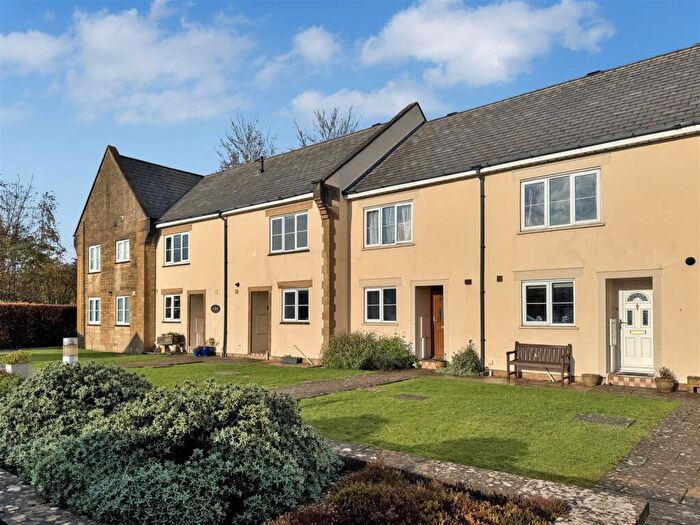
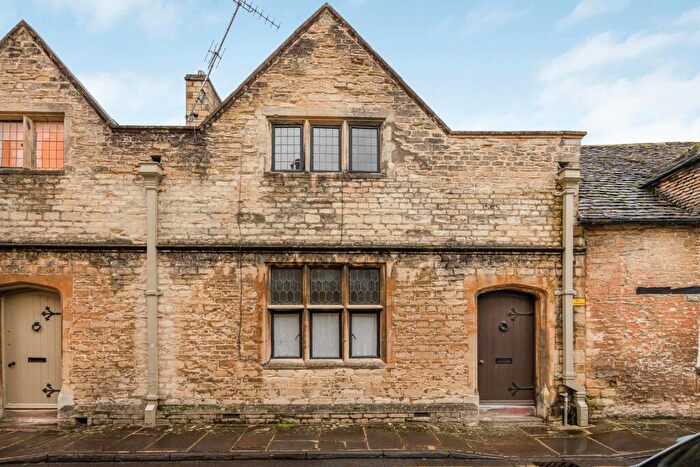
Properties for sale in Cirencester Park
Roads and Postcodes in Cirencester Park
Navigate through our locations to find the location of your next house in Cirencester Park, Cirencester for sale or to rent.
| Streets | Postcodes |
|---|---|
| Abbey House | GL7 2QU |
| Ashcroft Gardens | GL7 1RB GL7 1RD GL7 1RU |
| Ashcroft Road | GL7 1QX GL7 1QZ GL7 1RA |
| Barclay Court | GL7 2EN |
| Black Jack Street | GL7 2AA |
| Blake Road | GL7 2EG |
| Castle Mews | GL7 1QH |
| Castle Street | GL7 1QD |
| Cecily Hill | GL7 2EF |
| Chesterton Lane | GL7 1XG |
| Chesterton Park | GL7 1XS GL7 1XT GL7 1XU |
| Corinium Gate | GL7 2PX |
| Cotswold Avenue | GL7 1XW |
| Cotswold Close | GL7 1XP GL7 1XR |
| Coxwell Court | GL7 2BZ |
| Coxwell Street | GL7 2BH GL7 2BQ |
| Cricklade Street | GL7 1JF GL7 1JH GL7 1JN GL7 1LP |
| Dollar Street | GL7 2AJ GL7 2AN GL7 2AS |
| Dugdale Road | GL7 2DA |
| Dyer Street | GL7 2PF GL7 2PP |
| Estcote Road | GL7 2DB |
| Garden Close | GL7 1UW |
| Gloucester Street | GL7 2DG GL7 2DH GL7 2DJ GL7 2DP GL7 2DR GL7 2DW |
| Gooseacre Lane | GL7 2DS |
| Gosditch Street | GL7 2AG |
| Grantley Crescent | GL7 1XL |
| Hakeburn Road | GL7 2DD |
| Hereward Road | GL7 2EH GL7 2EQ |
| Keepers Gate | GL7 1UU |
| Lewis Lane | GL7 1EA GL7 1ED |
| Limes Close | GL7 1XH |
| London Road | GL7 2PU |
| Market Place | GL7 2PE |
| Martin Close | GL7 1XY |
| Mill Place | GL7 2BG |
| Mount Street | GL7 1TH GL7 1TJ |
| Mullings Court | GL7 2AW |
| Priory Close | GL7 2HJ |
| Querns Lane | GL7 1RH |
| Sheep Street | GL7 1QW |
| Silver Street | GL7 2BJ GL7 2BL |
| Somerford Road | GL7 1TN GL7 1TW |
| Spitalgate Lane | GL7 2DE |
| St Peters Road | GL7 1RE GL7 1RG |
| Stroud Road | GL7 1UZ |
| The Mead | GL7 2BB |
| The Waterloo | GL7 2PZ GL7 2QF GL7 2QQ GL7 2QR GL7 2QS GL7 2QT GL7 2QX |
| The Wool Market | GL7 2PR |
| Thomas Street | GL7 2AX GL7 2BA |
| Trafalgar Road | GL7 2EJ GL7 2EL GL7 2HL |
| West Market Place | GL7 2NH |
| West Way | GL7 1GS GL7 1JA |
Transport near Cirencester Park
- FAQ
- Price Paid By Year
- Property Type Price
Frequently asked questions about Cirencester Park
What is the average price for a property for sale in Cirencester Park?
The average price for a property for sale in Cirencester Park is £359,157. This amount is 32% lower than the average price in Cirencester. There are 775 property listings for sale in Cirencester Park.
What streets have the most expensive properties for sale in Cirencester Park?
The streets with the most expensive properties for sale in Cirencester Park are St Peters Road at an average of £915,000, Mill Place at an average of £695,000 and Thomas Street at an average of £663,400.
What streets have the most affordable properties for sale in Cirencester Park?
The streets with the most affordable properties for sale in Cirencester Park are Barclay Court at an average of £130,562, Ashcroft Gardens at an average of £169,136 and West Way at an average of £172,070.
Which train stations are available in or near Cirencester Park?
Some of the train stations available in or near Cirencester Park are Kemble, Stroud and Swindon.
Property Price Paid in Cirencester Park by Year
The average sold property price by year was:
| Year | Average Sold Price | Price Change |
Sold Properties
|
|---|---|---|---|
| 2025 | £365,822 | 10% |
45 Properties |
| 2024 | £327,552 | -17% |
61 Properties |
| 2023 | £383,455 | 11% |
67 Properties |
| 2022 | £342,963 | 14% |
73 Properties |
| 2021 | £293,506 | -14% |
93 Properties |
| 2020 | £334,894 | 25% |
55 Properties |
| 2019 | £250,659 | -36% |
59 Properties |
| 2018 | £341,176 | 30% |
67 Properties |
| 2017 | £240,499 | -9% |
54 Properties |
| 2016 | £261,335 | 11% |
75 Properties |
| 2015 | £231,557 | -19% |
76 Properties |
| 2014 | £274,775 | 12% |
79 Properties |
| 2013 | £241,696 | 14% |
51 Properties |
| 2012 | £207,352 | -2% |
50 Properties |
| 2011 | £210,599 | -26% |
68 Properties |
| 2010 | £266,098 | 18% |
57 Properties |
| 2009 | £218,119 | -34% |
42 Properties |
| 2008 | £293,298 | 24% |
42 Properties |
| 2007 | £223,673 | 5% |
95 Properties |
| 2006 | £212,472 | -14% |
115 Properties |
| 2005 | £241,655 | 4% |
69 Properties |
| 2004 | £231,010 | 14% |
79 Properties |
| 2003 | £198,696 | 25% |
81 Properties |
| 2002 | £148,576 | 24% |
86 Properties |
| 2001 | £113,178 | -1% |
80 Properties |
| 2000 | £113,837 | 1% |
80 Properties |
| 1999 | £113,258 | 17% |
86 Properties |
| 1998 | £94,314 | 9% |
93 Properties |
| 1997 | £85,632 | 18% |
68 Properties |
| 1996 | £70,310 | -17% |
75 Properties |
| 1995 | £81,967 | - |
64 Properties |
Property Price per Property Type in Cirencester Park
Here you can find historic sold price data in order to help with your property search.
The average Property Paid Price for specific property types in the last three years are:
| Property Type | Average Sold Price | Sold Properties |
|---|---|---|
| Semi Detached House | £517,039.00 | 32 Semi Detached Houses |
| Detached House | £645,933.00 | 15 Detached Houses |
| Terraced House | £415,116.00 | 52 Terraced Houses |
| Flat | £193,431.00 | 74 Flats |

