
Houses for sale in Cirencester, Gloucestershire
House Prices in Cirencester
Properties in Cirencester have an average house price of £526k and had 1,472 Property Transactions within the last 3 years.¹
Cirencester is an area in Gloucestershire with 15,952 households², where the most expensive property was sold for £7.25M.
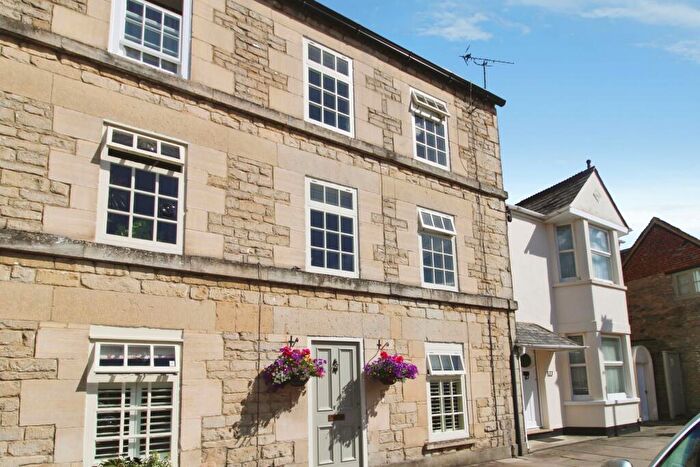
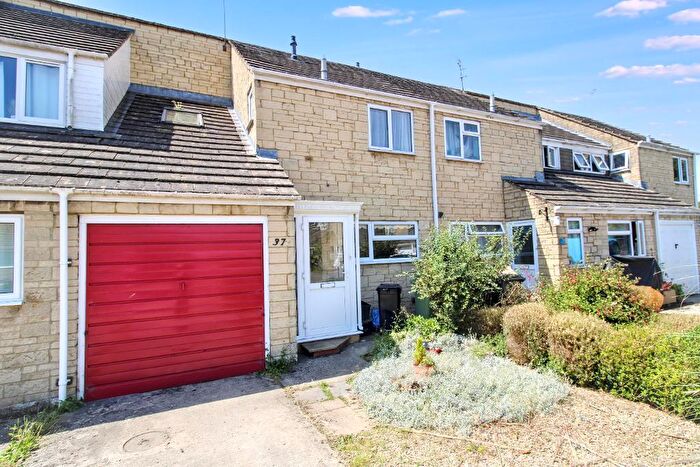
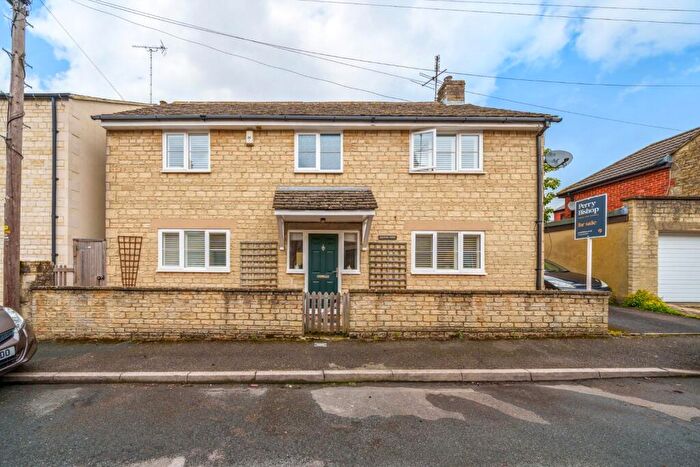
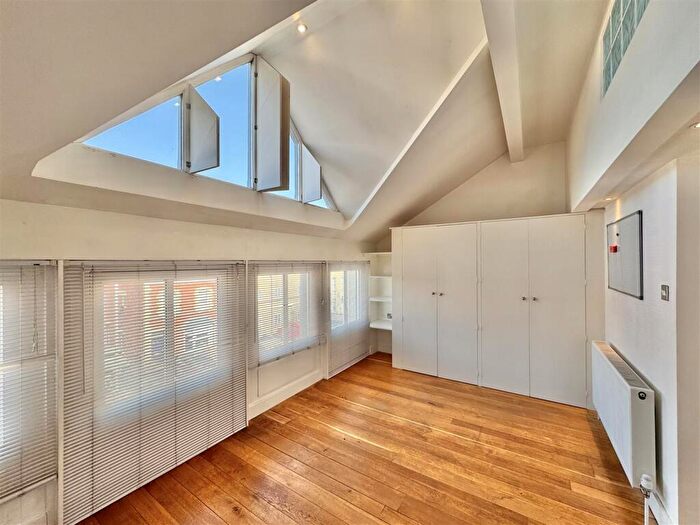
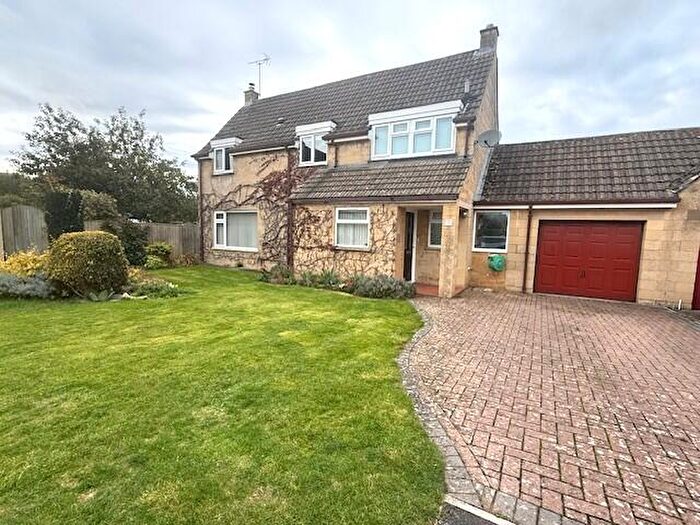
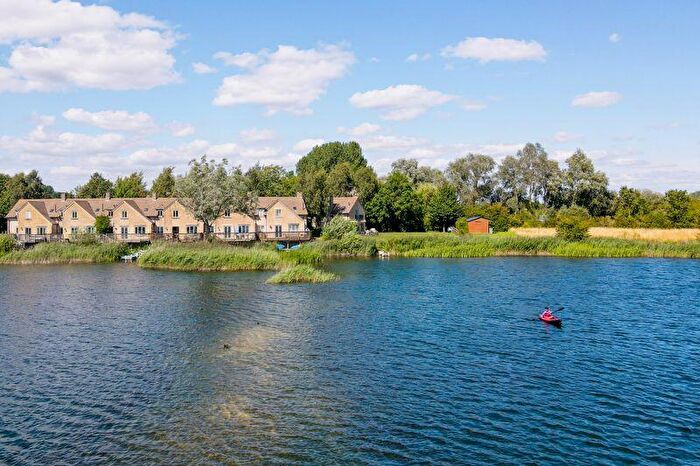
Properties for sale in Cirencester
![]()
If you are looking to sell your house, let it out, or receive a property valuation, an expert can help you.
Click the button below to get started.
Neighbourhoods in Cirencester
Navigate through our locations to find the location of your next house in Cirencester, Gloucestershire for sale or to rent.
- Ampney-coln
- Avening
- Bisley
- Churn Valley
- Cirencester Beeches
- Cirencester Chesterton
- Cirencester Park
- Cirencester Stratton-whiteway
- Cirencester Watermoor
- Ermin
- Fairford
- Hampton
- Riversmeet
- Thames Head
- Water Park
- Watermoor
- New Mills
- The Beeches
- St Michael's
- Four Acres
- Siddington & Cerney Rural
- Lechlade, Kempsford & Fairford South
- Coln Valley
- Fairford North
- The Ampneys & Hampton
- Chedworth & Churn Valley
- South Cerney Village
- Kemble
- Chesterton
- Stratton
Property price trends in Cirencester
According to the latest Land Registry data, the average home in Cirencester sold for £426,877 in 2026. That figure comes from a substantial record of 19,271 sales logged over the past 31 years.
Prices have fallen back over the last three years. Compared with 2023, when the typical sale came in around £526,408, that's a fall of roughly 18.9%.
Looking back five years, average prices are down about 10.2% since 2021, a drop of around £48,696 in cash terms.
Zoom out to the past decade for the fuller picture. Back in 2016, homes here averaged £367,306, so the typical sold price has climbed about 16.2% since then, roughly 1.5% a year. Stretch the view to fifteen years and that annual pace edges up closer to 2.4%.
Frequently asked questions about Cirencester
What is the average price for a property for sale in Cirencester?
The average price for a property for sale in Cirencester is £526,127. This amount is 40% higher than the average price in Gloucestershire. There are more than 10,000 property listings for sale in Cirencester.
What locations have the most expensive properties for sale in Cirencester?
The locations with the most expensive properties for sale in Cirencester are Chedworth & Churn Valley at an average of £2,010,550, Lechlade, Kempsford & Fairford South at an average of £1,439,630 and Riversmeet at an average of £1,014,980.
What locations have the most affordable properties for sale in Cirencester?
The locations with the most affordable properties for sale in Cirencester are Chesterton at an average of £240,276, New Mills at an average of £246,333 and Four Acres at an average of £266,500.
Which train stations are available in or near Cirencester?
Some of the train stations available in or near Cirencester are Kemble, Swindon and Stroud.
Property Price Paid in Cirencester by Year
The average sold property price by year was:
| Year | Average Sold Price | Price Change |
Sold Properties
|
|---|---|---|---|
| 2026 | £426,877 | -22% |
30 Properties |
| 2025 | £518,927 | -4% |
491 Properties |
| 2024 | £539,612 | 2% |
473 Properties |
| 2023 | £526,408 | 2% |
478 Properties |
| 2022 | £514,221 | 8% |
566 Properties |
| 2021 | £475,573 | 4% |
806 Properties |
| 2020 | £458,513 | 14% |
555 Properties |
| 2019 | £394,108 | 2% |
539 Properties |
| 2018 | £386,091 | -1% |
585 Properties |
| 2017 | £388,327 | 5% |
702 Properties |
Property Price per Property Type in Cirencester
Here you can find historic sold price data in order to help with your property search.
The average Property Paid Price for specific property types in the last three years are:
| Property Type | Average Sold Price | Sold Properties |
|---|---|---|
| Semi Detached House | £438,438.00 | 375 Semi Detached Houses |
| Terraced House | £356,229.00 | 431 Terraced Houses |
| Detached House | £882,293.00 | 471 Detached Houses |
| Flat | £209,998.00 | 195 Flats |
Transport in Cirencester
Please see below transportation links in this area:
