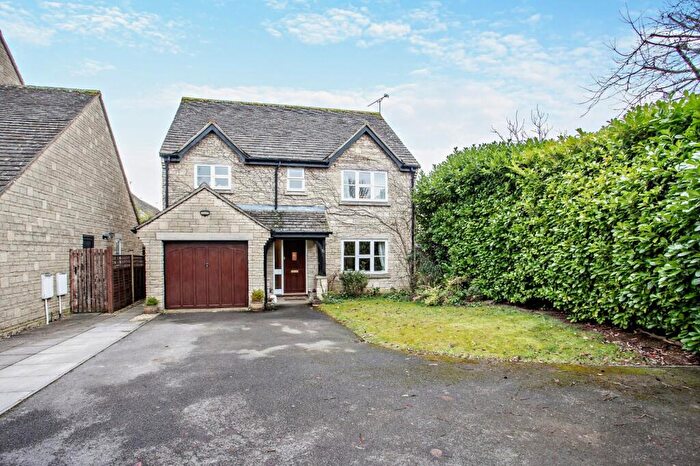
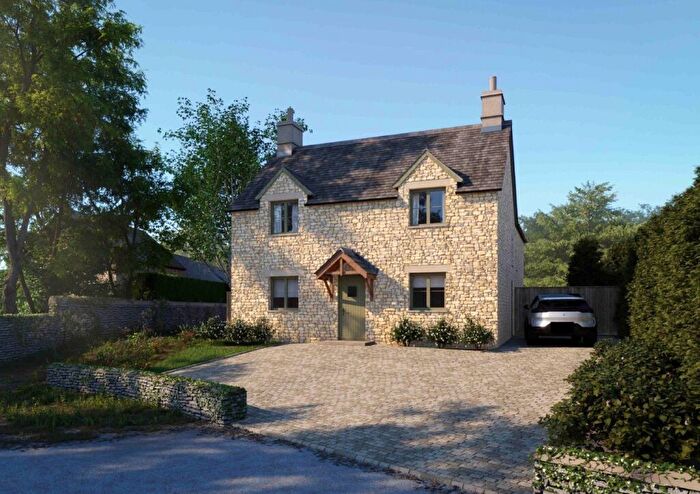
Houses for sale & to rent in Fairford, Cirencester
House Prices in Fairford
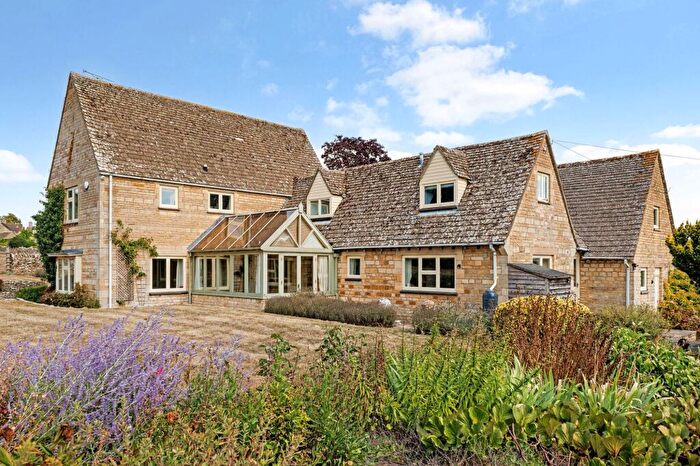
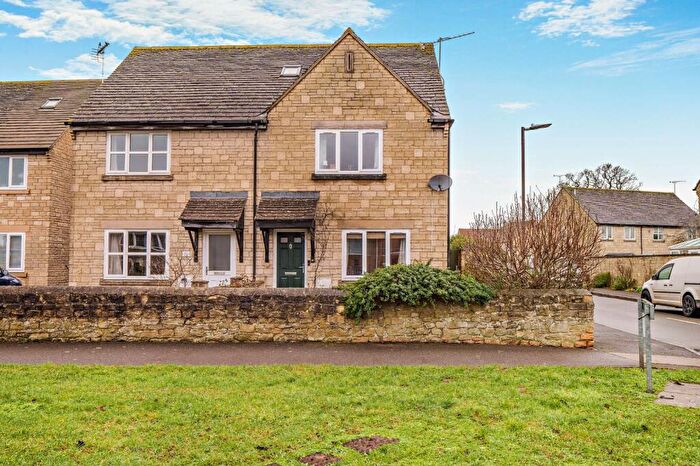
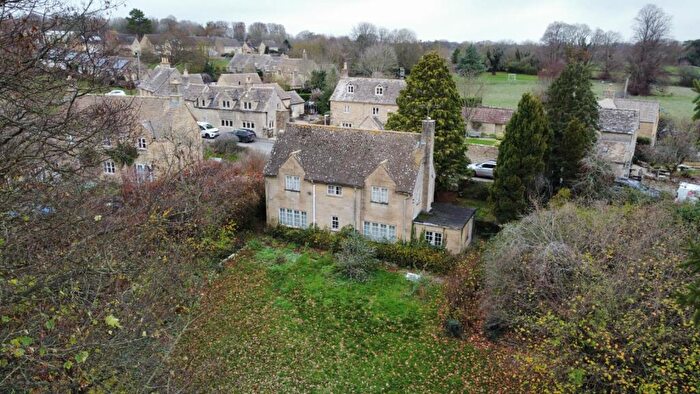
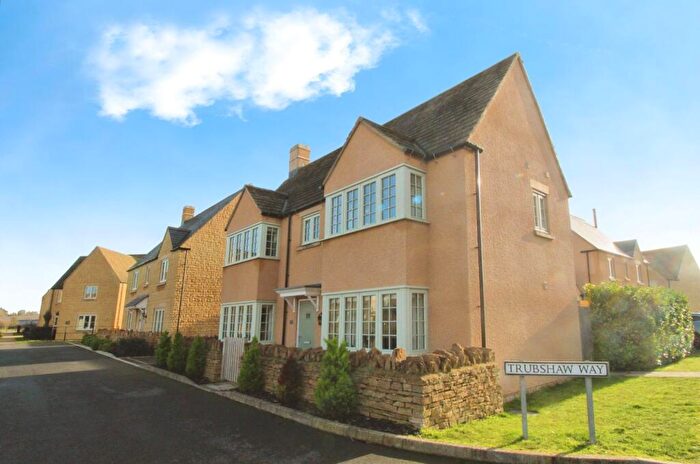
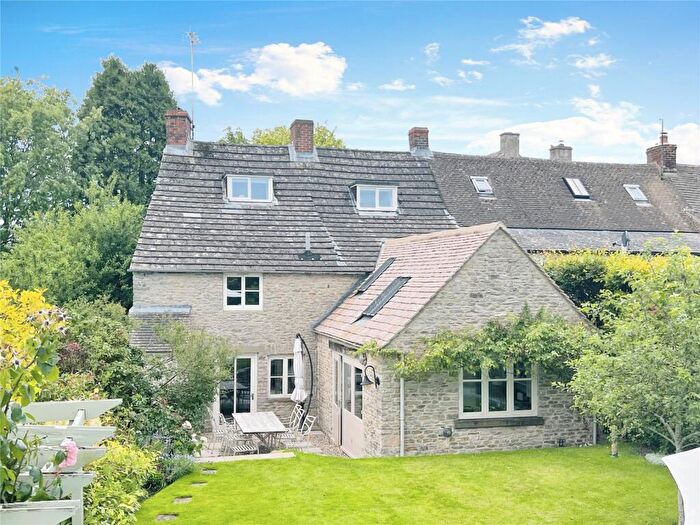
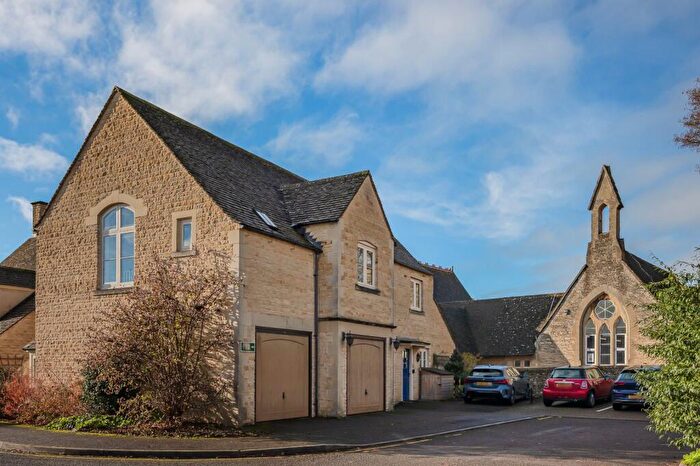
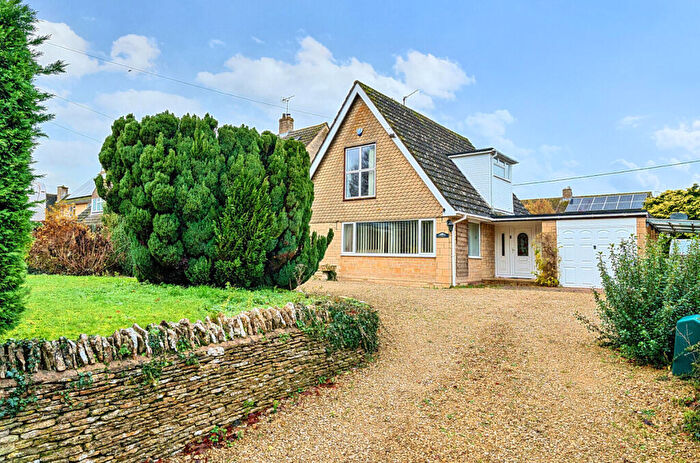
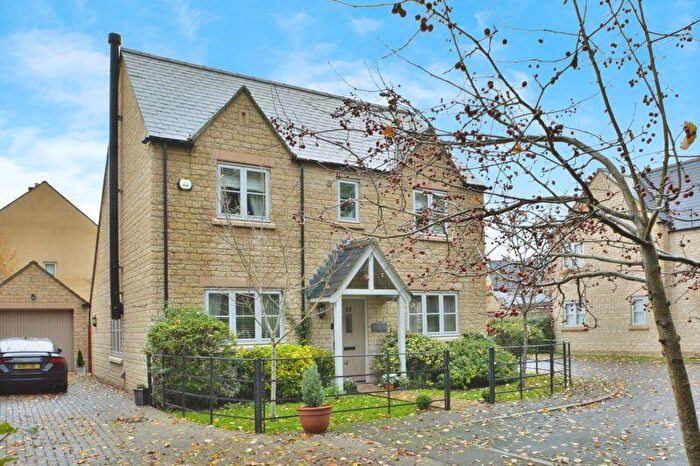
Properties in Fairford have an average house price of £843,133.00 and had 15 Property Transactions within the last 3 years¹.
Fairford is an area in Cirencester, Gloucestershire with 281 households², where the most expensive property was sold for £2,550,000.00.
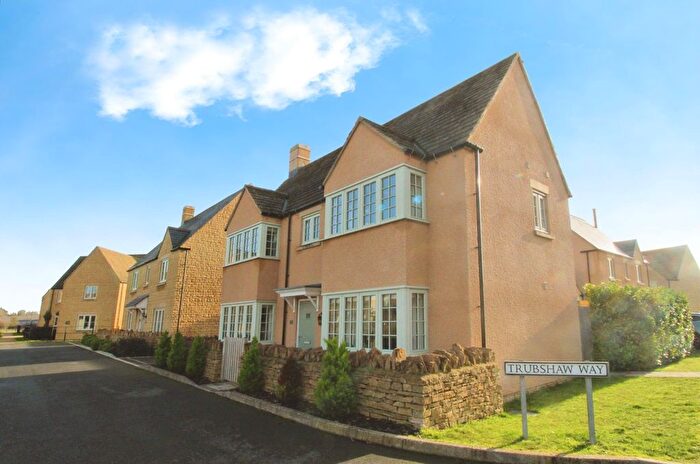
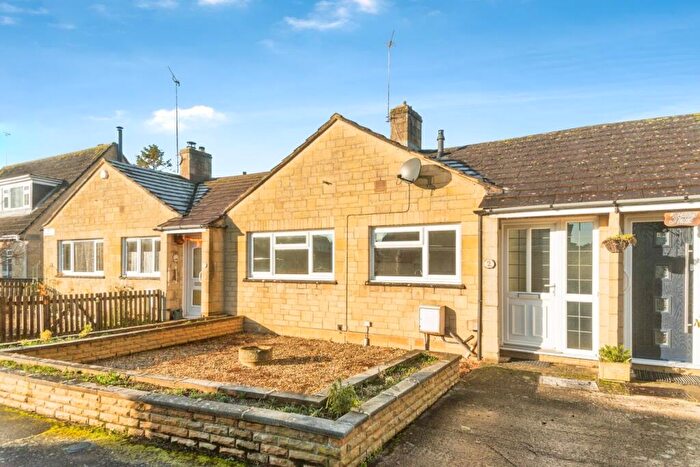
Properties for sale in Fairford
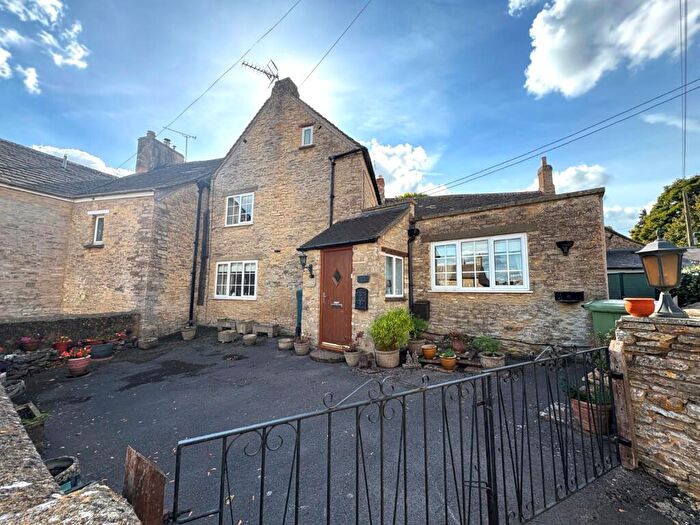
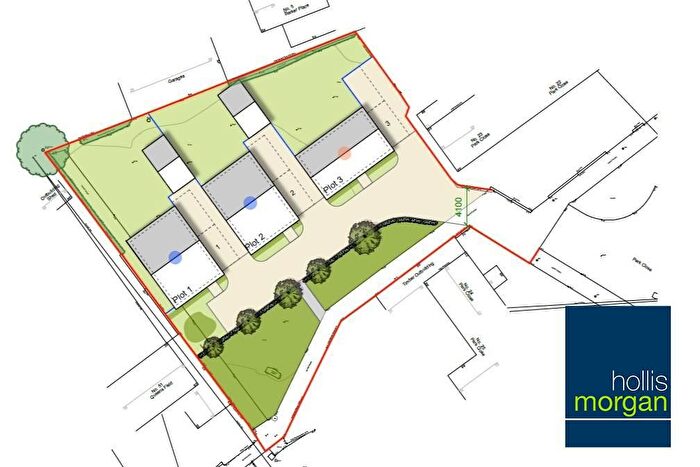
Previously listed properties in Fairford
Roads and Postcodes in Fairford
Navigate through our locations to find the location of your next house in Fairford, Cirencester for sale or to rent.
| Streets | Postcodes |
|---|---|
| Church Road | GL7 5BL GL7 5BN |
| Coneygar Road | GL7 5BY GL7 5BZ |
| Fairford Road | GL7 5BT |
| Fowlers Hill | GL7 5DA GL7 5DB |
| Mawley Road | GL7 5BH GL7 5BJ |
| Netherton | GL7 5DE |
| Netherton Cottages | GL7 5DD |
| Painters Field | GL7 5DL |
| Spring Gardens | GL7 5BG |
| Springfield Road | GL7 5BU |
| The Green | GL7 5BS |
| Victoria Road | GL7 5BW |
| Welsh Way | GL7 5TA |
| Woodside | GL7 5BE |
| GL7 3NA GL7 3NE GL7 5AS GL7 5LH |
Transport near Fairford
- FAQ
- Price Paid By Year
- Property Type Price
Frequently asked questions about Fairford
What is the average price for a property for sale in Fairford?
The average price for a property for sale in Fairford is £843,133. This amount is 61% higher than the average price in Cirencester. There are 384 property listings for sale in Fairford.
What streets have the most expensive properties for sale in Fairford?
The streets with the most expensive properties for sale in Fairford are Welsh Way at an average of £1,525,000, Spring Gardens at an average of £662,500 and Painters Field at an average of £529,000.
What streets have the most affordable properties for sale in Fairford?
The streets with the most affordable properties for sale in Fairford are The Green at an average of £339,250 and Springfield Road at an average of £403,750.
Which train stations are available in or near Fairford?
Some of the train stations available in or near Fairford are Kemble, Swindon and Shipton.
Property Price Paid in Fairford by Year
The average sold property price by year was:
| Year | Average Sold Price | Price Change |
Sold Properties
|
|---|---|---|---|
| 2025 | £857,500 | 16% |
3 Properties |
| 2024 | £718,375 | -25% |
4 Properties |
| 2023 | £900,125 | -49% |
8 Properties |
| 2022 | £1,337,381 | 31% |
7 Properties |
| 2021 | £921,700 | 25% |
15 Properties |
| 2020 | £689,625 | 18% |
12 Properties |
| 2019 | £564,055 | 20% |
9 Properties |
| 2018 | £453,112 | -31% |
10 Properties |
| 2017 | £594,444 | 39% |
9 Properties |
| 2016 | £362,111 | -30% |
9 Properties |
| 2015 | £472,116 | -17% |
15 Properties |
| 2014 | £553,666 | 14% |
12 Properties |
| 2013 | £475,500 | -8% |
10 Properties |
| 2012 | £513,812 | 14% |
8 Properties |
| 2011 | £443,662 | 11% |
12 Properties |
| 2010 | £396,437 | -6% |
8 Properties |
| 2009 | £419,486 | 28% |
14 Properties |
| 2008 | £301,761 | -47% |
8 Properties |
| 2007 | £443,754 | 8% |
17 Properties |
| 2006 | £409,684 | -1% |
16 Properties |
| 2005 | £413,300 | -2% |
10 Properties |
| 2004 | £422,261 | -5% |
13 Properties |
| 2003 | £445,346 | 11% |
13 Properties |
| 2002 | £397,281 | 23% |
16 Properties |
| 2001 | £306,687 | 11% |
8 Properties |
| 2000 | £274,214 | 40% |
14 Properties |
| 1999 | £164,725 | -42% |
18 Properties |
| 1998 | £233,428 | -6% |
10 Properties |
| 1997 | £246,529 | 43% |
19 Properties |
| 1996 | £140,277 | 3% |
9 Properties |
| 1995 | £136,147 | - |
17 Properties |
Property Price per Property Type in Fairford
Here you can find historic sold price data in order to help with your property search.
The average Property Paid Price for specific property types in the last three years are:
| Property Type | Average Sold Price | Sold Properties |
|---|---|---|
| Semi Detached House | £395,900.00 | 5 Semi Detached Houses |
| Terraced House | £316,666.00 | 3 Terraced Houses |
| Detached House | £1,388,214.00 | 7 Detached Houses |

