
Houses for sale in Kemble, Cirencester
House Prices in Kemble
Properties in Kemble have an average house price of £803k and had 26 Property Transactions within the last 3 years¹.
Kemble is an area in Cirencester, Gloucestershire with 171 households², where the most expensive property was sold for £4.4M.
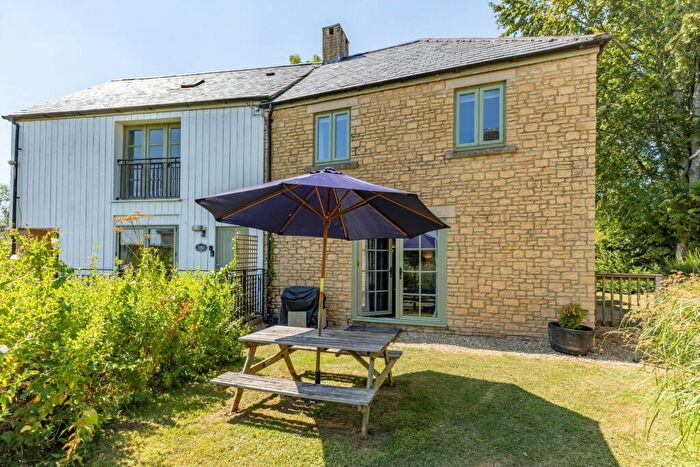
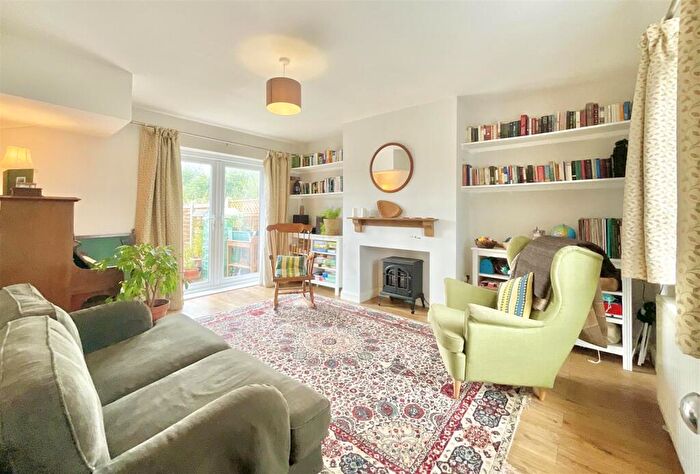
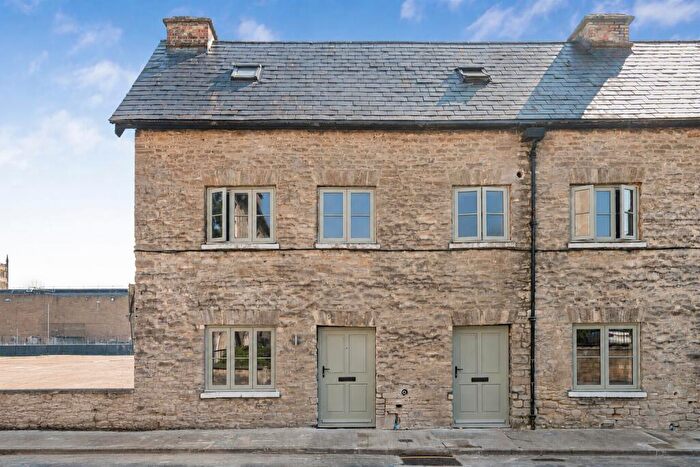
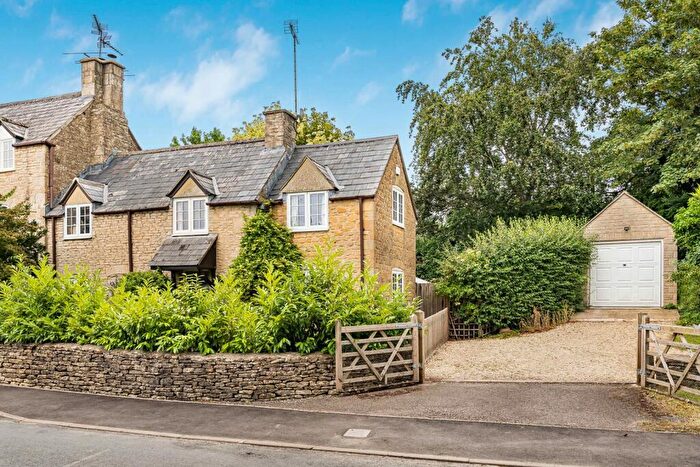
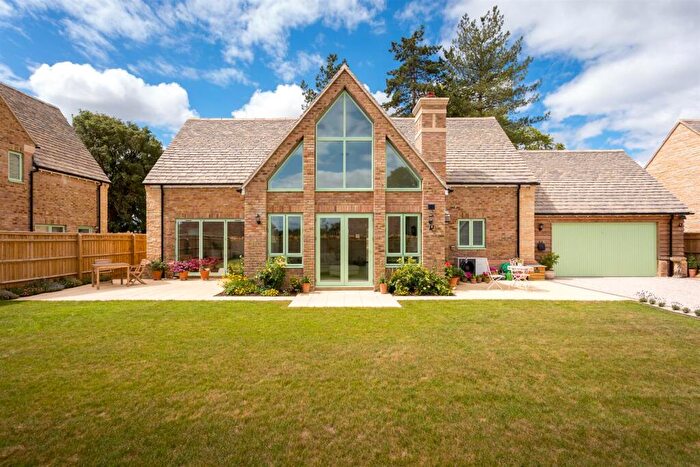
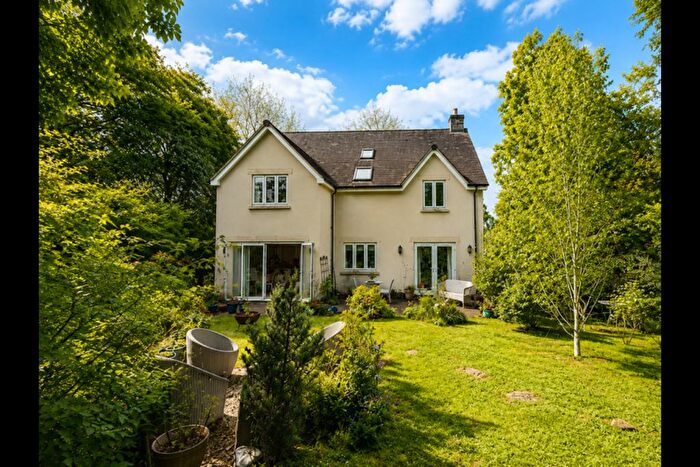
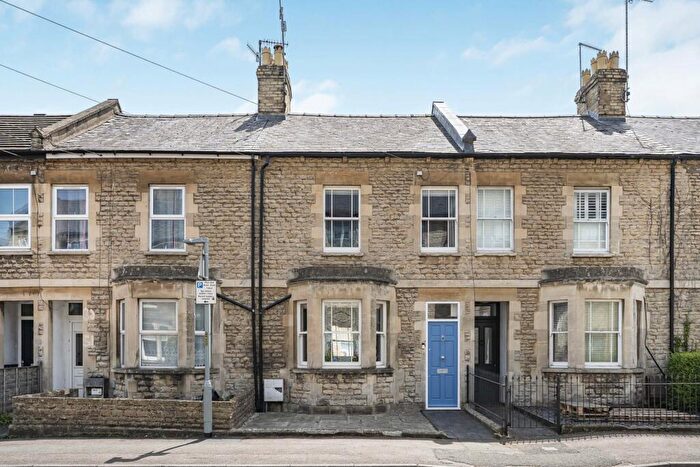
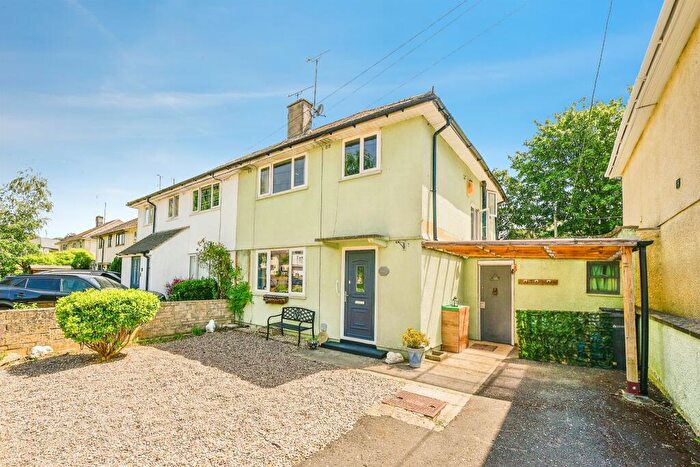
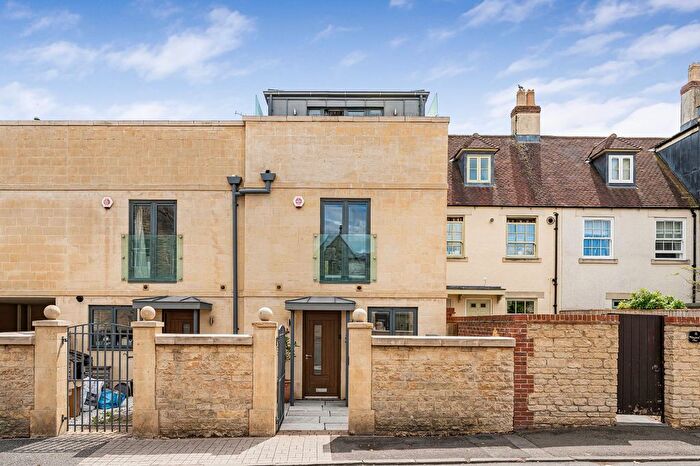
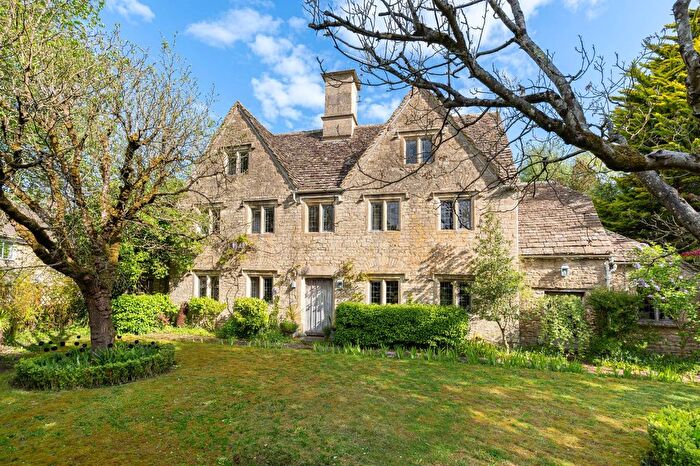
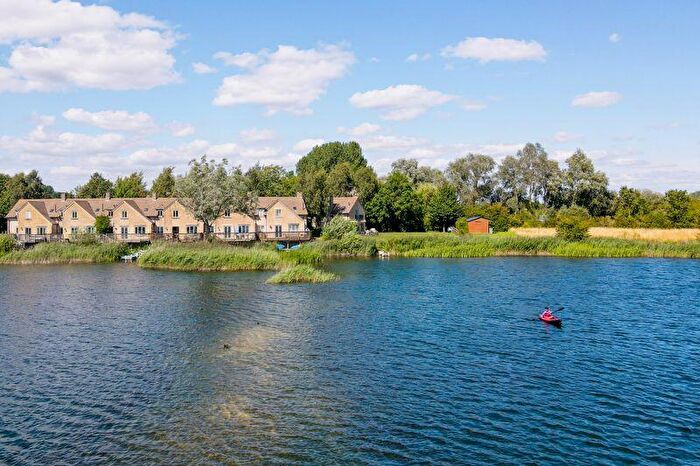
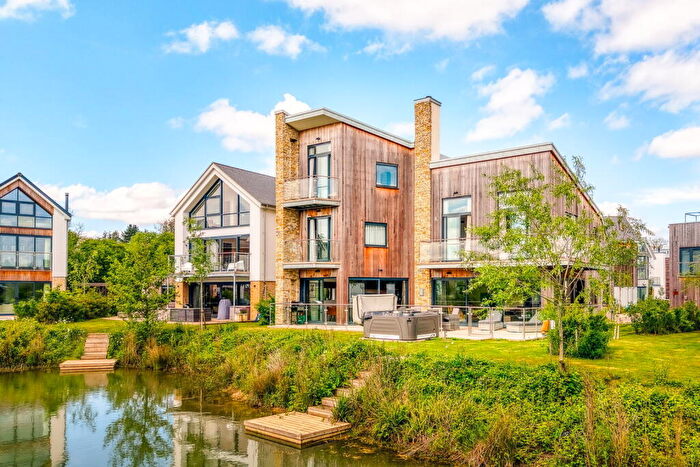
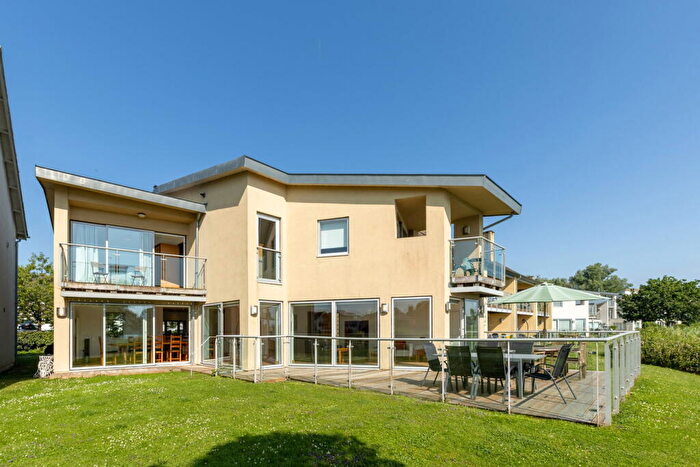
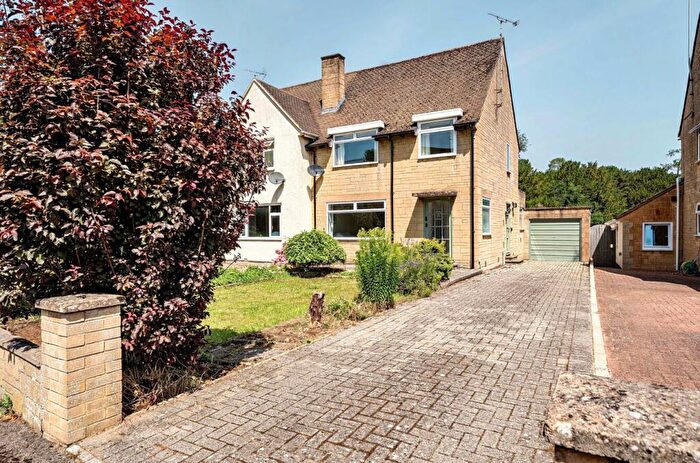
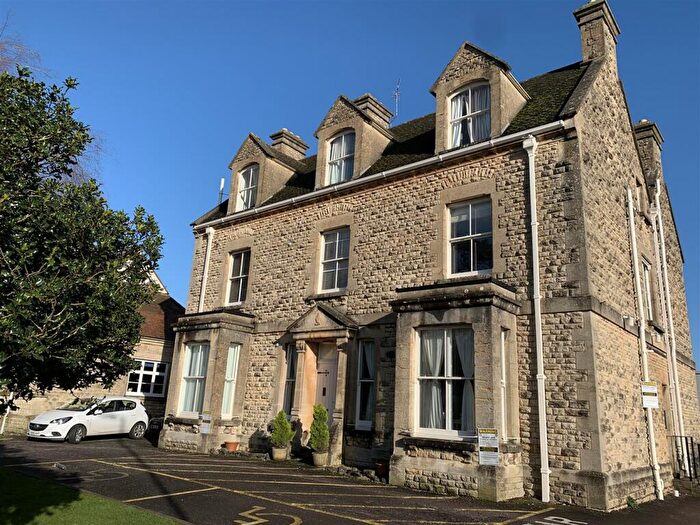
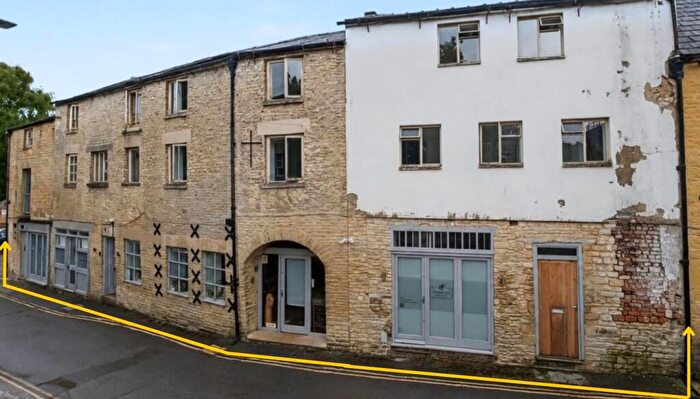
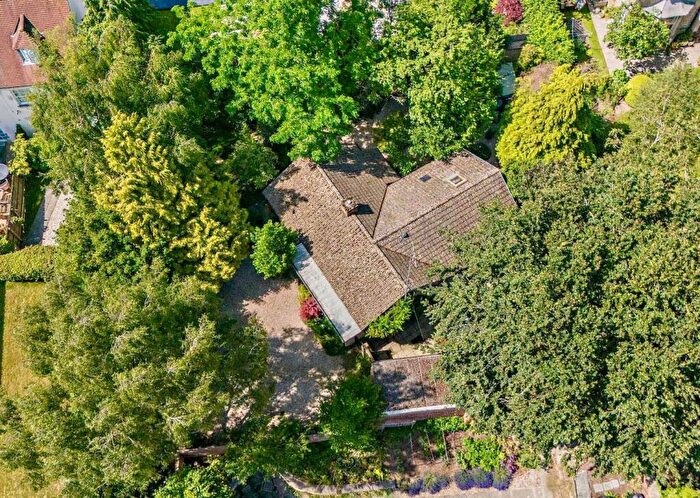
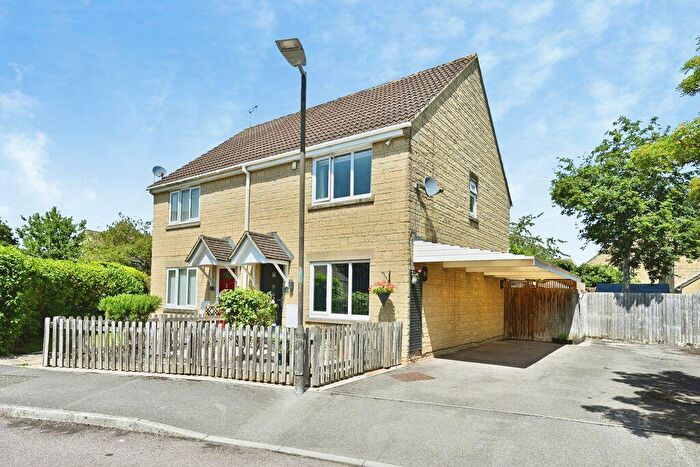
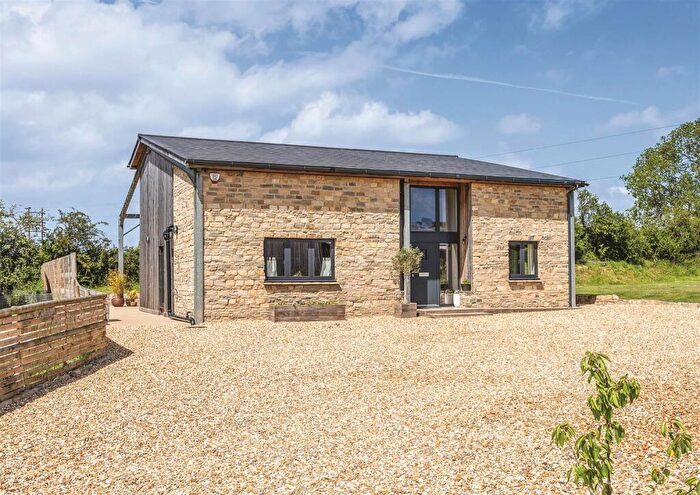
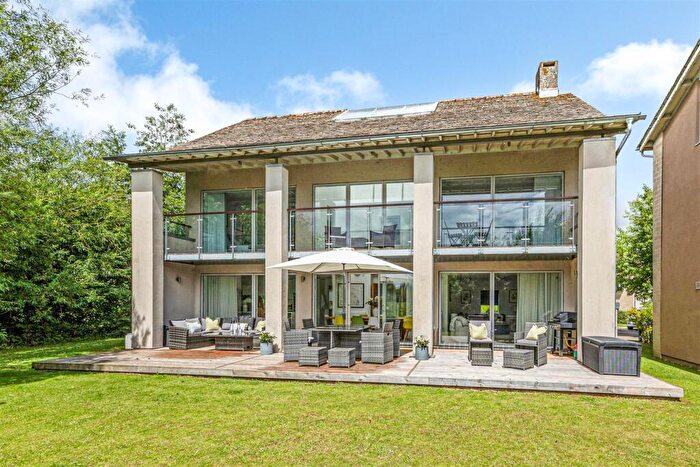
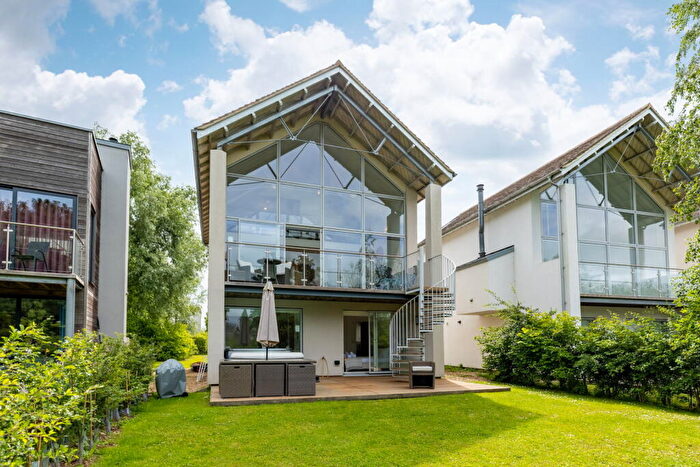
Properties for sale in Kemble
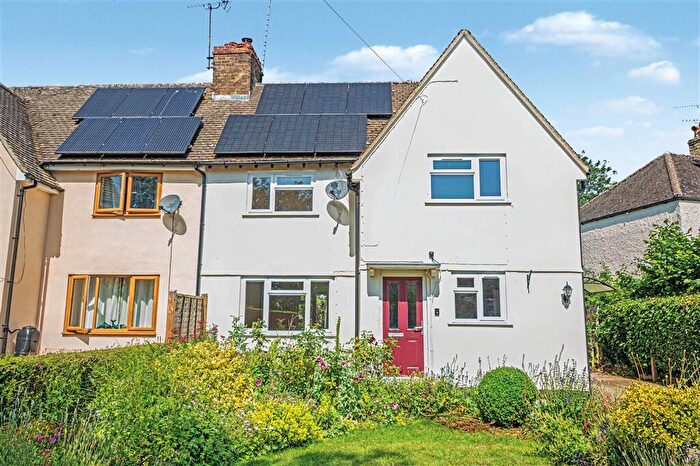
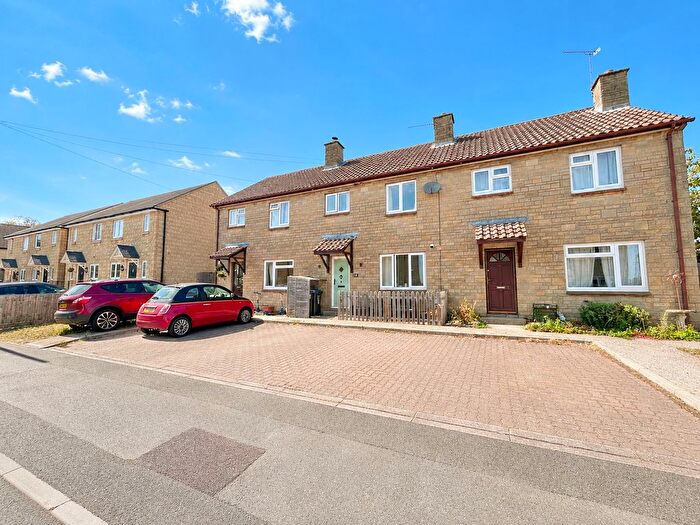
![]()
If you are looking to sell your house, let it out, or receive a property valuation, an expert can help you.
Click the button below to get started.

Roads and Postcodes in Kemble
Navigate through our locations to find the location of your next house in Kemble, Cirencester for sale or to rent.
| Streets | Postcodes |
|---|---|
| Abbots Way | GL7 6AJ |
| Haresdown Hill | GL7 6PH |
| Home Piece | GL7 6PR |
| Hullasey Grove Lane | GL7 6QN |
| Jackaments | GL7 6PL |
| Kemble Enterprise Park | GL7 6FD GL7 6ND |
| Lower Mill Estate | GL7 6FT GL7 6QG GL7 6FL GL7 6FN GL7 6FQ GL7 6FW GL7 6FZ GL7 6GB GL7 6GD GL7 6QE |
| Lower Mill Lane | GL7 6FU |
| Neighbridge | GL7 6DX |
| Ox Yard | GL7 6QB |
| Saxon Fields | GL7 6QL |
| Spratsgate Lane | GL7 6DF |
| Tamesis Drive | GL7 6BJ |
| Tetbury Road | GL7 6BN |
| The Paddocks | GL7 6FE |
| Top Farm | GL7 6FA |
| West Lane | GL7 6AH |
| GL7 6DY GL7 6PQ GL7 6PW GL7 6AX GL7 6BP GL7 6BW GL7 6BX GL7 6BZ GL7 6DG GL7 6DQ GL7 6EB GL7 6EF GL7 6EH GL7 6FH GL7 6GA GL7 6JW GL7 6LA GL7 6NY GL7 6PD GL7 6PF GL7 6PG GL7 6PN GL7 6PP |
Property price trends in Kemble
According to the latest Land Registry data, the average home in Kemble sold for £1,690,000 in 2025. That figure comes from 202 sales logged over the past 24 years.
Prices have continued to climb over the last three years. Compared with 2022, when the typical sale came in around £847,920, that's a rise of roughly 99.3%.
Looking back five years, average prices are up about 301.3% since 2020, a gain of around £1,268,900 in cash terms.
Zoom out to the past decade for the fuller picture. Back in 2015, homes here averaged £431,250, so the typical sold price has climbed about 291.9% since then, roughly 14.6% a year. Stretch the view to fifteen years and that annual pace eases back to about 12.2%.
Frequently asked questions about Kemble
What is the average price for a property for sale in Kemble?
The average price for a property for sale in Kemble is £802,788. This amount is 53% higher than the average price in Cirencester. There are 1,362 property listings for sale in Kemble.
What streets have the most expensive properties for sale in Kemble?
The streets with the most expensive properties for sale in Kemble are Top Farm at an average of £950,000 and Tamesis Drive at an average of £750,000.
What streets have the most affordable properties for sale in Kemble?
The streets with the most affordable properties for sale in Kemble are Lower Mill Estate at an average of £618,323 and Lower Mill Lane at an average of £705,000.
Which train stations are available in or near Kemble?
Some of the train stations available in or near Kemble are Kemble, Stroud and Swindon.
Property Price Paid in Kemble by Year
The average sold property price by year was:
| Year | Average Sold Price | Price Change |
Sold Properties
|
|---|---|---|---|
| 2025 | £1,690,000 | 55% |
4 Properties |
| 2024 | £767,700 | 30% |
10 Properties |
| 2023 | £536,291 | -58% |
12 Properties |
| 2022 | £847,920 | 29% |
12 Properties |
| 2021 | £597,827 | 30% |
29 Properties |
| 2020 | £421,100 | -2% |
21 Properties |
| 2019 | £430,027 | 15% |
18 Properties |
| 2018 | £366,382 | -76% |
17 Properties |
| 2017 | £646,160 | 19% |
23 Properties |
| 2016 | £524,980 | 18% |
21 Properties |
Property Price per Property Type in Kemble
Here you can find historic sold price data in order to help with your property search.
The average Property Paid Price for specific property types in the last three years are:
| Property Type | Average Sold Price | Sold Properties |
|---|---|---|
| Semi Detached House | £455,833.00 | 3 Semi Detached Houses |
| Detached House | £945,684.00 | 19 Detached Houses |
| Flat | £384,250.00 | 4 Flats |
