
Houses for sale in Redmarley, Gloucester
House Prices in Redmarley
Properties in Redmarley have an average house price of £528k and had 48 Property Transactions within the last 3 years¹.
Redmarley is an area in Gloucester, Gloucestershire with 638 households², where the most expensive property was sold for £1.68M.
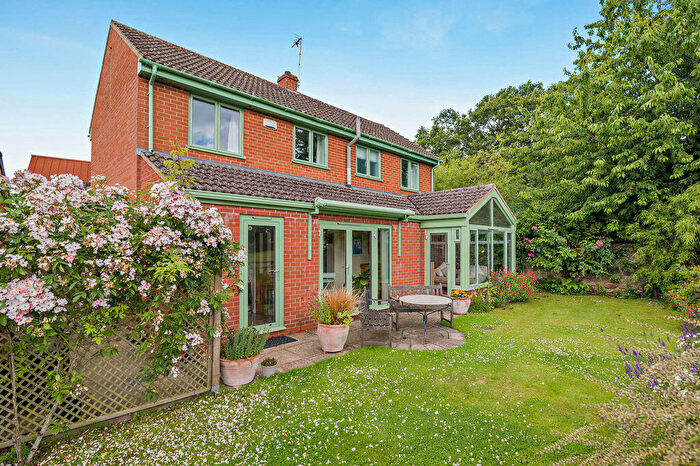
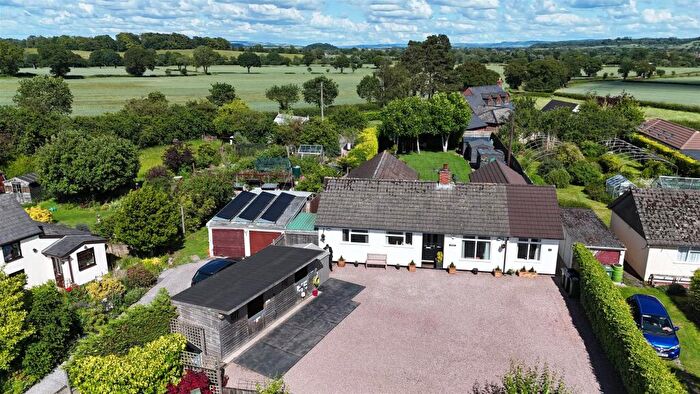
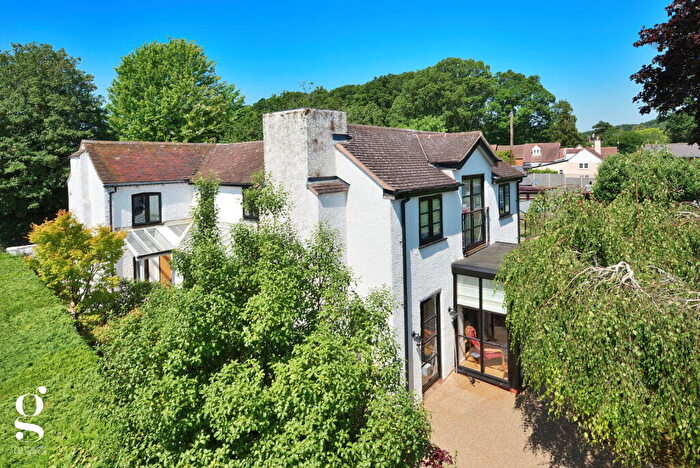
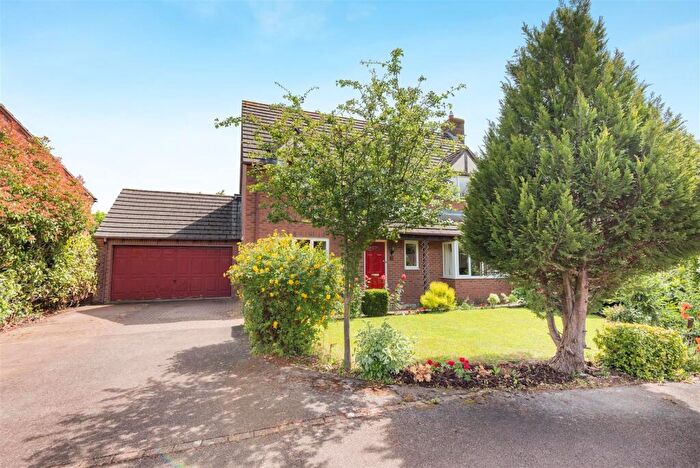
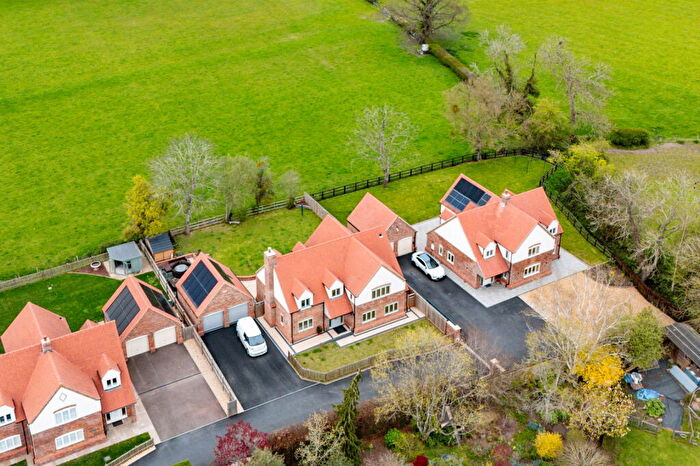
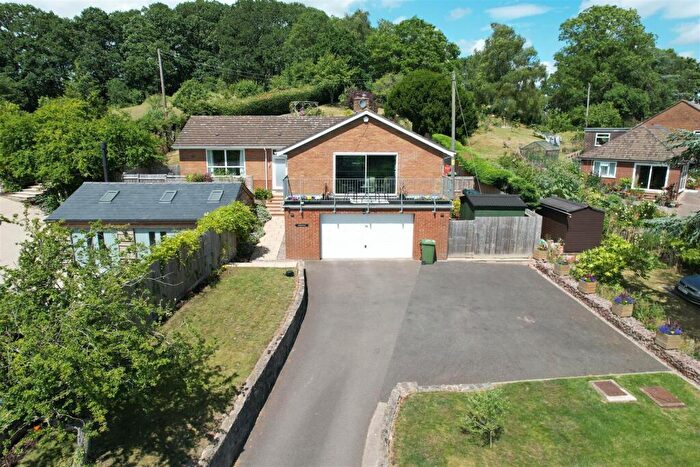
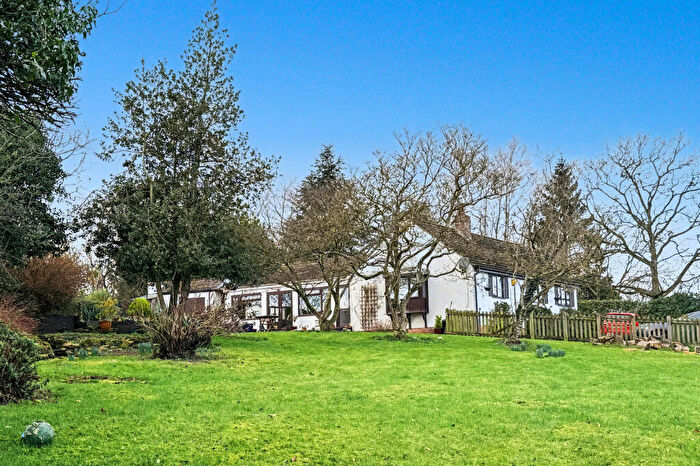
Properties for sale in Redmarley
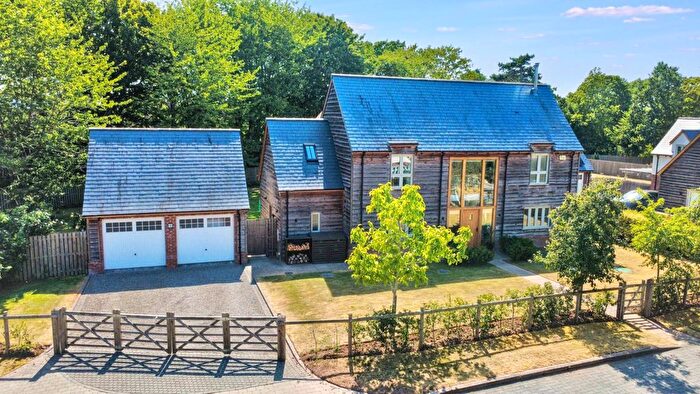

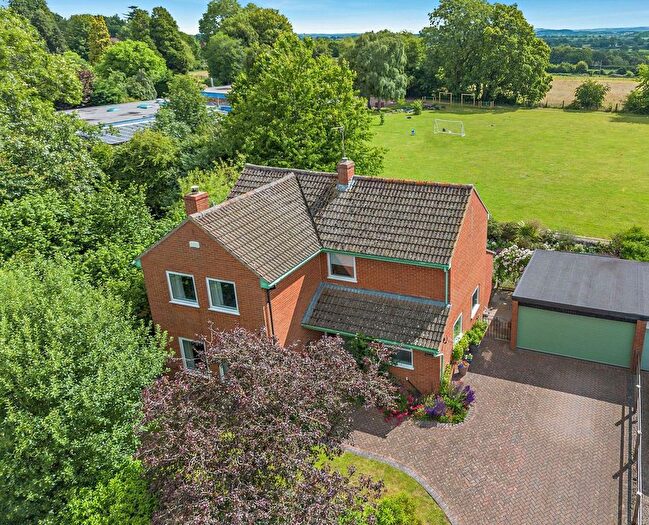
![]()
If you are looking to sell your house, let it out, or receive a property valuation, an expert can help you.
Click the button below to get started.
Roads and Postcodes in Redmarley
Navigate through our locations to find the location of your next house in Redmarley, Gloucester for sale or to rent.
| Streets | Postcodes |
|---|---|
| Brand Green | GL19 3JD GL19 3JE |
| Bromsberrow Road | GL19 3JU |
| Causeway | GL19 3JS |
| Chapel Lane | GL19 3JF |
| Chartist Lane | GL19 3NL |
| Chartist Piece | GL19 3RU |
| Chartist Way | GL19 3RT |
| Collins Close | GL19 3QZ |
| Compton Green | GL19 3JB |
| Cooks Lane | GL19 3LD |
| Cullingham Close | GL19 3RX |
| Drury Lane | GL19 3JX |
| Durbridge Road | GL19 3LP |
| Hadfield Close | GL19 3QY |
| Hawcross | GL19 3JQ |
| Hyde Park Corner | GL19 3JR |
| Innerstone Lane | GL19 3JH |
| Jubilee Place | GL19 3RS |
| Ledbury Road | GL19 3JY GL19 3NJ GL19 3QA GL19 3QF |
| Ledbury Road Crescent | GL19 3QB |
| Little Green | GL19 3LQ |
| Lovett Close | GL19 3RZ |
| Lowbands | GL19 3SL |
| Malvern Road | GL19 3NT GL19 3NZ |
| Mill Lane | GL19 3SH |
| Millennium Cottages | GL19 3PZ |
| Moat Lane | GL19 3QG |
| Newent Road | GL19 3QR GL19 3QW |
| O'connor Close | GL19 3RY |
| Old Pike | GL19 3QJ GL19 3QL GL19 3QN |
| Orchard End | GL19 3QX |
| Park Gate | GL19 3NH |
| Parsons Lane | GL19 3SJ |
| Pauntley | GL19 3HZ |
| Pauntley Drive | GL19 3JA |
| Payford | GL19 3HY |
| Pendock Road | GL19 3LG |
| Phillips Lane | GL19 3NF |
| Playley Green | GL19 3NB |
| Prince Crescent | GL19 3RF |
| Red Ditch Lane | GL19 3HT |
| The Green | GL19 3JT |
| The Heath | GL19 3ND |
| The Lottery | GL19 3HX |
| Tower House Drive | GL19 3NG |
| Wyndbrook Lane | GL19 3LF |
| GL19 3HS GL19 3JP GL19 3LB GL19 3LR GL19 3LS GL19 3NA GL19 3QP |
Property price trends in Redmarley
According to the latest Land Registry data, the average home in Redmarley sold for £269,750 in 2026. That figure comes from 776 sales logged over the past 31 years.
Prices have fallen back over the last three years. Compared with 2023, when the typical sale came in around £595,263, that's a fall of roughly 54.7%.
Looking back five years, average prices are down about 39.3% since 2021, a drop of around £174,897 in cash terms.
Zoom out to the past decade for the fuller picture. Back in 2016, homes here averaged £286,475, so the typical sold price has fallen about 5.8% since then, around 0.6% a year lower. Stretch the view to fifteen years and that annual pace holds at about -0.7%.
Frequently asked questions about Redmarley
What is the average price for a property for sale in Redmarley?
The average price for a property for sale in Redmarley is £528,010. This amount is 86% higher than the average price in Gloucester. There are 205 property listings for sale in Redmarley.
What streets have the most expensive properties for sale in Redmarley?
The streets with the most expensive properties for sale in Redmarley are Drury Lane at an average of £1,292,500, Brand Green at an average of £807,500 and The Green at an average of £785,000.
What streets have the most affordable properties for sale in Redmarley?
The streets with the most affordable properties for sale in Redmarley are Jubilee Place at an average of £227,375, Cullingham Close at an average of £230,500 and Hyde Park Corner at an average of £315,000.
Which train stations are available in or near Redmarley?
Some of the train stations available in or near Redmarley are Ledbury, Colwall and Gloucester.
Property Price Paid in Redmarley by Year
The average sold property price by year was:
| Year | Average Sold Price | Price Change |
Sold Properties
|
|---|---|---|---|
| 2026 | £269,750 | -78% |
2 Properties |
| 2025 | £479,250 | -8% |
12 Properties |
| 2024 | £516,266 | -15% |
15 Properties |
| 2023 | £595,263 | 24% |
19 Properties |
| 2022 | £450,158 | 1% |
25 Properties |
| 2021 | £444,647 | 0,2% |
37 Properties |
| 2020 | £443,760 | 17% |
25 Properties |
| 2019 | £367,786 | 8% |
19 Properties |
| 2018 | £338,787 | -6% |
23 Properties |
| 2017 | £357,434 | 20% |
23 Properties |
Property Price per Property Type in Redmarley
Here you can find historic sold price data in order to help with your property search.
The average Property Paid Price for specific property types in the last three years are:
| Property Type | Average Sold Price | Sold Properties |
|---|---|---|
| Semi Detached House | £373,928.00 | 7 Semi Detached Houses |
| Detached House | £628,484.00 | 33 Detached Houses |
| Terraced House | £248,375.00 | 8 Terraced Houses |
