
Houses for sale in Gloucester, Gloucestershire
House Prices in Gloucester
Properties in Gloucester have an average house price of £284k and had 8,314 Property Transactions within the last 3 years.¹
Gloucester is an area in Gloucestershire with 80,500 households², where the most expensive property was sold for £2.5M.
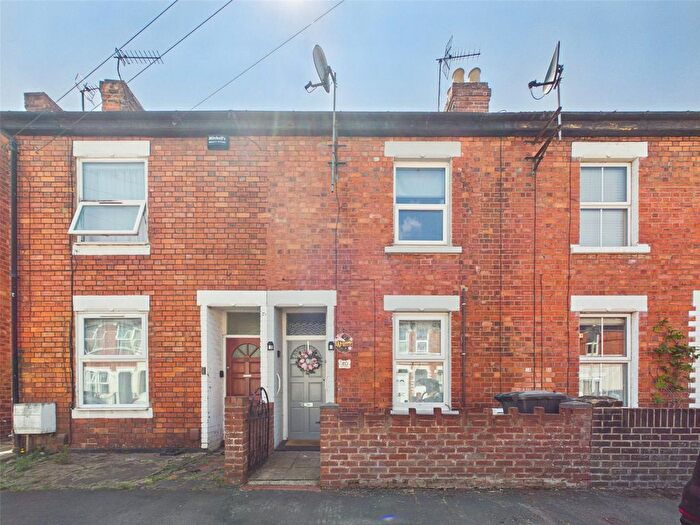
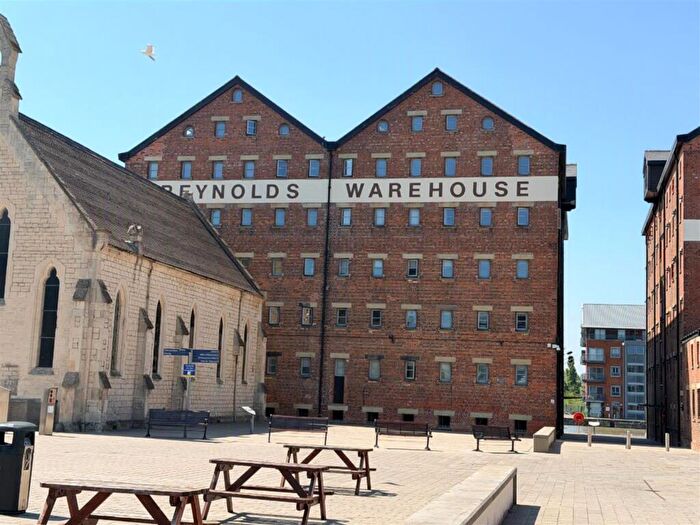
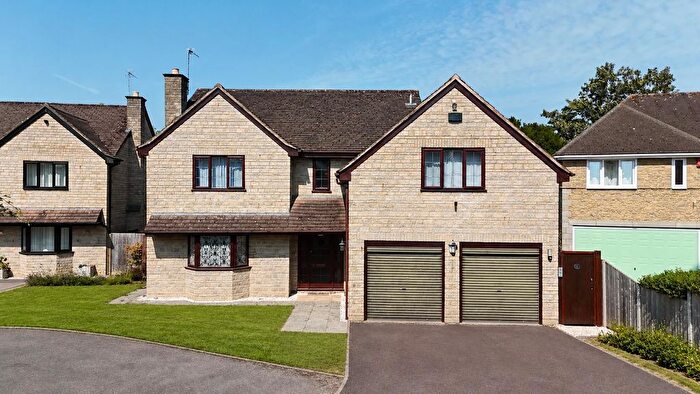
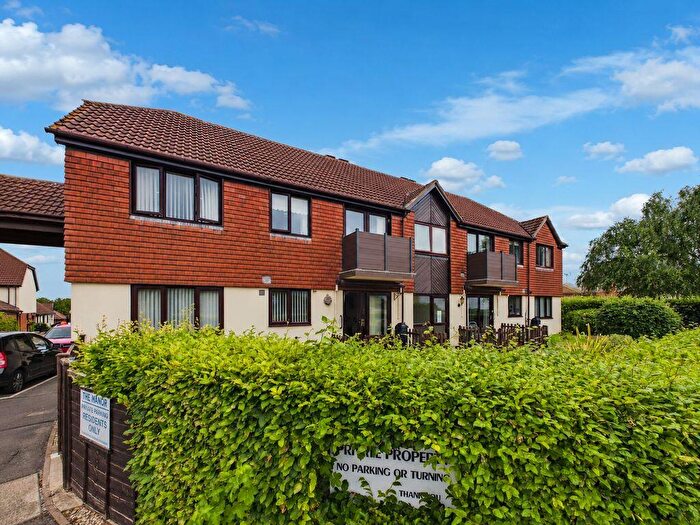
Properties for sale in Gloucester

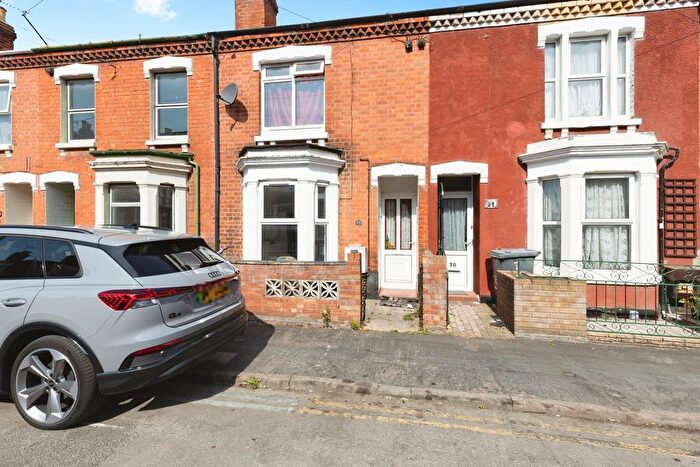
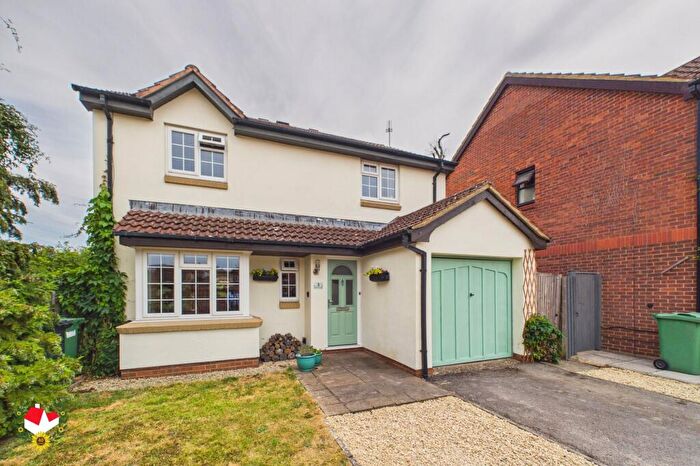
![]()
If you are looking to sell your house, let it out, or receive a property valuation, an expert can help you.
Click the button below to get started.

Neighbourhoods in Gloucester
Navigate through our locations to find the location of your next house in Gloucester, Gloucestershire for sale or to rent.
- Abbey
- Badgeworth
- Barnwood
- Barton And Tredworth
- Brockworth
- Churcham And Huntley
- Churchdown Brookfield
- Churchdown St Johns
- Coaley And Uley
- Coombe Hill
- Elmbridge
- Ermin
- Grange
- Hardwicke
- Hartpury
- Highnam With Haw Bridge
- Hucclecote
- Innsworth With Down Hatherley
- Kingsholm And Wotton
- Longlevens
- Matson And Robinswood
- Moreland
- Newnham And Westbury
- Painswick
- Podsmead
- Quedgeley Fieldcourt
- Quedgeley Severn Vale
- Redmarley
- Severn
- Tewkesbury Town With Mitton
- Tibberton
- Tuffley
- Upton St Leonards
- Westgate
- Newent & Taynton
- Longhope & Huntley
- Hartpury & Redmarley
- Severn Vale North
- Berkeley Vale
- Westbury-on-Severn
- Innsworth
- Severn Vale South
- Churchdown Brookfield with Hucclecote
- Brockworth West
- Brockworth East
- Painswick and Upton
- Coney Hill
- Abbeydale
- Abbeymead
- Kingsway
- Matson, Robinswood And White City
Property price trends in Gloucester
According to the latest Land Registry data, the average home in Gloucester sold for £282,741 in 2026. That figure comes from a substantial record of 105,931 sales logged over the past 31 years.
Prices have moved up over the last three years. Compared with 2023, when the typical sale came in around £278,208, that's a rise of roughly 1.6%.
Looking back five years, average prices are up about 7.7% since 2021, a gain of around £20,132 in cash terms.
Zoom out to the past decade for the fuller picture. Back in 2016, homes here averaged £208,263, so the typical sold price has climbed about 35.8% since then, roughly 3.1% a year. Stretch the view to fifteen years and that annual pace edges up closer to 3.5%.
Frequently asked questions about Gloucester
What is the average price for a property for sale in Gloucester?
The average price for a property for sale in Gloucester is £283,716. This amount is 24% lower than the average price in Gloucestershire. There are more than 10,000 property listings for sale in Gloucester.
What locations have the most expensive properties for sale in Gloucester?
The locations with the most expensive properties for sale in Gloucester are Westbury-on-Severn at an average of £944,000, Painswick at an average of £706,750 and Ermin at an average of £676,502.
What locations have the most affordable properties for sale in Gloucester?
The locations with the most affordable properties for sale in Gloucester are Tewkesbury Town With Mitton at an average of £129,500, Barton And Tredworth at an average of £175,006 and Westgate at an average of £204,999.
Which train stations are available in or near Gloucester?
Some of the train stations available in or near Gloucester are Gloucester, Cheltenham Spa and Stroud.
Property Price Paid in Gloucester by Year
The average sold property price by year was:
| Year | Average Sold Price | Price Change |
Sold Properties
|
|---|---|---|---|
| 2026 | £282,741 | -1% |
187 Properties |
| 2025 | £285,289 | -1% |
2,643 Properties |
| 2024 | £287,398 | 3% |
2,854 Properties |
| 2023 | £278,208 | -1% |
2,630 Properties |
| 2022 | £280,465 | 6% |
3,100 Properties |
| 2021 | £262,609 | 3% |
3,939 Properties |
| 2020 | £254,706 | 7% |
2,918 Properties |
| 2019 | £236,355 | 3% |
3,575 Properties |
| 2018 | £230,083 | 3% |
3,728 Properties |
| 2017 | £222,876 | 7% |
3,747 Properties |
Property Price per Property Type in Gloucester
Here you can find historic sold price data in order to help with your property search.
The average Property Paid Price for specific property types in the last three years are:
| Property Type | Average Sold Price | Sold Properties |
|---|---|---|
| Semi Detached House | £283,737.00 | 2,876 Semi Detached Houses |
| Terraced House | £223,400.00 | 2,355 Terraced Houses |
| Detached House | £448,017.00 | 1,905 Detached Houses |
| Flat | £138,543.00 | 1,178 Flats |
Transport in Gloucester
Please see below transportation links in this area:
