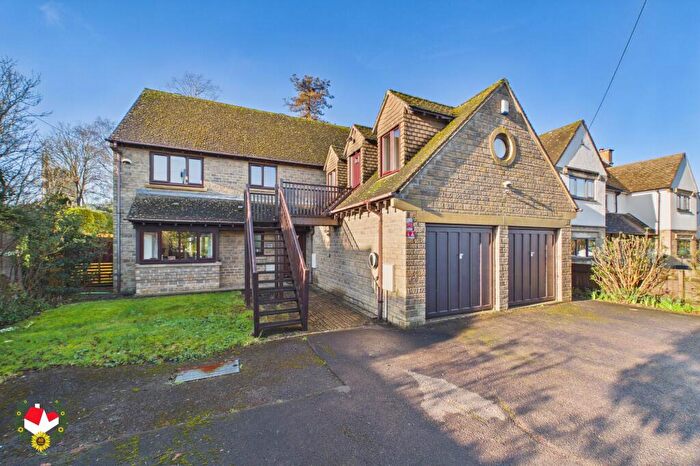
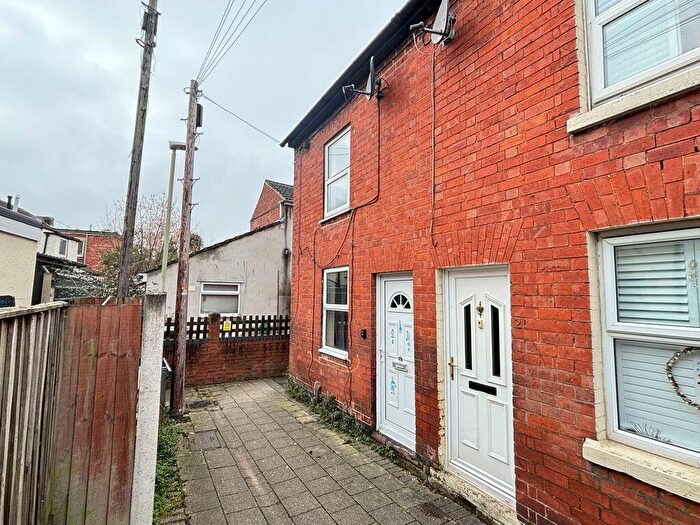
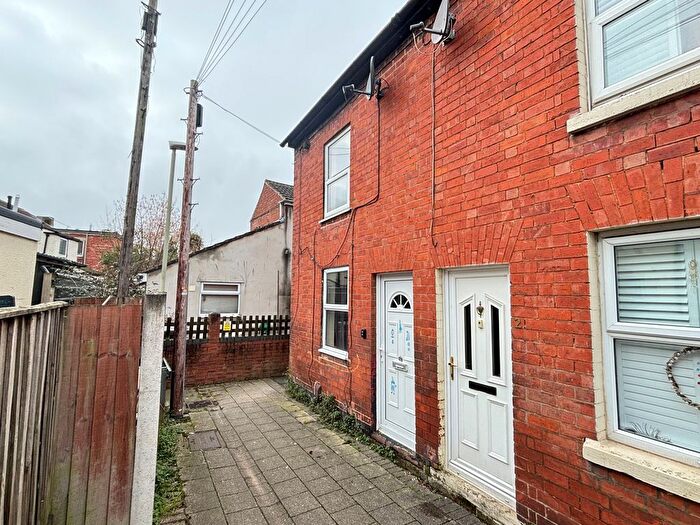
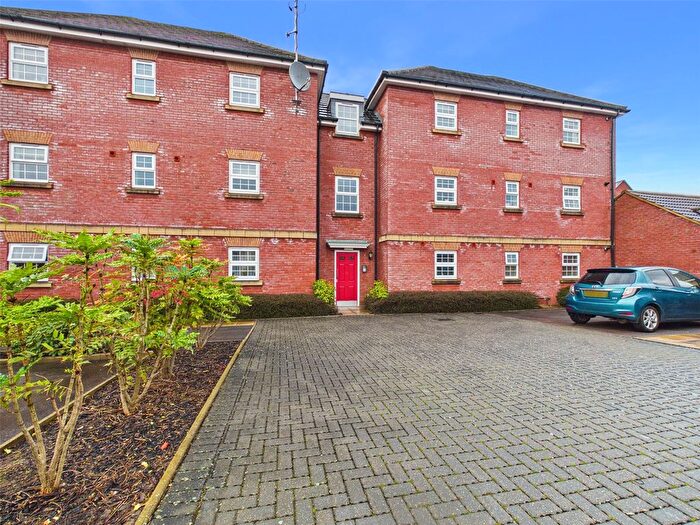
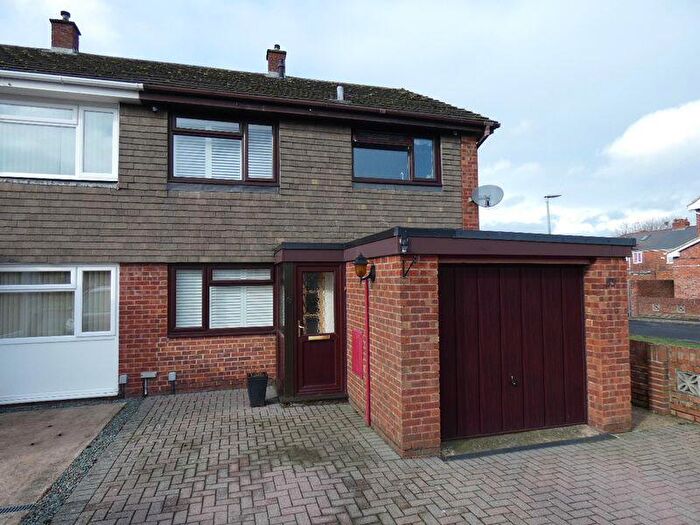
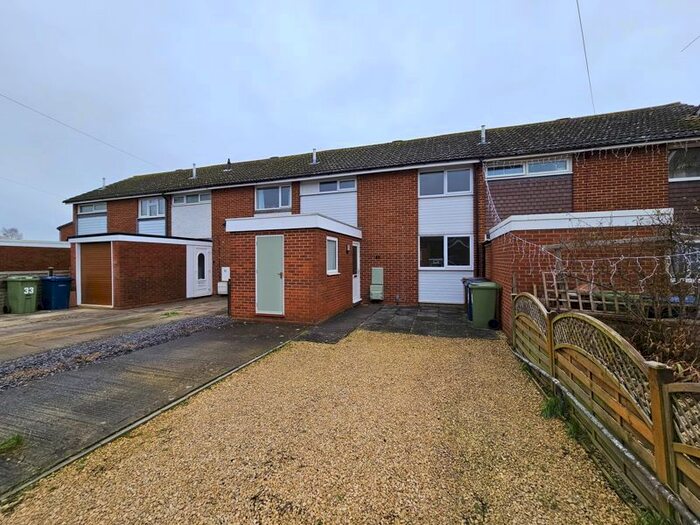
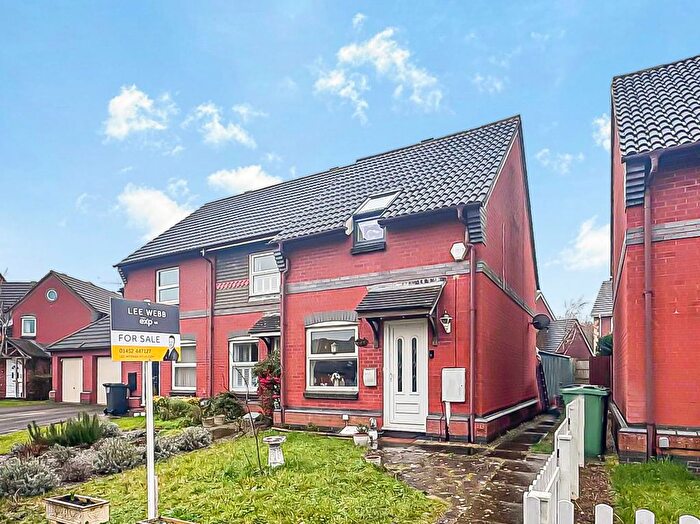
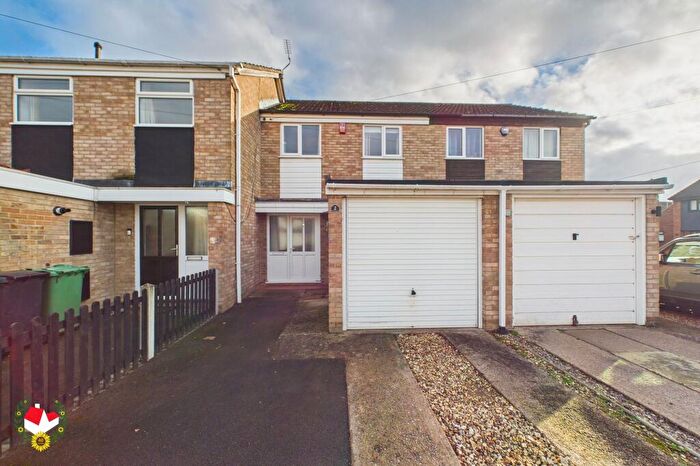
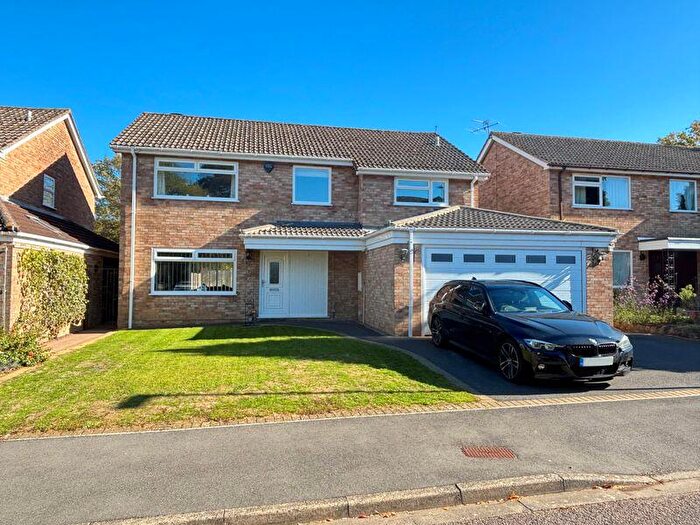
Houses for sale & to rent in Upton St Leonards, Gloucester
House Prices in Upton St Leonards
Properties in Upton St Leonards have an average house price of £408,172.00 and had 139 Property Transactions within the last 3 years¹.
Upton St Leonards is an area in Gloucester, Gloucestershire with 1,114 households², where the most expensive property was sold for £940,000.00.
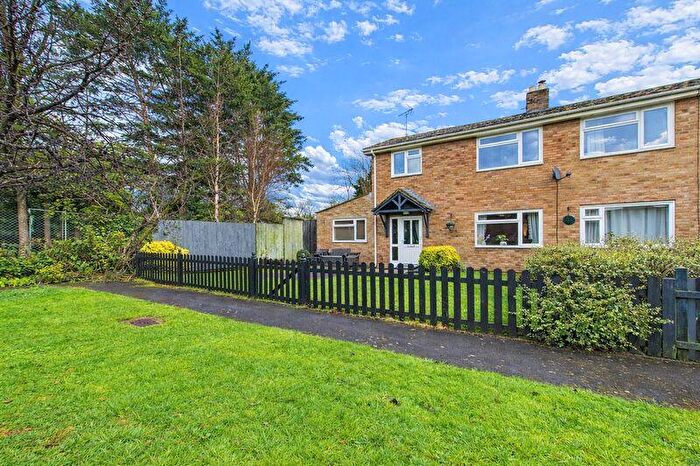
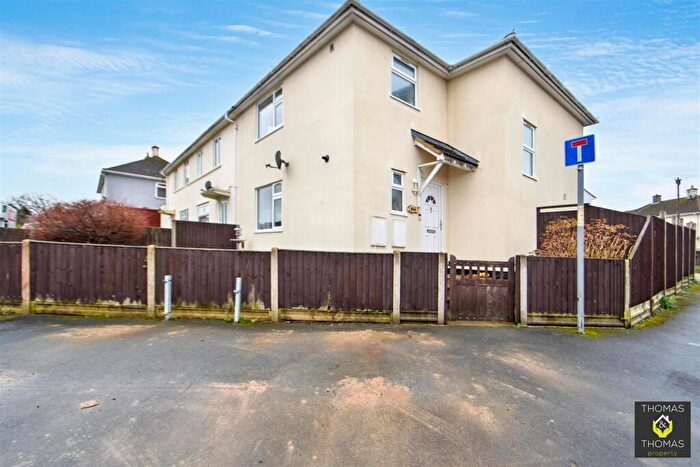
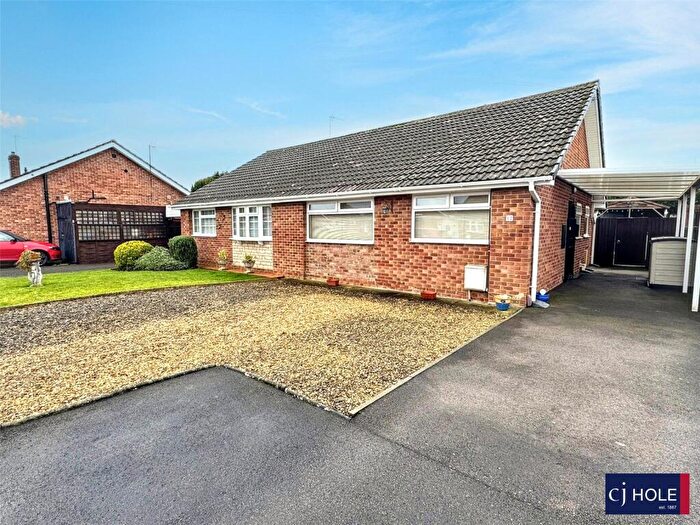
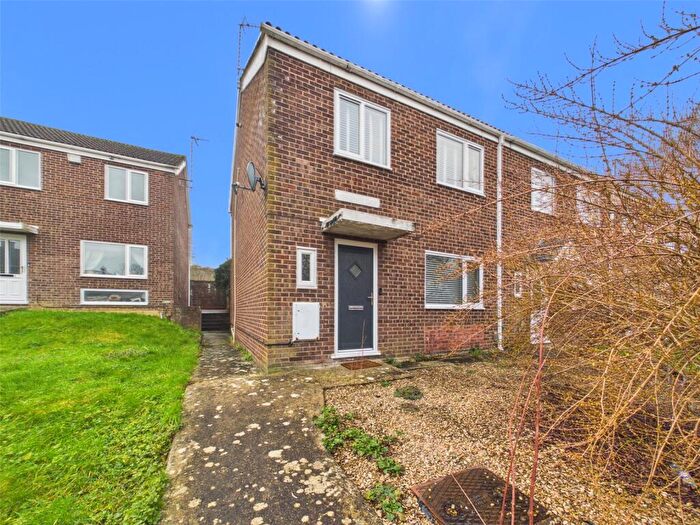
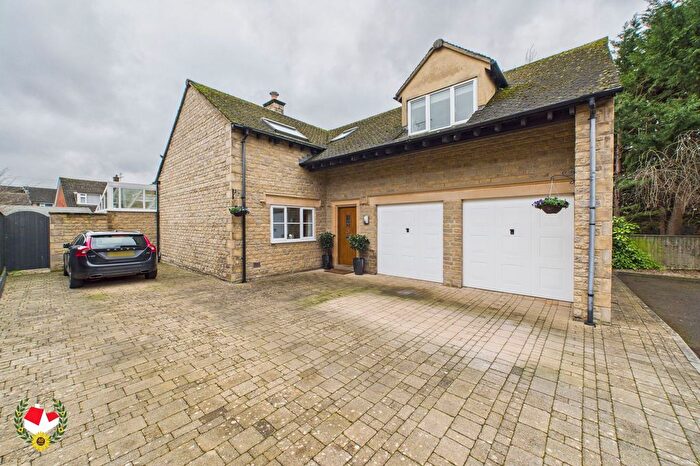
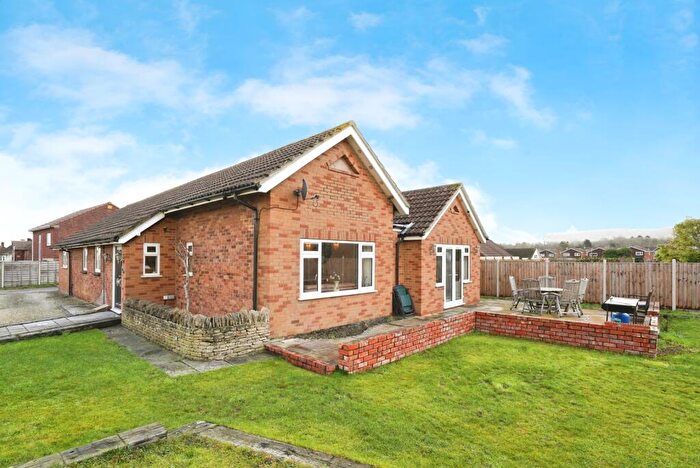
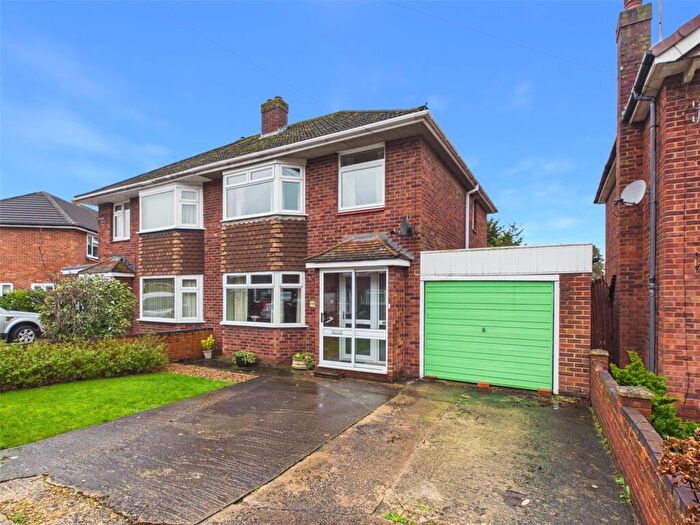
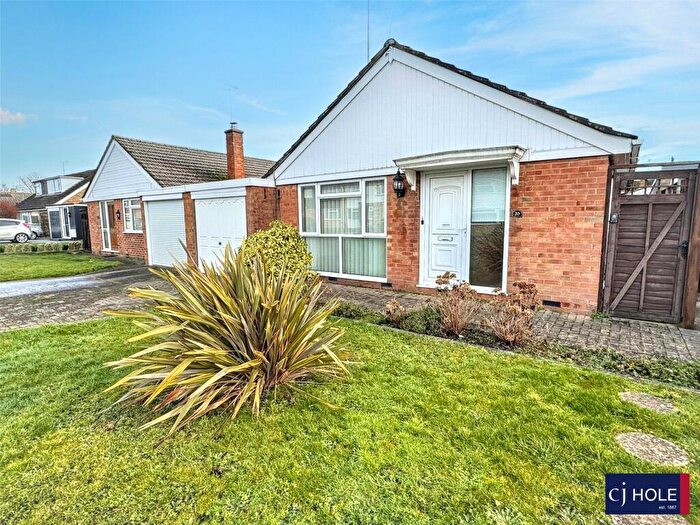
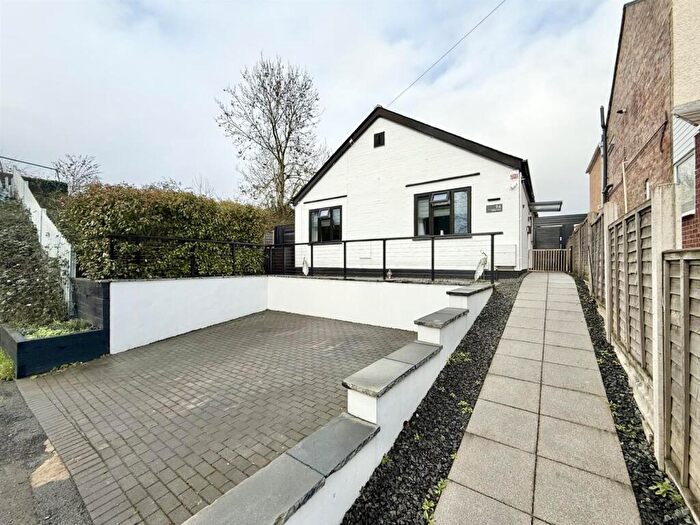
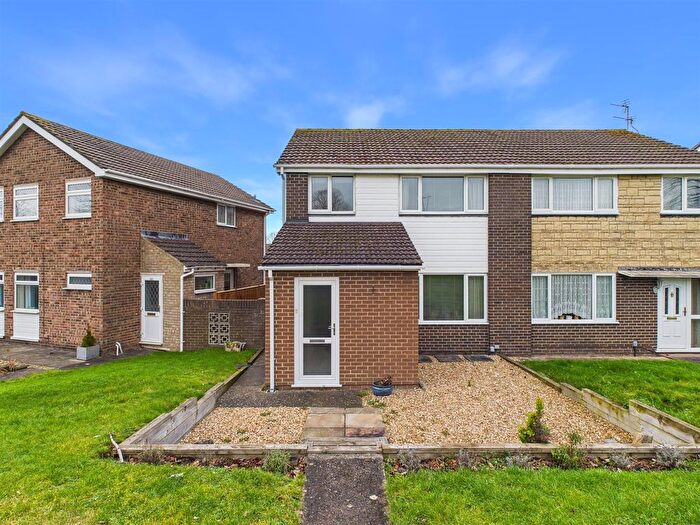
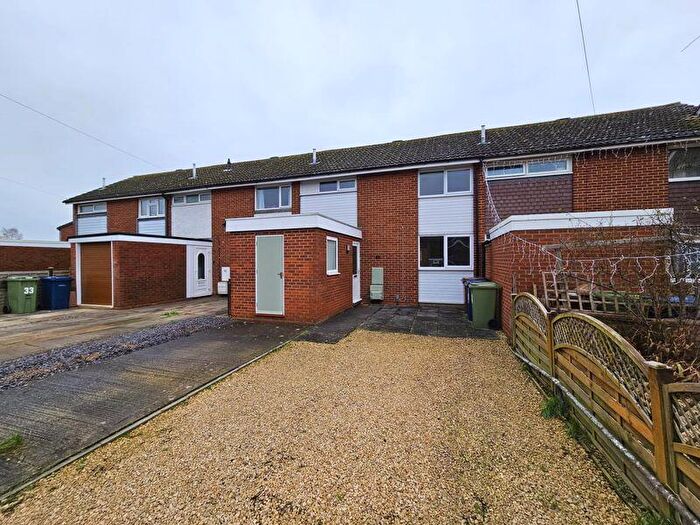
Properties for sale in Upton St Leonards
Roads and Postcodes in Upton St Leonards
Navigate through our locations to find the location of your next house in Upton St Leonards, Gloucester for sale or to rent.
| Streets | Postcodes |
|---|---|
| Ash Grove | GL4 8BH |
| Beamont Walk | GL3 4BL |
| Bondend | GL4 8EG |
| Bondend Lane | GL4 8EJ |
| Bondend Road | GL4 8AG GL4 8AH GL4 8AJ GL4 8DX GL4 8DY GL4 8DZ GL4 8EA GL4 8ED GL4 8EL |
| Cannon Corner | GL3 4FD |
| Carter Close | GL3 4BP |
| Church Lane | GL4 0UE |
| Churchfield Road | GL4 8AN GL4 8AT GL4 8AU GL4 8BA |
| Daunt Road | GL3 4BW |
| Gamecock Close | GL3 4DZ |
| Gauntlet Road | GL3 4EB |
| Gilberts Lane | GL4 0UH |
| Golden Arrow Way | GL3 4ED GL3 4FZ |
| Grange Road | GL4 0UA |
| Haresfield Lane | GL4 0UP |
| High Street | GL4 8DG GL4 8DJ GL4 8DL GL4 8DN |
| Hillmead | GL4 0UL |
| Horsepools Hill | GL4 0UY |
| Lady Downe Close | GL4 8BJ |
| Maitlands | GL4 0XE |
| Martyn Close | GL3 4GN |
| Merlin Close | GL3 4GA |
| Moorend Cottages | GL4 8DW |
| Naas Lane | GL4 0XA |
| North View | GL4 0UJ |
| Nuthill | GL3 4RL GL4 8EB |
| Painswick Road | GL3 4RX GL4 8ET |
| Perry Orchard | GL4 8AQ GL4 8DH GL4 8DQ GL4 8EH |
| Pinlocks | GL4 8AR |
| Portway | GL4 8DP GL4 8DS |
| Prinknash | GL4 8EU |
| Rance Lane | GL4 8AB |
| Rance Pitch | GL4 8AD GL4 8AE |
| Rectory Close | GL4 8BB |
| Regent Close | GL3 4GP |
| Sapphire Way | GL3 4FB |
| Six Acres | GL4 8AX GL4 8AY |
| St Leonards Close | GL4 8AL |
| Staites Orchard | GL4 8BG |
| Stanley Walk | GL4 8DT |
| Stroud Road | GL4 0UB GL4 0UQ GL4 0US GL4 0UU |
| Styles Lane | GL4 0XF |
| The Ash Path | GL4 8AS GL4 8AW |
| The Stanley | GL4 8DU |
| Twyver Bank | GL4 8EN |
| Twyver Close | GL4 8EF |
| Typhoon Way | GL3 4BQ GL3 4DX GL3 4DY |
| Upton Hill | GL4 8DA GL4 8DB GL4 8DD GL4 8DE GL4 8DF |
| Upton Lane | GL4 0UT GL4 8EQ |
| Valley Cottages | GL4 8DR |
| Whornes Orchard | GL4 8EE |
| Woodland Green | GL4 8BD GL4 8BE |
| Wynstones Drive | GL4 0UN |
| Zura Avenue | GL3 4BN |
| GL4 0XD |
Transport near Upton St Leonards
- FAQ
- Price Paid By Year
- Property Type Price
Frequently asked questions about Upton St Leonards
What is the average price for a property for sale in Upton St Leonards?
The average price for a property for sale in Upton St Leonards is £408,172. This amount is 44% higher than the average price in Gloucester. There are 5,381 property listings for sale in Upton St Leonards.
What streets have the most expensive properties for sale in Upton St Leonards?
The streets with the most expensive properties for sale in Upton St Leonards are Nuthill at an average of £850,000, Bondend Lane at an average of £793,750 and Bondend Road at an average of £610,600.
What streets have the most affordable properties for sale in Upton St Leonards?
The streets with the most affordable properties for sale in Upton St Leonards are Daunt Road at an average of £152,000, Beamont Walk at an average of £183,000 and Zura Avenue at an average of £186,250.
Which train stations are available in or near Upton St Leonards?
Some of the train stations available in or near Upton St Leonards are Gloucester, Stroud and Cheltenham Spa.
Property Price Paid in Upton St Leonards by Year
The average sold property price by year was:
| Year | Average Sold Price | Price Change |
Sold Properties
|
|---|---|---|---|
| 2025 | £410,950 | -3% |
40 Properties |
| 2024 | £424,700 | 9% |
51 Properties |
| 2023 | £388,296 | -3% |
48 Properties |
| 2022 | £401,236 | 15% |
46 Properties |
| 2021 | £342,814 | 12% |
65 Properties |
| 2020 | £301,707 | -20% |
41 Properties |
| 2019 | £363,172 | 32% |
58 Properties |
| 2018 | £245,423 | -31% |
54 Properties |
| 2017 | £321,181 | 14% |
73 Properties |
| 2016 | £274,781 | 12% |
58 Properties |
| 2015 | £242,620 | -6% |
74 Properties |
| 2014 | £257,611 | 7% |
88 Properties |
| 2013 | £238,436 | 5% |
52 Properties |
| 2012 | £227,141 | 14% |
37 Properties |
| 2011 | £195,296 | -24% |
53 Properties |
| 2010 | £242,768 | 15% |
60 Properties |
| 2009 | £206,351 | 11% |
53 Properties |
| 2008 | £184,384 | -19% |
78 Properties |
| 2007 | £220,296 | -24% |
91 Properties |
| 2006 | £272,861 | -5% |
26 Properties |
| 2005 | £287,691 | 17% |
18 Properties |
| 2004 | £240,116 | 2% |
38 Properties |
| 2003 | £235,015 | 10% |
31 Properties |
| 2002 | £212,008 | 19% |
33 Properties |
| 2001 | £172,325 | -8% |
36 Properties |
| 2000 | £186,320 | 18% |
20 Properties |
| 1999 | £151,858 | 25% |
36 Properties |
| 1998 | £113,459 | -2% |
31 Properties |
| 1997 | £115,188 | 5% |
34 Properties |
| 1996 | £109,188 | 23% |
21 Properties |
| 1995 | £84,365 | - |
24 Properties |
Property Price per Property Type in Upton St Leonards
Here you can find historic sold price data in order to help with your property search.
The average Property Paid Price for specific property types in the last three years are:
| Property Type | Average Sold Price | Sold Properties |
|---|---|---|
| Semi Detached House | £390,175.00 | 20 Semi Detached Houses |
| Detached House | £536,161.00 | 65 Detached Houses |
| Terraced House | £292,404.00 | 42 Terraced Houses |
| Flat | £150,083.00 | 12 Flats |

