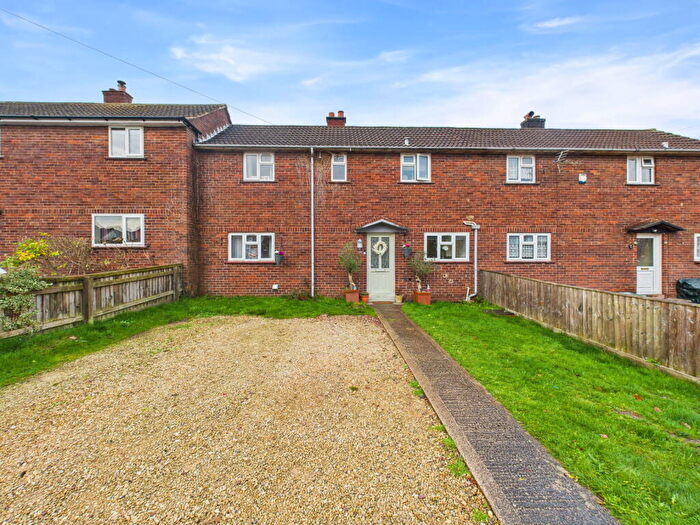
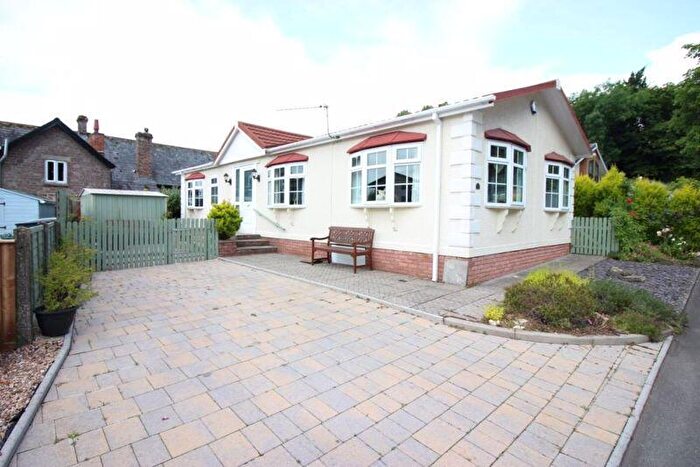
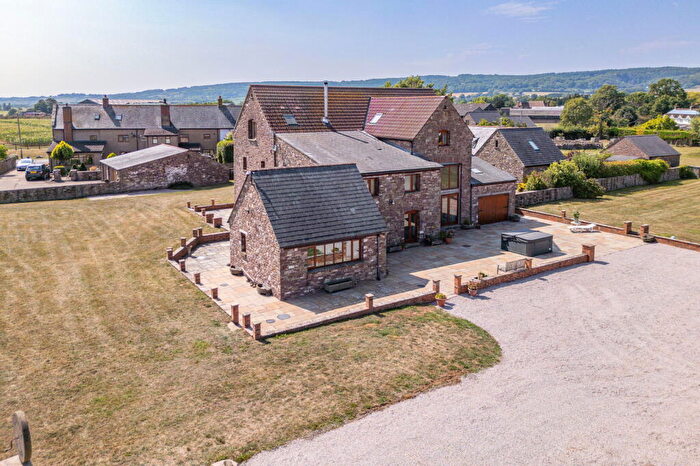
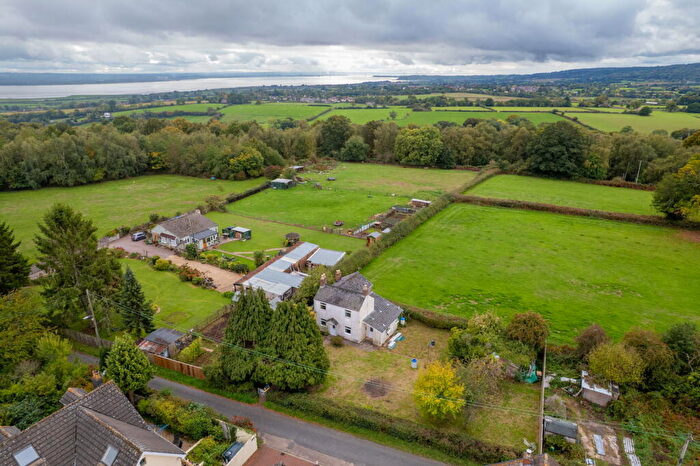
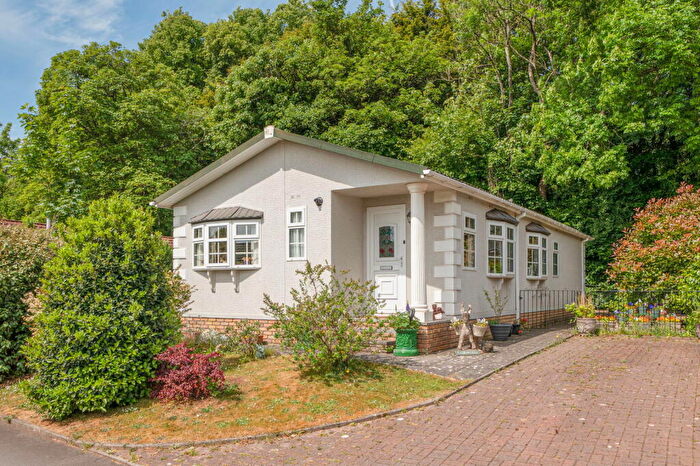
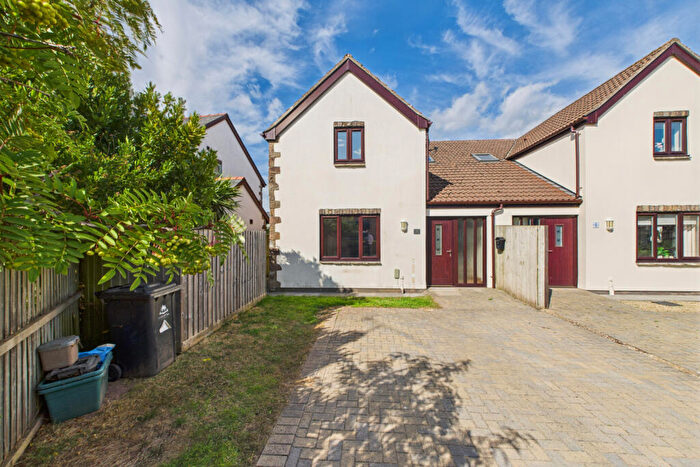
Houses for sale & to rent in Hewelsfield And Woolaston, Lydney
House Prices in Hewelsfield And Woolaston
Properties in Hewelsfield And Woolaston have an average house price of £435,536.00 and had 41 Property Transactions within the last 3 years¹.
Hewelsfield And Woolaston is an area in Lydney, Gloucestershire with 569 households², where the most expensive property was sold for £780,000.00.
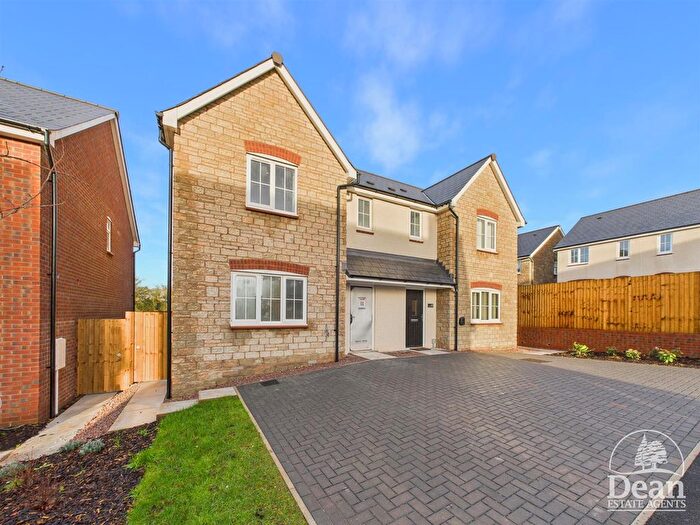
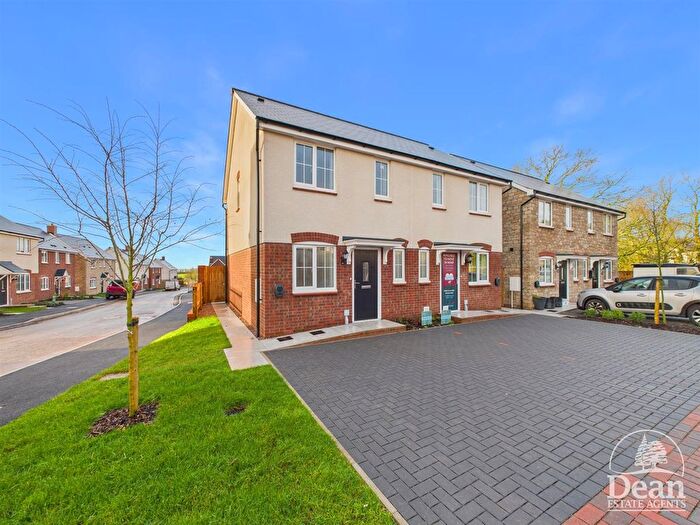
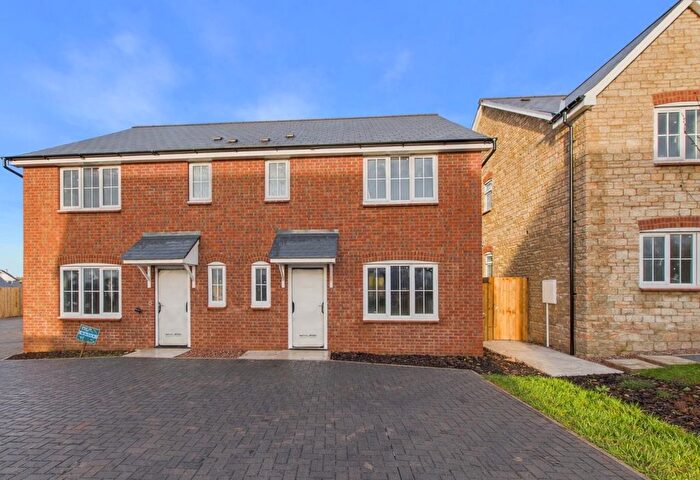
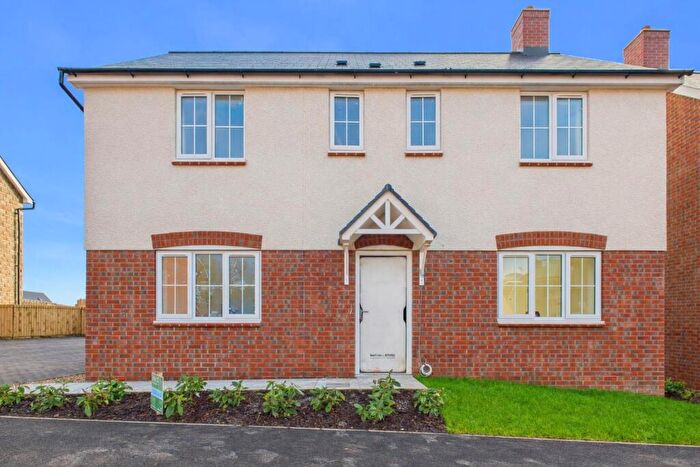
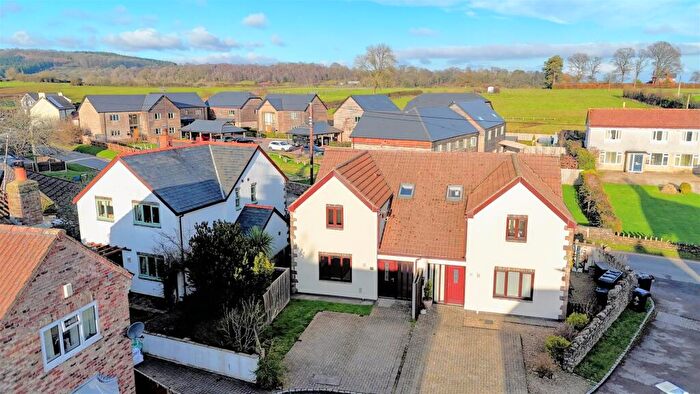
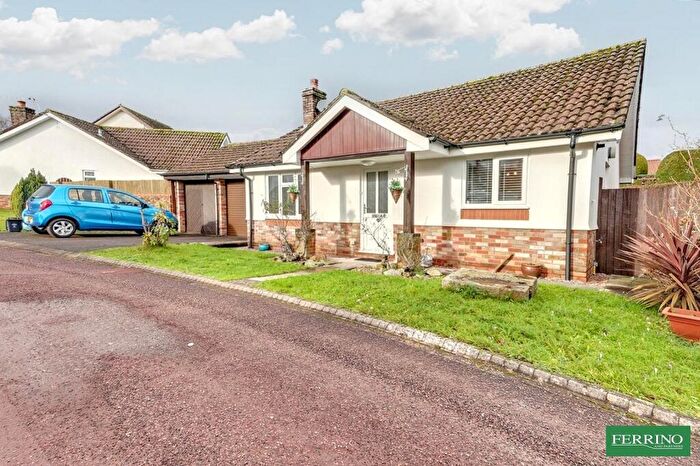
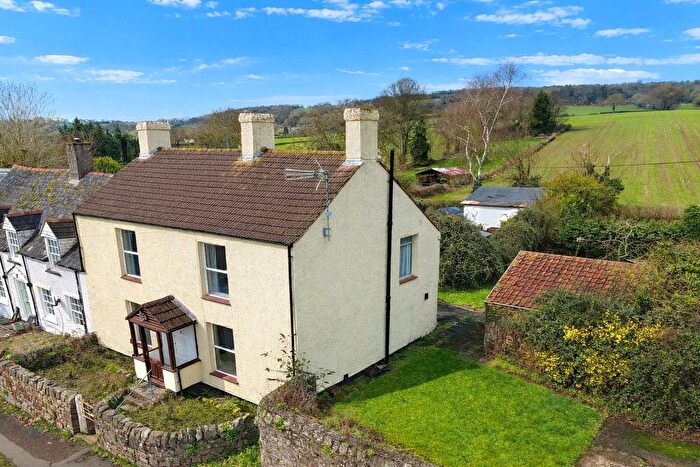
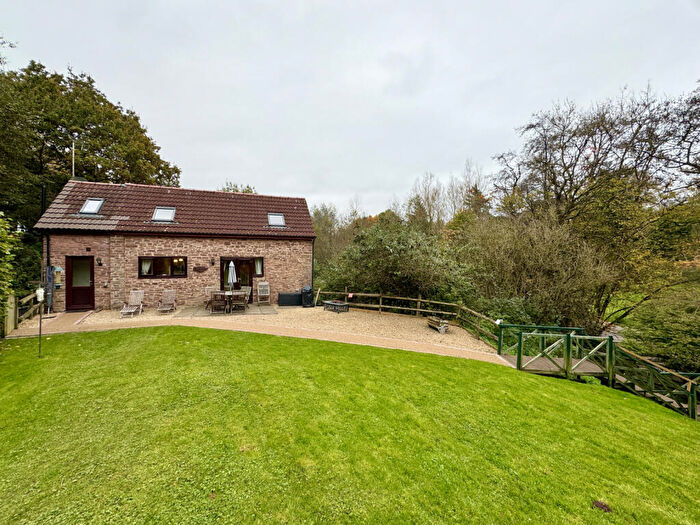
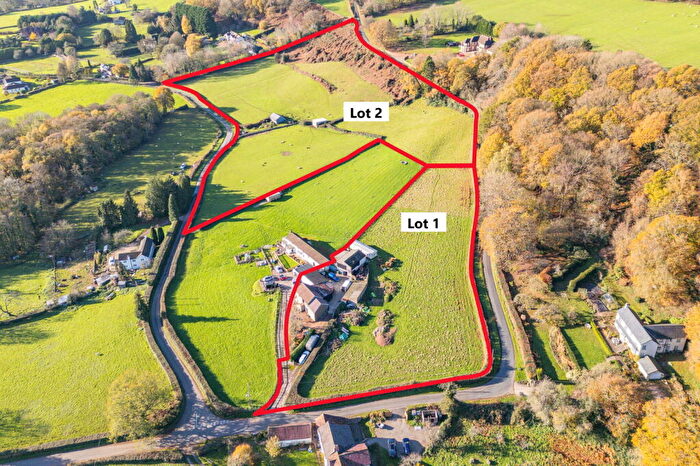
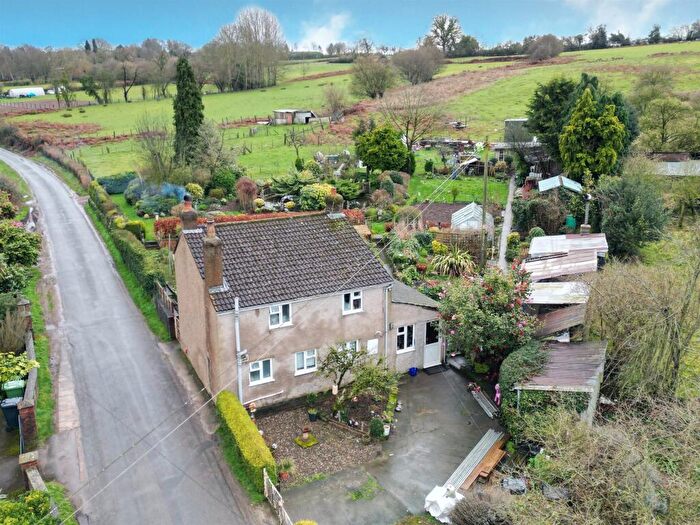
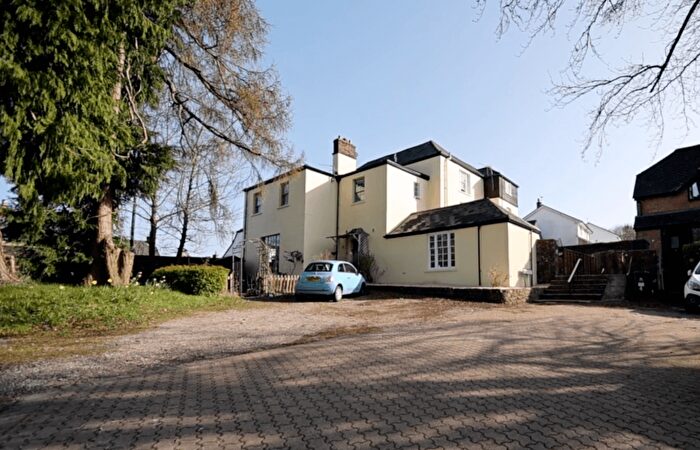
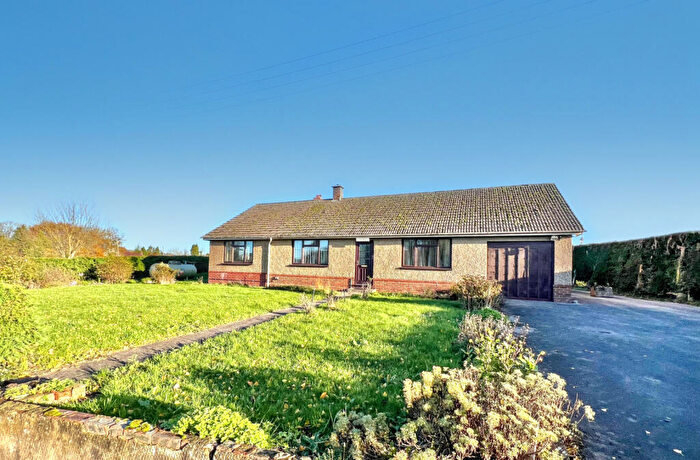
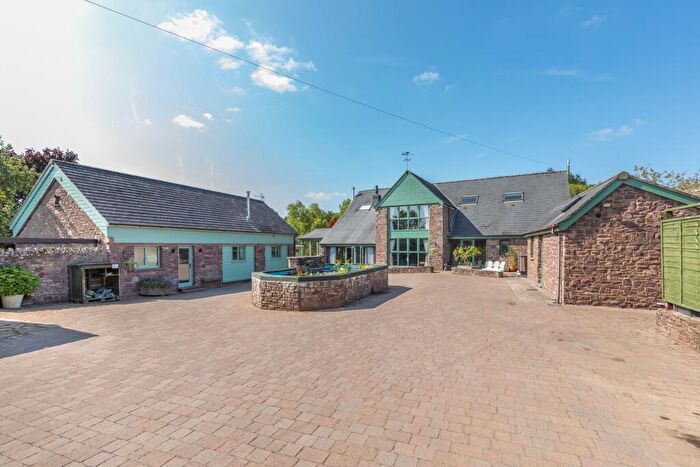
Properties for sale in Hewelsfield And Woolaston
Roads and Postcodes in Hewelsfield And Woolaston
Navigate through our locations to find the location of your next house in Hewelsfield And Woolaston, Lydney for sale or to rent.
| Streets | Postcodes |
|---|---|
| Ash Way | GL15 6QA |
| Bailey Lane | GL15 6XD GL15 6XE |
| Barnage Road | GL15 6AQ |
| Belmont Road | GL15 6UX |
| Birchwood Road | GL15 6PE |
| Brookend | GL15 6PW |
| Cone Valley | GL15 6AD |
| Elm Court | GL15 6PG |
| Follet Close | GL15 6UN |
| High Woolaston | GL15 6PX |
| Kerrin Lane | GL15 6PL |
| Main Road | GL15 6PJ |
| Netherend | GL15 6NL GL15 6NN GL15 6NS GL15 6PH |
| Netherend Crescent | GL15 6NW |
| Oak Crescent | GL15 6PF |
| Park Hill | GL15 6PU |
| Perry Field | GL15 6QD |
| Pine Dale | GL15 6PQ |
| Reddings Close | GL15 6NR |
| Ring Fence | GL15 6NX |
| Severn View Road | GL15 6NP |
| Station Road | GL15 6PN |
| Swains Field | GL15 6SU |
| Sycamore Cottages | GL15 6UR |
| The Common | GL15 6NT GL15 6NU GL15 6NY |
| The Orchards | GL15 6NQ |
| The Post Paddocks | GL15 6NJ |
| Woodside | GL15 6PA GL15 6PB GL15 6PS |
| Woolaston Common | GL15 6NZ |
| Woolaston Grange | GL15 6PP |
| GL15 6PR GL15 6TY GL15 6UH GL15 6UJ GL15 6UL GL15 6UQ GL15 6US GL15 6UT GL15 6UU GL15 6UW GL15 6UZ GL15 6XA GL15 6XB GL15 6XF |
Transport near Hewelsfield And Woolaston
-
Lydney Station
-
Chepstow Station
-
Pilning Station
-
Severn Beach Station
-
Caldicot Station
-
Cam and Dursley Station
-
Severn Tunnel Junction Station
-
Patchway Station
-
Bristol Parkway Station
-
Yate Station
- FAQ
- Price Paid By Year
- Property Type Price
Frequently asked questions about Hewelsfield And Woolaston
What is the average price for a property for sale in Hewelsfield And Woolaston?
The average price for a property for sale in Hewelsfield And Woolaston is £435,536. This amount is 49% higher than the average price in Lydney. There are 290 property listings for sale in Hewelsfield And Woolaston.
What streets have the most expensive properties for sale in Hewelsfield And Woolaston?
The streets with the most expensive properties for sale in Hewelsfield And Woolaston are High Woolaston at an average of £635,000, Station Road at an average of £625,000 and The Common at an average of £590,000.
What streets have the most affordable properties for sale in Hewelsfield And Woolaston?
The streets with the most affordable properties for sale in Hewelsfield And Woolaston are Oak Crescent at an average of £230,000, Severn View Road at an average of £268,333 and Elm Court at an average of £278,000.
Which train stations are available in or near Hewelsfield And Woolaston?
Some of the train stations available in or near Hewelsfield And Woolaston are Lydney, Chepstow and Pilning.
Property Price Paid in Hewelsfield And Woolaston by Year
The average sold property price by year was:
| Year | Average Sold Price | Price Change |
Sold Properties
|
|---|---|---|---|
| 2025 | £457,142 | -2% |
14 Properties |
| 2024 | £464,366 | 19% |
15 Properties |
| 2023 | £374,291 | -24% |
12 Properties |
| 2022 | £464,437 | 9% |
16 Properties |
| 2021 | £422,293 | 3% |
15 Properties |
| 2020 | £409,624 | -3% |
20 Properties |
| 2019 | £423,139 | -6% |
14 Properties |
| 2018 | £449,833 | 14% |
15 Properties |
| 2017 | £388,114 | 17% |
17 Properties |
| 2016 | £322,700 | 6% |
12 Properties |
| 2015 | £303,900 | -2% |
25 Properties |
| 2014 | £309,882 | 5% |
26 Properties |
| 2013 | £295,128 | 12% |
23 Properties |
| 2012 | £259,192 | 18% |
13 Properties |
| 2011 | £211,949 | -72% |
11 Properties |
| 2010 | £364,342 | 17% |
19 Properties |
| 2009 | £303,361 | -12% |
18 Properties |
| 2008 | £339,704 | 13% |
12 Properties |
| 2007 | £293,884 | -13% |
16 Properties |
| 2006 | £330,687 | 9% |
16 Properties |
| 2005 | £302,300 | 29% |
10 Properties |
| 2004 | £213,662 | -25% |
12 Properties |
| 2003 | £266,980 | 24% |
25 Properties |
| 2002 | £202,622 | 3% |
24 Properties |
| 2001 | £196,852 | 33% |
17 Properties |
| 2000 | £131,498 | -4% |
28 Properties |
| 1999 | £137,285 | 8% |
28 Properties |
| 1998 | £126,654 | 18% |
23 Properties |
| 1997 | £104,064 | 18% |
30 Properties |
| 1996 | £85,035 | 4% |
27 Properties |
| 1995 | £81,816 | - |
21 Properties |
Property Price per Property Type in Hewelsfield And Woolaston
Here you can find historic sold price data in order to help with your property search.
The average Property Paid Price for specific property types in the last three years are:
| Property Type | Average Sold Price | Sold Properties |
|---|---|---|
| Semi Detached House | £254,125.00 | 4 Semi Detached Houses |
| Detached House | £461,402.00 | 36 Detached Houses |
| Terraced House | £230,000.00 | 1 Terraced House |

