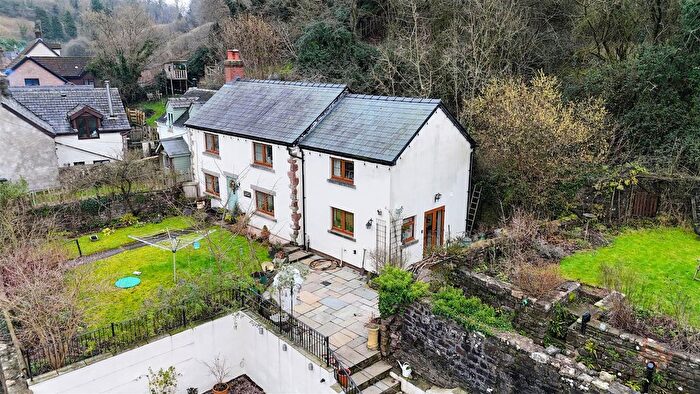
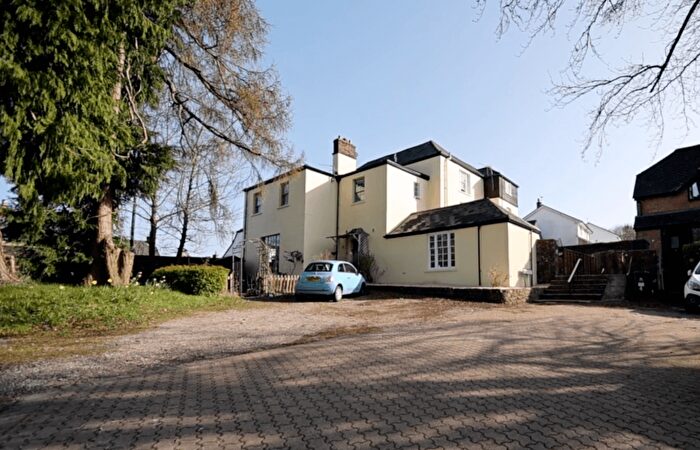
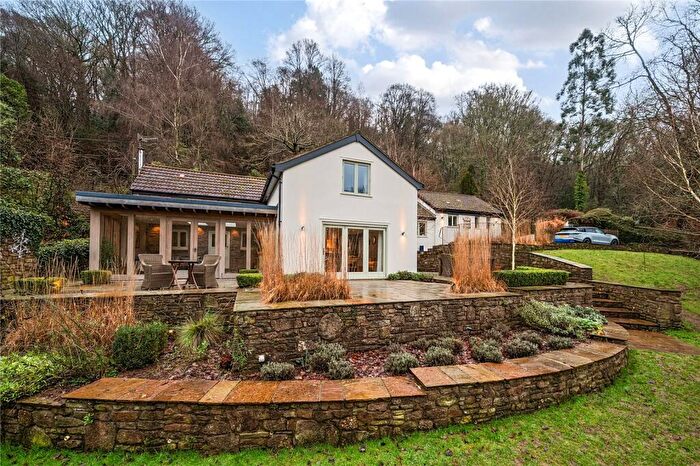
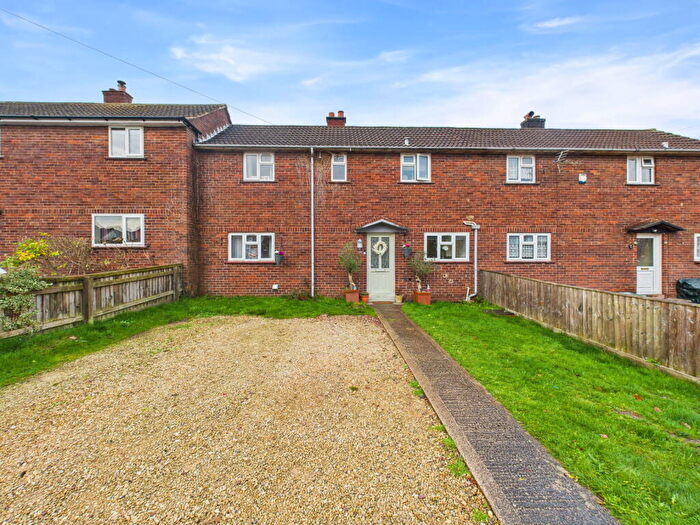
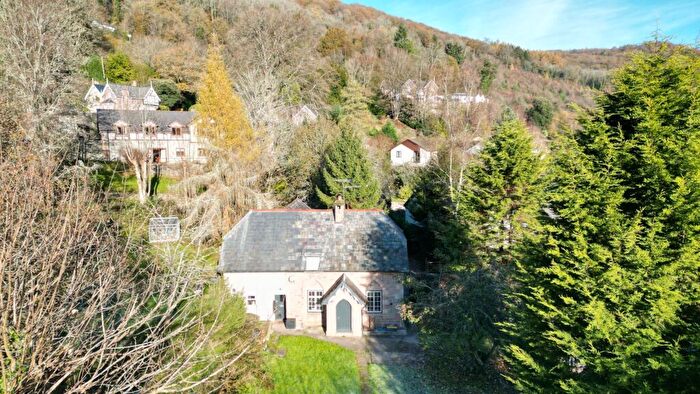
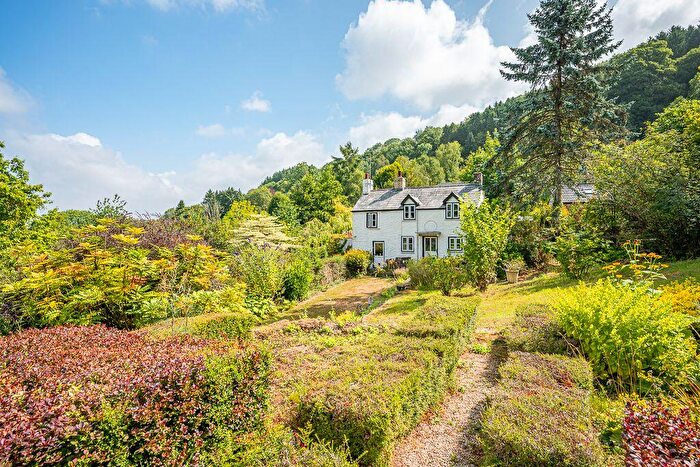
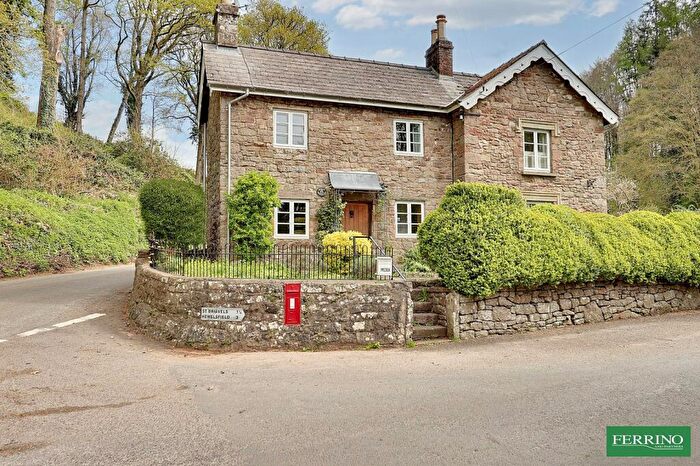
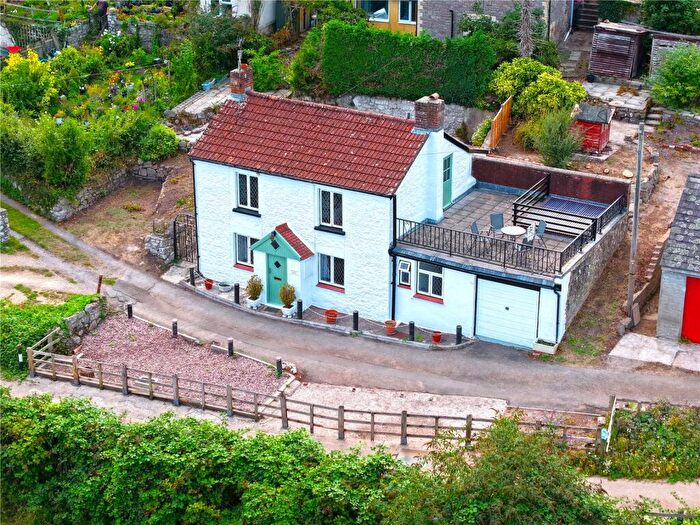
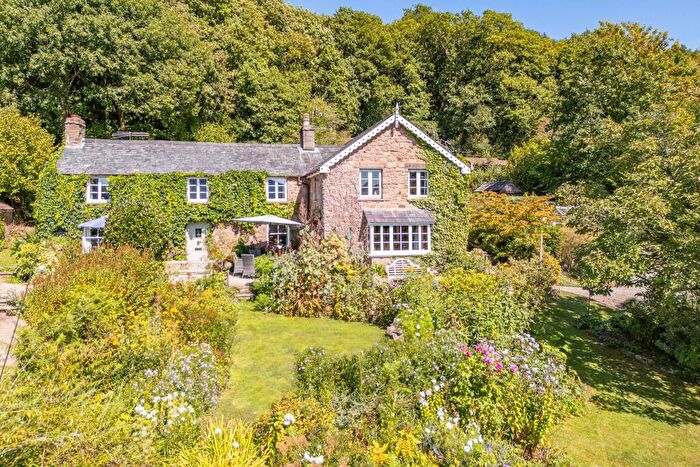
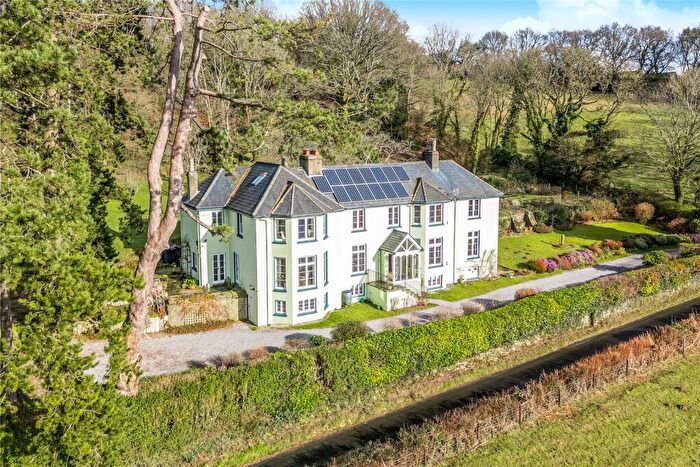
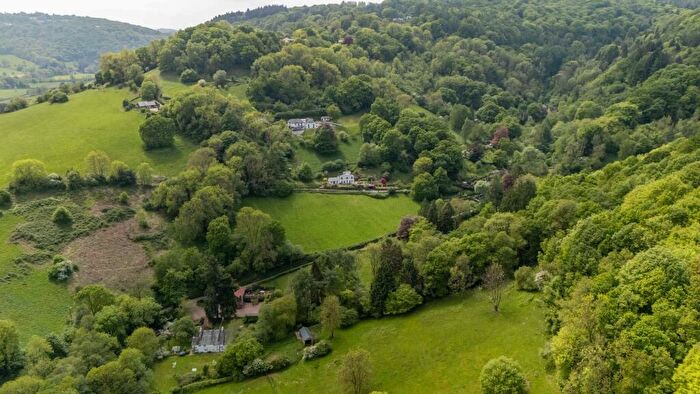
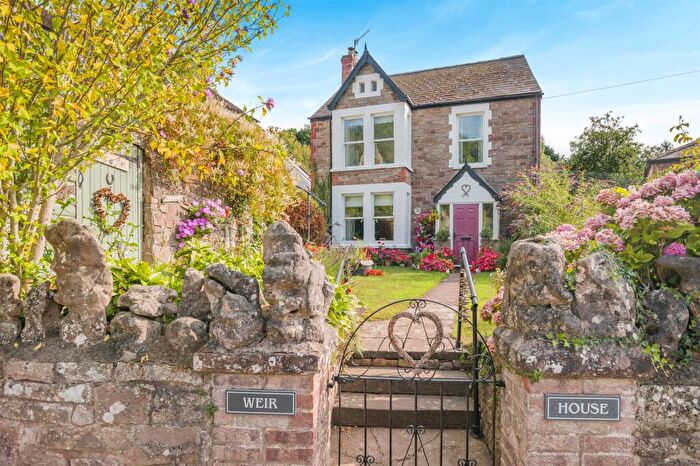
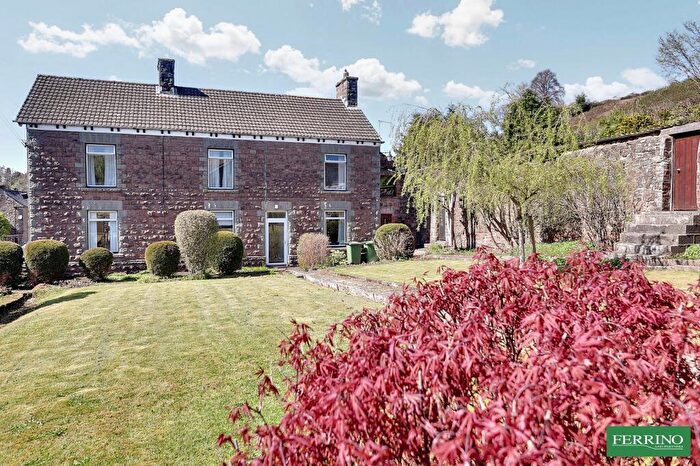
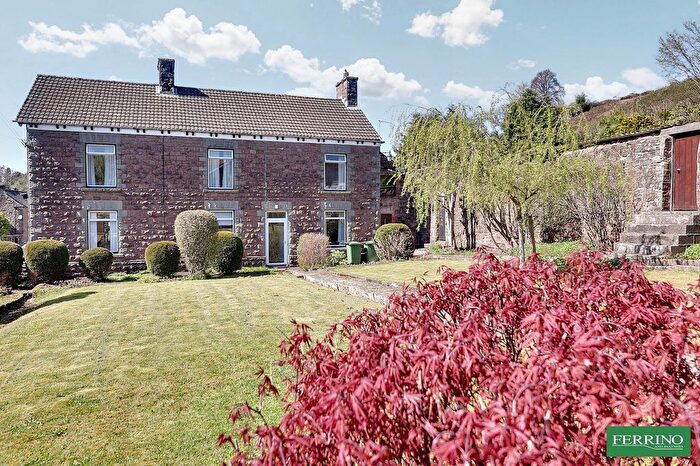
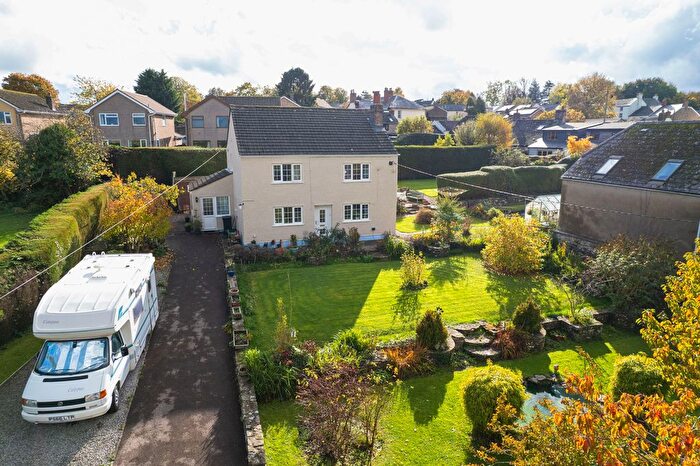
Houses for sale & to rent in Newland And St Briavels, Lydney
House Prices in Newland And St Briavels
Properties in Newland And St Briavels have an average house price of £429,000.00 and had 21 Property Transactions within the last 3 years¹.
Newland And St Briavels is an area in Lydney, Gloucestershire with 448 households², where the most expensive property was sold for £808,000.00.
Properties for sale in Newland And St Briavels
Previously listed properties in Newland And St Briavels
Roads and Postcodes in Newland And St Briavels
Navigate through our locations to find the location of your next house in Newland And St Briavels, Lydney for sale or to rent.
| Streets | Postcodes |
|---|---|
| Barrowell Lane | GL15 6TP |
| Bearse Common | GL15 6QS GL15 6QU |
| Bream Road | GL15 6TL |
| Castle Crescent | GL15 6UA |
| Church Street | GL15 6RG |
| Cockshoot Hill | GL15 6RL |
| Cold Harbour | GL15 6SB GL15 6SD |
| Coleford Road | GL15 6TW |
| Coxbury Lane | GL15 6QJ |
| Cross Keys | GL15 6TH |
| East Street | GL15 6TF GL15 6TQ |
| Hewelsfield Lane | GL15 6TR |
| High Street | GL15 6TA GL15 6TB GL15 6TD |
| Lower Cinderhill | GL15 6QF |
| Lower Meend | GL15 6RJ GL15 6RN GL15 6RW |
| Lower Road | GL15 6SA |
| Mork | GL15 6QH |
| Parawell Lane | GL15 6EX |
| Park Close | GL15 6UD |
| Park Lane | GL15 6QX |
| Pool Cottage Lane | GL15 6SR |
| Pystol Lane | GL15 6TE |
| Smithville Close | GL15 6TN |
| St Annes Way | GL15 6UE |
| St Bruels Close | GL15 6UB |
| Stowe Green | GL15 6QW |
| The Common | GL15 6SF GL15 6SG GL15 6SH GL15 6SJ GL15 6SL GL15 6SP GL15 6SQ GL15 6SW |
| The Fence | GL15 6QG |
| The Hudnalls | GL15 6RT |
| Townsend Close | GL15 6TJ |
| Trowgreen | GL15 6QP |
| GL15 6QE GL15 6QY GL15 6RA GL15 6SE GL15 6TS |
Transport near Newland And St Briavels
-
Lydney Station
-
Chepstow Station
-
Caldicot Station
-
Severn Tunnel Junction Station
-
Cam and Dursley Station
-
Severn Beach Station
-
Pilning Station
-
Patchway Station
- FAQ
- Price Paid By Year
- Property Type Price
Frequently asked questions about Newland And St Briavels
What is the average price for a property for sale in Newland And St Briavels?
The average price for a property for sale in Newland And St Briavels is £429,000. This amount is 47% higher than the average price in Lydney. There are 158 property listings for sale in Newland And St Briavels.
What streets have the most expensive properties for sale in Newland And St Briavels?
The streets with the most expensive properties for sale in Newland And St Briavels are Bream Road at an average of £808,000, Church Street at an average of £800,000 and Coleford Road at an average of £780,000.
What streets have the most affordable properties for sale in Newland And St Briavels?
The streets with the most affordable properties for sale in Newland And St Briavels are Smithville Close at an average of £222,250, Cross Keys at an average of £226,250 and Barrowell Lane at an average of £294,250.
Which train stations are available in or near Newland And St Briavels?
Some of the train stations available in or near Newland And St Briavels are Lydney, Chepstow and Caldicot.
Property Price Paid in Newland And St Briavels by Year
The average sold property price by year was:
| Year | Average Sold Price | Price Change |
Sold Properties
|
|---|---|---|---|
| 2025 | £339,666 | -53% |
6 Properties |
| 2024 | £520,650 | 32% |
10 Properties |
| 2023 | £352,900 | -20% |
5 Properties |
| 2022 | £424,750 | 10% |
12 Properties |
| 2021 | £381,235 | 16% |
17 Properties |
| 2020 | £320,750 | -2% |
18 Properties |
| 2019 | £326,768 | -18% |
11 Properties |
| 2018 | £386,876 | 25% |
15 Properties |
| 2017 | £291,928 | 26% |
14 Properties |
| 2016 | £216,455 | -36% |
17 Properties |
| 2015 | £294,555 | 9% |
17 Properties |
| 2014 | £266,719 | 1% |
18 Properties |
| 2013 | £264,583 | 18% |
18 Properties |
| 2012 | £216,445 | -57% |
10 Properties |
| 2011 | £339,407 | 19% |
13 Properties |
| 2010 | £273,333 | 2% |
6 Properties |
| 2009 | £267,026 | -16% |
17 Properties |
| 2008 | £308,437 | -14% |
12 Properties |
| 2007 | £350,161 | 15% |
18 Properties |
| 2006 | £296,422 | 1% |
20 Properties |
| 2005 | £294,250 | 28% |
16 Properties |
| 2004 | £210,390 | -19% |
17 Properties |
| 2003 | £249,773 | 31% |
26 Properties |
| 2002 | £173,125 | 17% |
20 Properties |
| 2001 | £144,323 | 16% |
20 Properties |
| 2000 | £121,233 | 12% |
15 Properties |
| 1999 | £106,210 | -8% |
19 Properties |
| 1998 | £114,625 | 0,2% |
18 Properties |
| 1997 | £114,372 | 13% |
22 Properties |
| 1996 | £99,439 | 36% |
24 Properties |
| 1995 | £63,545 | - |
11 Properties |
Property Price per Property Type in Newland And St Briavels
Here you can find historic sold price data in order to help with your property search.
The average Property Paid Price for specific property types in the last three years are:
| Property Type | Average Sold Price | Sold Properties |
|---|---|---|
| Semi Detached House | £263,000.00 | 4 Semi Detached Houses |
| Detached House | £482,312.00 | 16 Detached Houses |
| Terraced House | £240,000.00 | 1 Terraced House |

