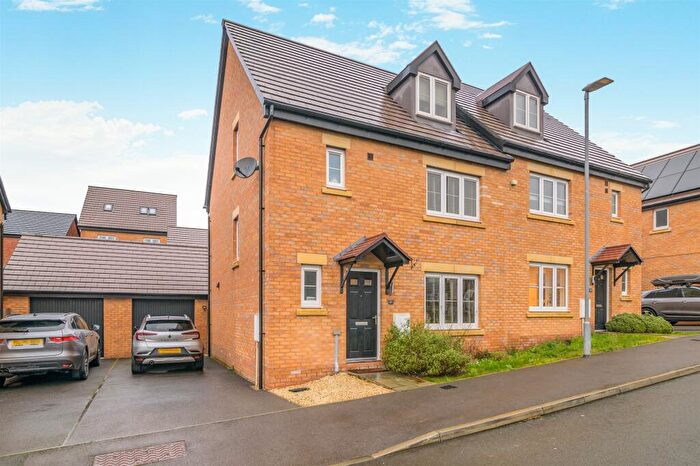
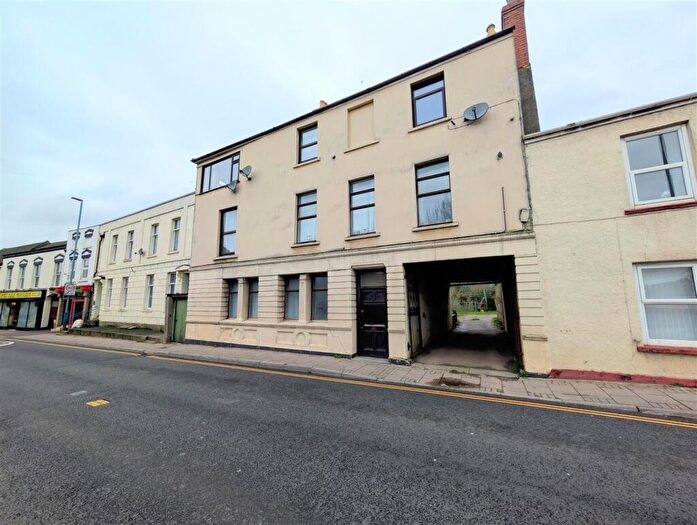
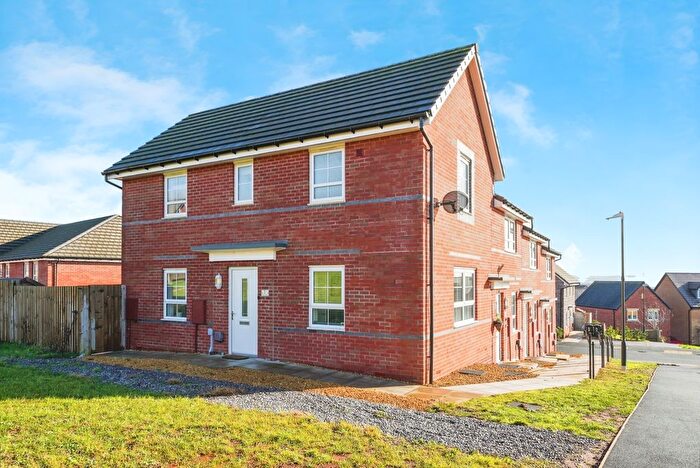
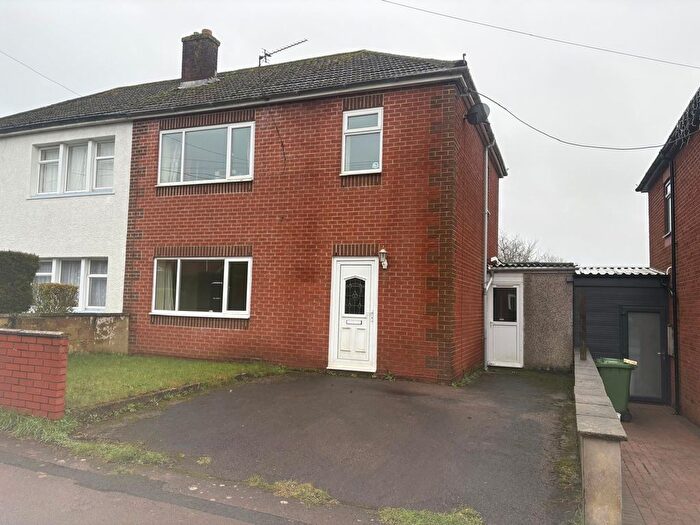
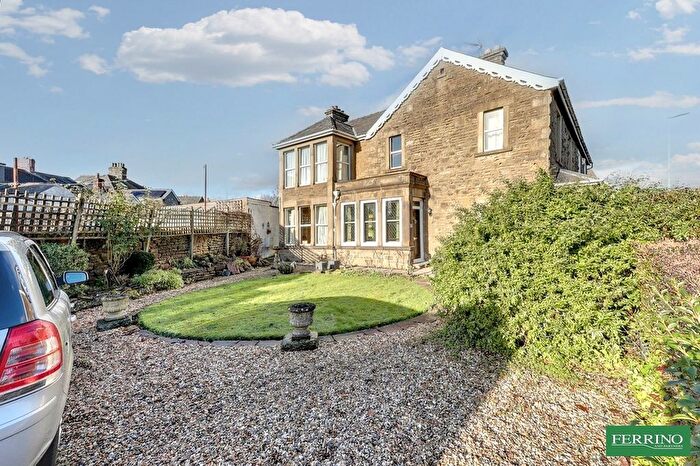
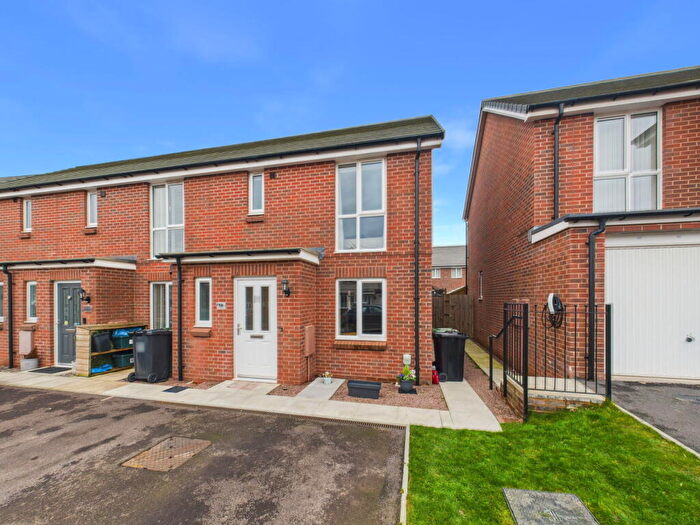
Houses for sale & to rent in Lydney East, Lydney
House Prices in Lydney East
Properties in Lydney East have an average house price of £233,115.00 and had 307 Property Transactions within the last 3 years¹.
Lydney East is an area in Lydney, Gloucestershire with 2,108 households², where the most expensive property was sold for £545,000.00.
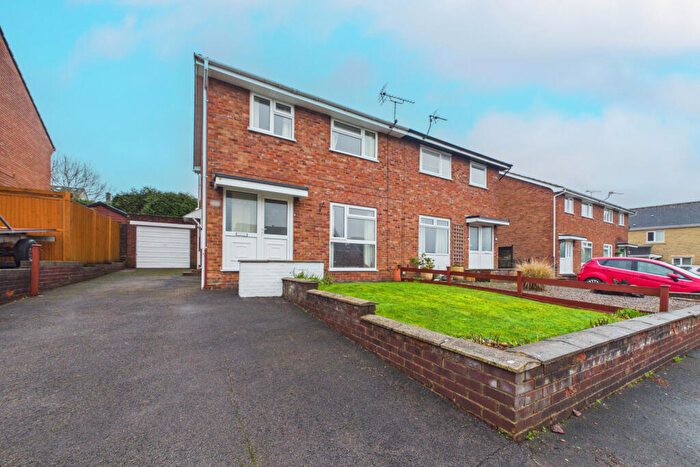
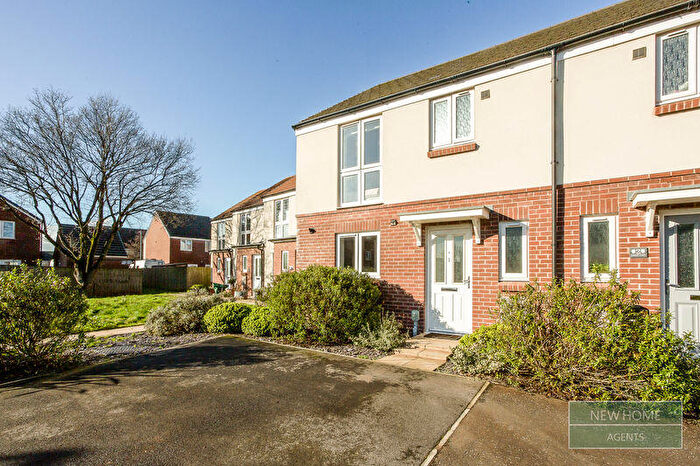
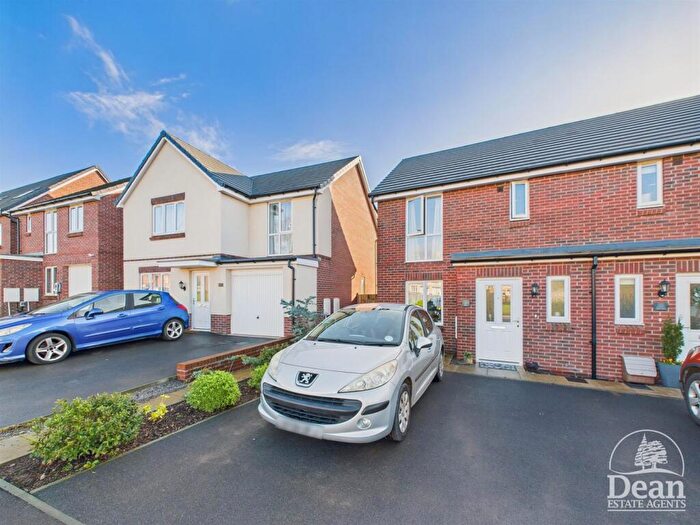
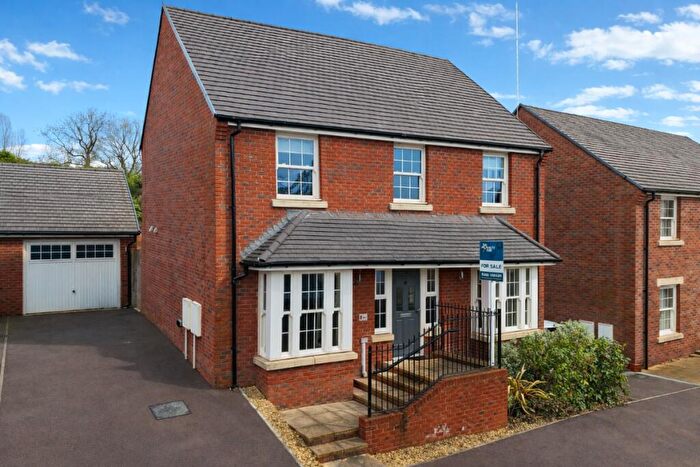
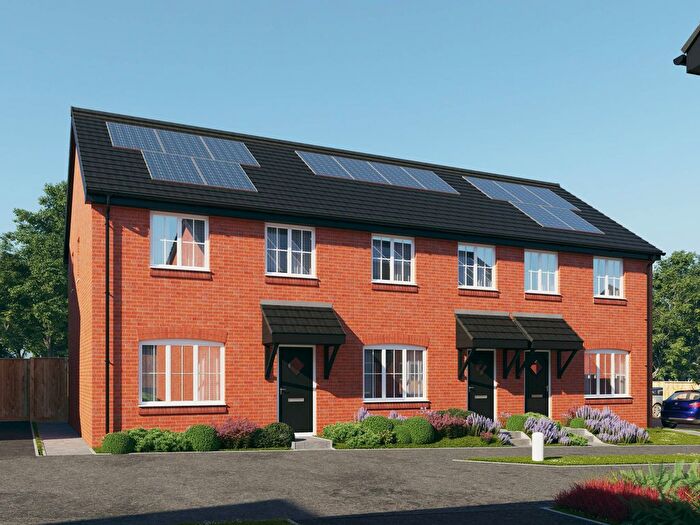
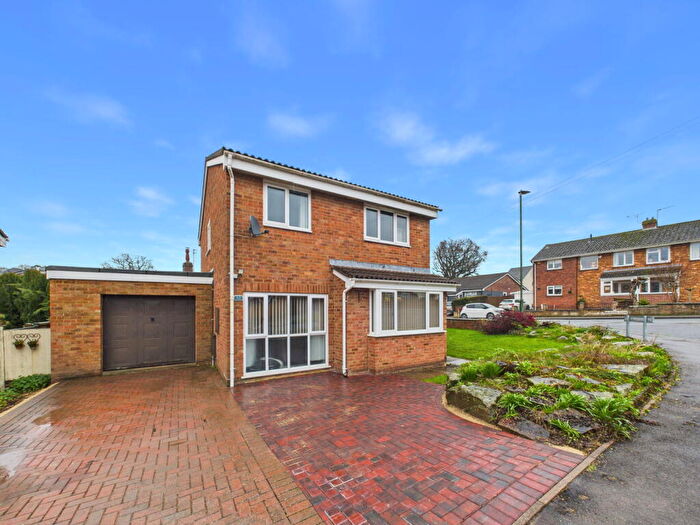
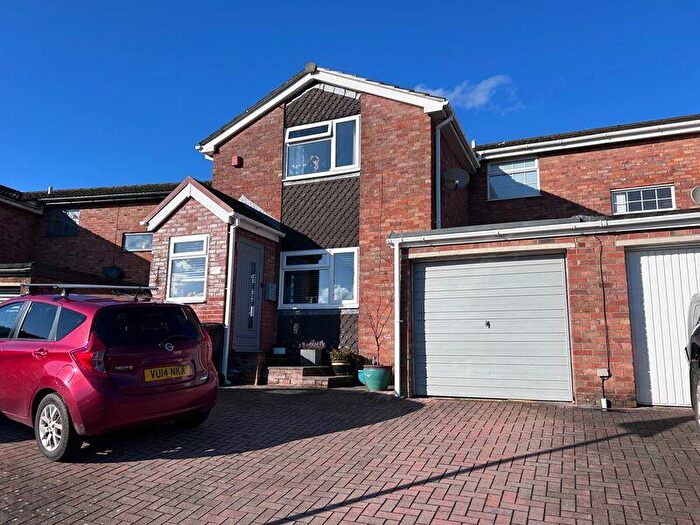
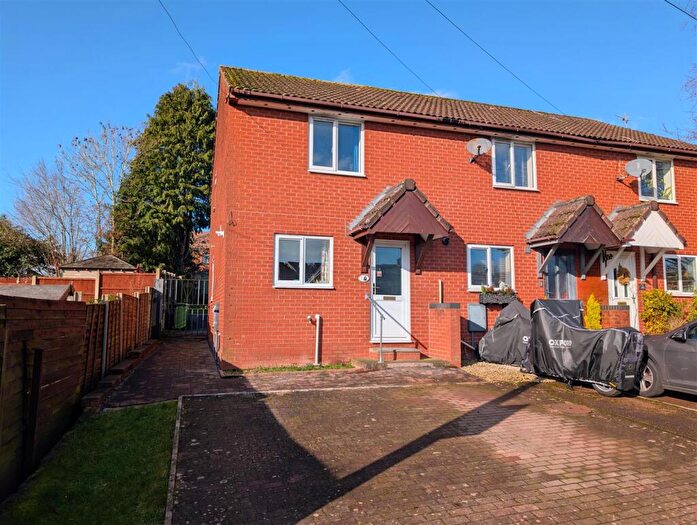
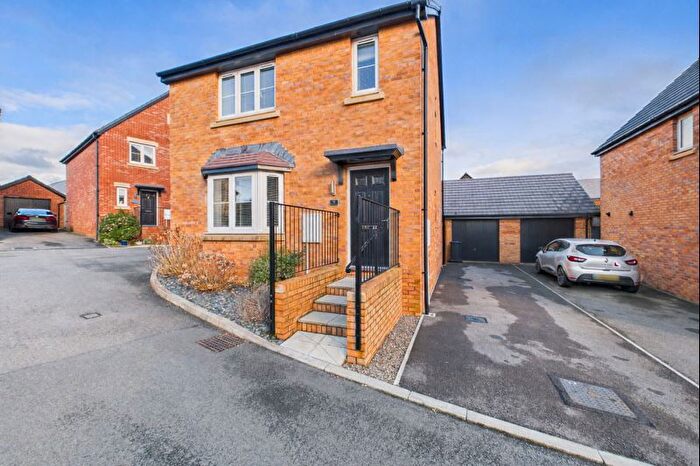
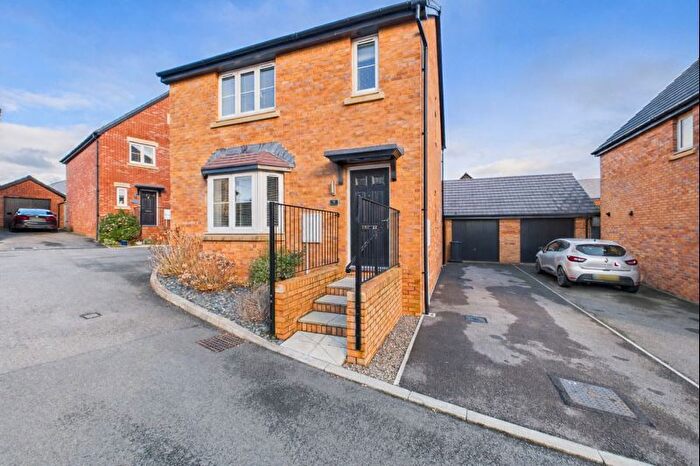
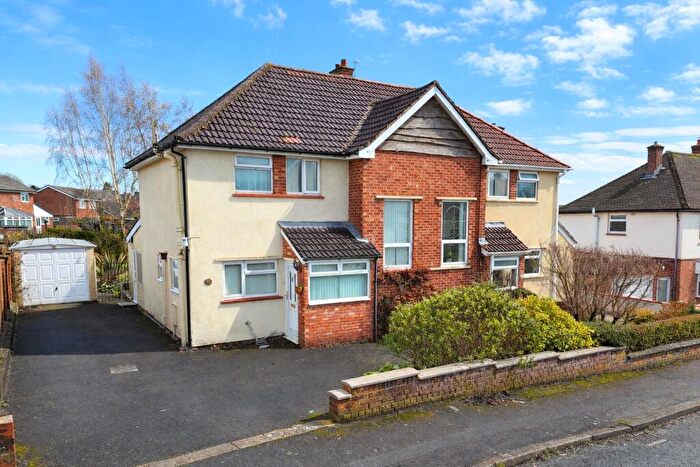
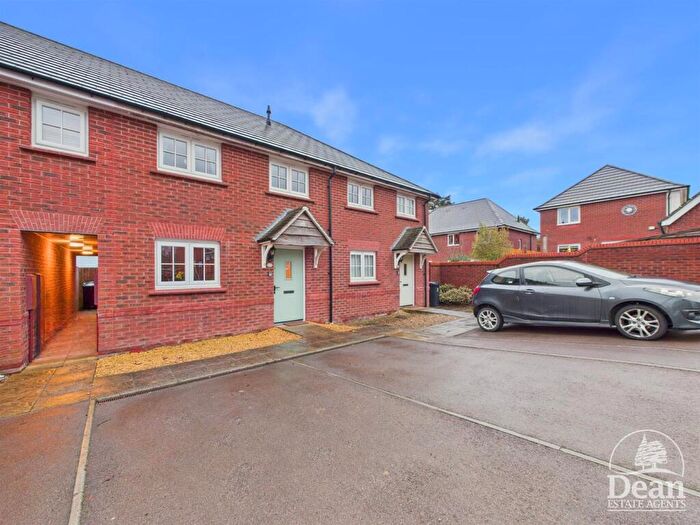
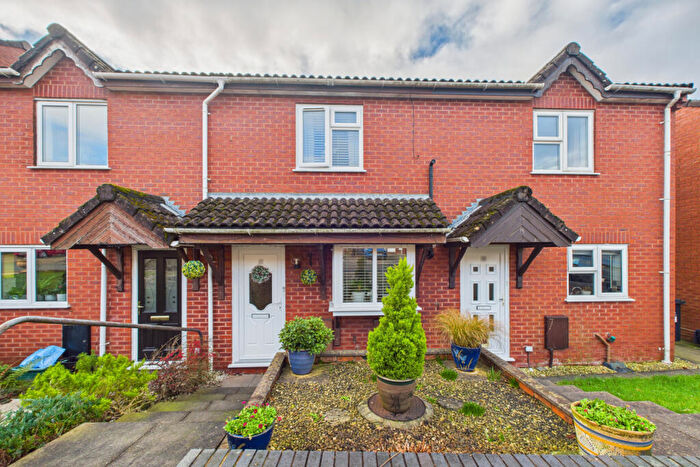
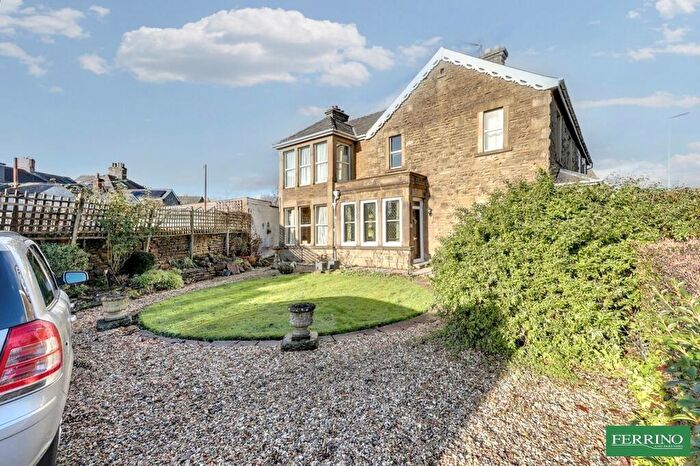
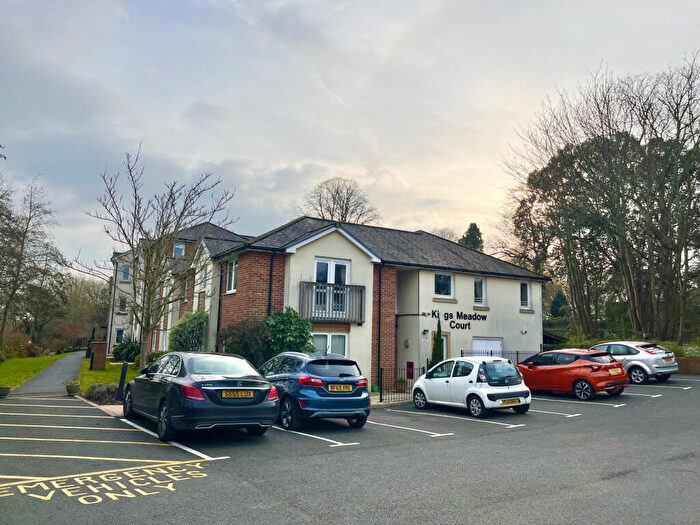
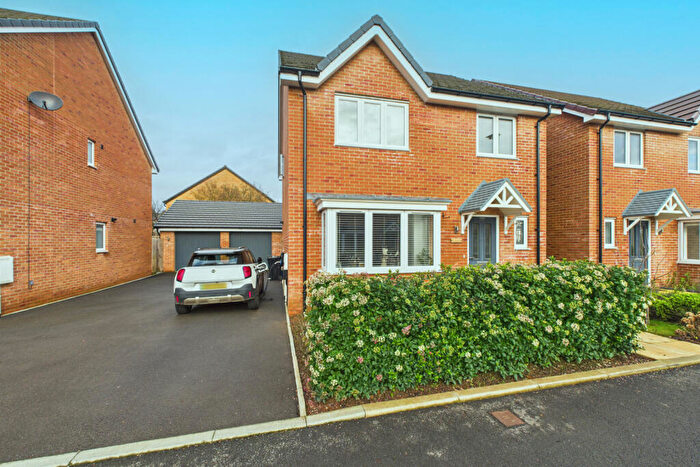
Properties for sale in Lydney East
Roads and Postcodes in Lydney East
Navigate through our locations to find the location of your next house in Lydney East, Lydney for sale or to rent.
| Streets | Postcodes |
|---|---|
| Abbots Gate | GL15 4BQ |
| Acorn Drive | GL15 5BZ |
| Albert Street | GL15 5LU GL15 5LX GL15 5NQ |
| Alderdale | GL15 5NG |
| Apple Blossom Close | GL15 5QY |
| Archers Hall Place | GL15 5FE |
| Augustus Way | GL15 5NJ |
| Barnett Way | GL15 5FS |
| Bath Place | GL15 5RR |
| Bayliss Close | GL15 5FW |
| Beauchamp Meadow | GL15 5NS |
| Beaufort Drive | GL15 5QR |
| Bledisloe Way | GL15 5GF |
| Boating Lake Lane | GL15 5GA |
| Bracken Close | GL15 5AH GL15 5AJ GL15 5FH |
| Bracken Drive | GL15 5AN GL15 5AQ |
| Caesars Close | GL15 5NR |
| Cambourne Place | GL15 5PT GL15 5PU |
| Claudius Way | GL15 5NN |
| Croome Close | GL15 5FR |
| Cross Hands | GL15 4LH GL15 4BZ |
| Crump Place | GL15 5BQ |
| Duncan Drive | GL15 5FU |
| Edwin Jones Way | GL15 5FL |
| Fairfield Road | GL15 5RT |
| Faller Fields | GL15 5FD |
| Feathers Drive | GL15 5GH GL15 5GL |
| Forest Parade | GL15 5HJ GL15 5LA |
| Forest Road | GL15 5LB GL15 5LD GL15 5LE |
| Gordon Sargent Close | GL15 5FN |
| Hadrian Close | GL15 5QT |
| Hams Road | GL15 5PE |
| Harbour Road | GL15 4ER |
| Harrison Way | GL15 5BB GL15 5BG GL15 5BH GL15 5BN |
| Herbert Howells Way | GL15 5FP |
| Highbrook Way | GL15 4BY |
| Highfield Rise | GL15 5LS |
| Highfield Road | GL15 5NA GL15 5NB GL15 5ND |
| Hill Street | GL15 5HA GL15 5HH GL15 5HL GL15 5HQ |
| Hopes Close | GL15 5EP |
| Jubilee Road | GL15 5AR |
| Julius Way | GL15 5QS |
| Juno Drive | GL15 5NY |
| Kimberley Close | GL15 5AE |
| Kimberley Drive | GL15 5AD GL15 5AF GL15 5AG GL15 5UA |
| Kingfisher Drive | GL15 5FX |
| Kings Meadow Court | GL15 5JU |
| Klondyke Avenue | GL15 5PL GL15 5PH GL15 5PN GL15 5PW |
| Lakeside Avenue | GL15 5PY GL15 5QA GL15 5QB |
| Lakeside Drive | GL15 5PZ |
| Lakeside Gardens | GL15 5RH |
| Livia Way | GL15 5NU |
| Lydfield Road | GL15 5RS |
| Lydney Industrial Estate | GL15 4EJ GL15 4EN |
| Mallard Way | GL15 5FZ GL15 5SB |
| Manor Court | GL15 5BY |
| Manor Road | GL15 5BW |
| Meadow Rise | GL15 5FJ |
| Meadow View | GL15 5DB |
| Meadowbank | GL15 5DF |
| Melville Watts Close | GL15 5FQ |
| Minerva Walk | GL15 5NT |
| Mount Pleasant | GL15 5QE GL15 5QP |
| Mount Pleasant Close | GL15 5QU |
| Naas Lane | GL15 4ES GL15 5AB GL15 5AS GL15 5AW GL15 5UB GL15 5AP GL15 5AT GL15 5AU |
| Nero Close | GL15 5NW |
| Newerne Street | GL15 5RA GL15 5RF GL15 5RB GL15 5RG |
| Nodens Way | GL15 5NP |
| Octavia Place | GL15 5NX |
| Orchard Road | GL15 5QH GL15 5QL GL15 5QQ |
| Overstreet Green | GL15 5GG |
| Par Four Lane | GL15 5GB GL15 5GD |
| Potter Grove | GL15 5FT |
| Purton Place | GL15 5BE GL15 5BD |
| Pylers Way | GL15 5PP |
| Queen Street | GL15 5LY GL15 5LZ |
| Queens Meadow Court | GL15 5JX |
| Regent Street | GL15 5RL GL15 5RJ GL15 5RN |
| Ridler Road | GL15 5BJ GL15 5BL |
| Rodley Road | GL15 5AX GL15 5AY GL15 5BA |
| Rodley Square | GL15 5AZ |
| Rushy Leaze | GL15 5QW |
| Sabrina Way | GL15 5NZ |
| Severn Bank Avenue | GL15 5BU |
| Severn Road | GL15 5QJ |
| Shepherdine Close | GL15 5BT |
| South Road | GL15 5LG |
| Spring Meadow Road | GL15 5LF |
| Springfield Road | GL15 5LQ GL15 5LT |
| St Marys Square | GL15 5AL |
| Steel Avenue | GL15 5PJ |
| Summerleaze | GL15 5PR GL15 5PS GL15 5QD |
| Swan Road | GL15 5RU GL15 5RX |
| The Bungalows | GL15 5QF |
| The Hawthorns | GL15 5BX |
| The Springs | GL15 5NF |
| Tiberius Avenue | GL15 5PD |
| Tuthill | GL15 5PA |
| Tuthill Rise | GL15 5BP |
| Tutnalls Street | GL15 5PB GL15 5PF GL15 5PG GL15 5PQ GL15 5QZ |
| Valley Road | GL15 5QN |
| Watermead | GL15 5NH |
| Windrush Gardens | GL15 5FF |
| Winter Crescent | GL15 4BU |
| Wintour Drive | GL15 5FA |
| Woodpecker Close | GL15 5FY |
| Wydean Close | GL15 5BS |
| GL15 4LP GL15 4BX GL15 5PX |
Transport near Lydney East
- FAQ
- Price Paid By Year
- Property Type Price
Frequently asked questions about Lydney East
What is the average price for a property for sale in Lydney East?
The average price for a property for sale in Lydney East is £233,115. This amount is 20% lower than the average price in Lydney. There are 1,358 property listings for sale in Lydney East.
What streets have the most expensive properties for sale in Lydney East?
The streets with the most expensive properties for sale in Lydney East are Croome Close at an average of £460,000, Tiberius Avenue at an average of £417,500 and Bayliss Close at an average of £385,000.
What streets have the most affordable properties for sale in Lydney East?
The streets with the most affordable properties for sale in Lydney East are Forest Parade at an average of £50,000, Queens Meadow Court at an average of £105,000 and Hopes Close at an average of £112,750.
Which train stations are available in or near Lydney East?
Some of the train stations available in or near Lydney East are Lydney, Cam and Dursley and Chepstow.
Property Price Paid in Lydney East by Year
The average sold property price by year was:
| Year | Average Sold Price | Price Change |
Sold Properties
|
|---|---|---|---|
| 2025 | £236,922 | 4% |
72 Properties |
| 2024 | £226,662 | -6% |
142 Properties |
| 2023 | £240,020 | -1% |
93 Properties |
| 2022 | £243,149 | 11% |
144 Properties |
| 2021 | £217,156 | -8% |
208 Properties |
| 2020 | £234,886 | 1% |
190 Properties |
| 2019 | £233,691 | 10% |
190 Properties |
| 2018 | £210,693 | 17% |
147 Properties |
| 2017 | £174,907 | 4% |
93 Properties |
| 2016 | £167,362 | 7% |
107 Properties |
| 2015 | £154,913 | 8% |
140 Properties |
| 2014 | £142,693 | 5% |
87 Properties |
| 2013 | £136,017 | -12% |
81 Properties |
| 2012 | £152,491 | 12% |
69 Properties |
| 2011 | £133,651 | -19% |
40 Properties |
| 2010 | £158,726 | 14% |
60 Properties |
| 2009 | £136,256 | -16% |
60 Properties |
| 2008 | £157,932 | -5% |
47 Properties |
| 2007 | £165,868 | 9% |
85 Properties |
| 2006 | £150,333 | 9% |
100 Properties |
| 2005 | £136,400 | 1% |
77 Properties |
| 2004 | £135,230 | 12% |
82 Properties |
| 2003 | £119,593 | 18% |
97 Properties |
| 2002 | £97,942 | 18% |
133 Properties |
| 2001 | £79,837 | 16% |
121 Properties |
| 2000 | £67,121 | 14% |
113 Properties |
| 1999 | £57,897 | -11% |
134 Properties |
| 1998 | £64,385 | -4% |
138 Properties |
| 1997 | £67,124 | 18% |
146 Properties |
| 1996 | £55,006 | 2% |
105 Properties |
| 1995 | £54,101 | - |
96 Properties |
Property Price per Property Type in Lydney East
Here you can find historic sold price data in order to help with your property search.
The average Property Paid Price for specific property types in the last three years are:
| Property Type | Average Sold Price | Sold Properties |
|---|---|---|
| Flat | £111,952.00 | 21 Flats |
| Semi Detached House | £214,274.00 | 95 Semi Detached Houses |
| Detached House | £311,793.00 | 100 Detached Houses |
| Terraced House | £194,286.00 | 91 Terraced Houses |

