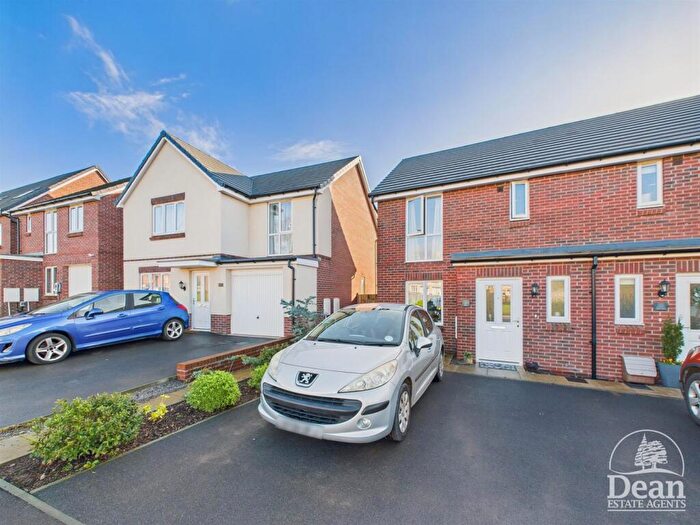
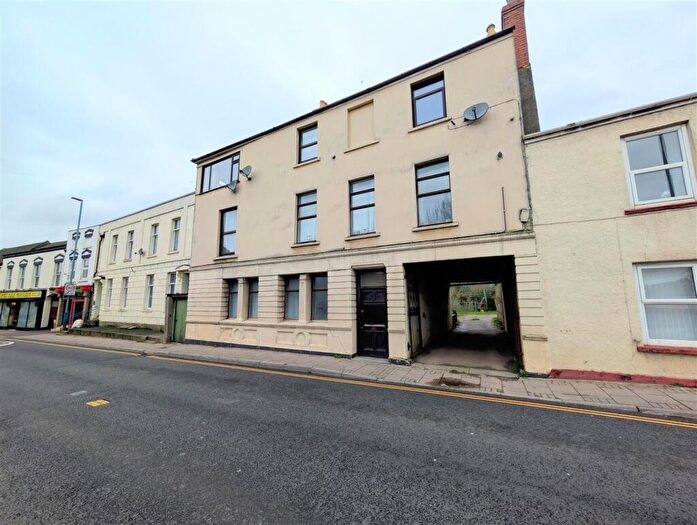
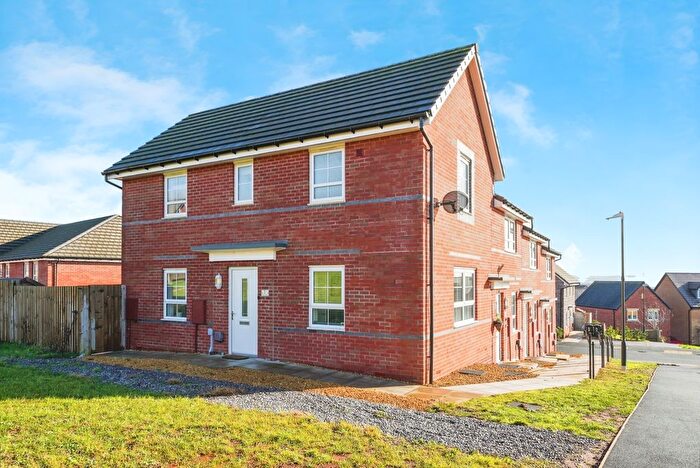
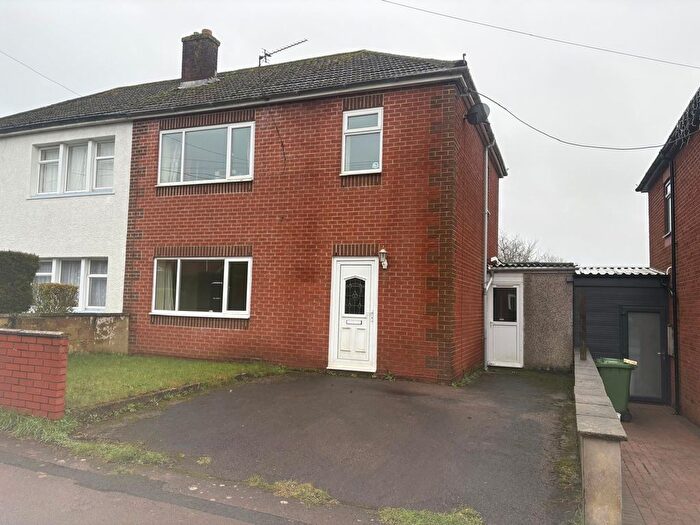
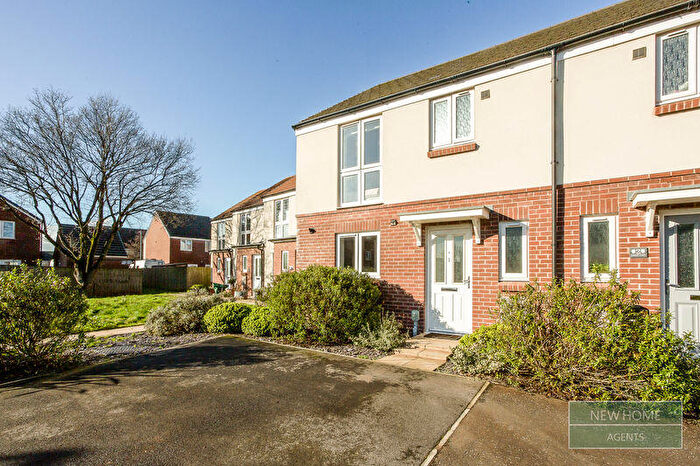
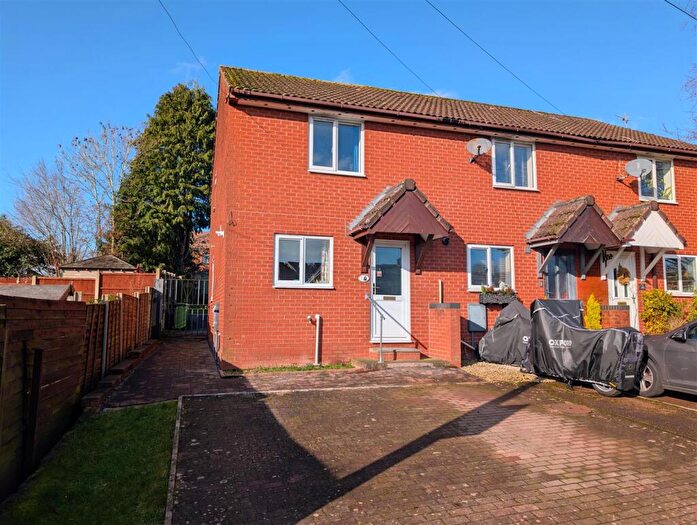
Houses for sale & to rent in Lydney North, Lydney
House Prices in Lydney North
Properties in Lydney North have an average house price of £292,735.00 and had 75 Property Transactions within the last 3 years¹.
Lydney North is an area in Lydney, Gloucestershire with 778 households², where the most expensive property was sold for £706,000.00.
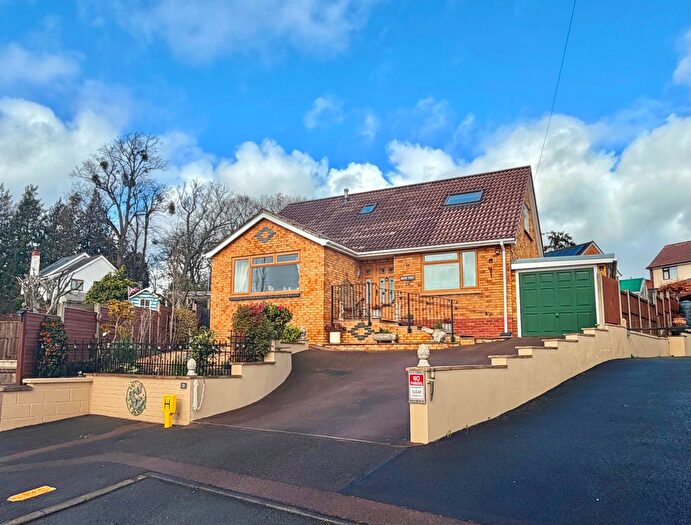
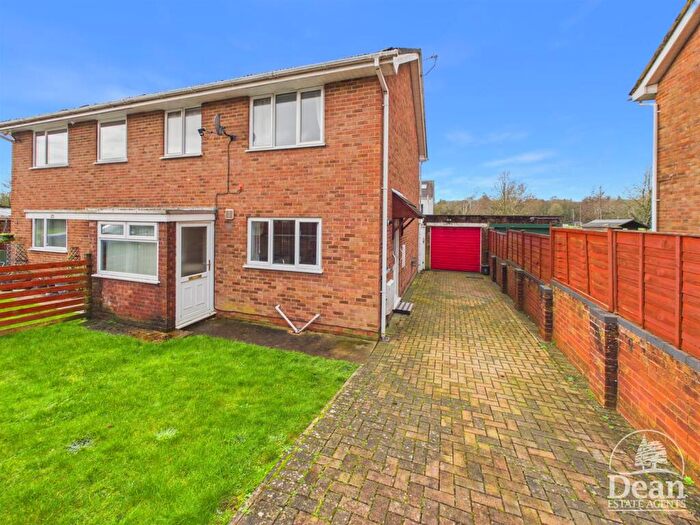
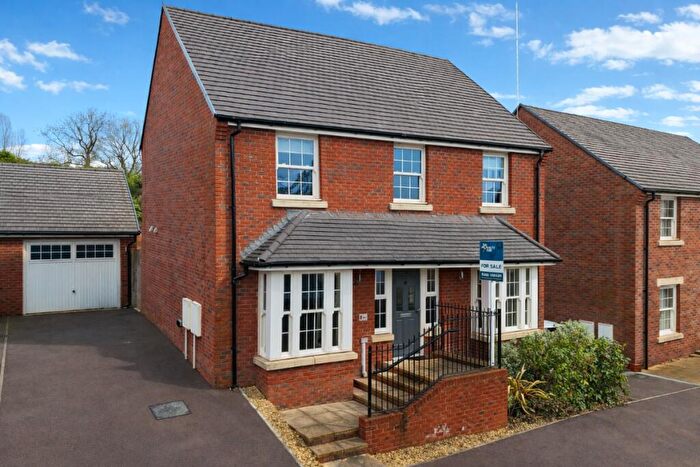
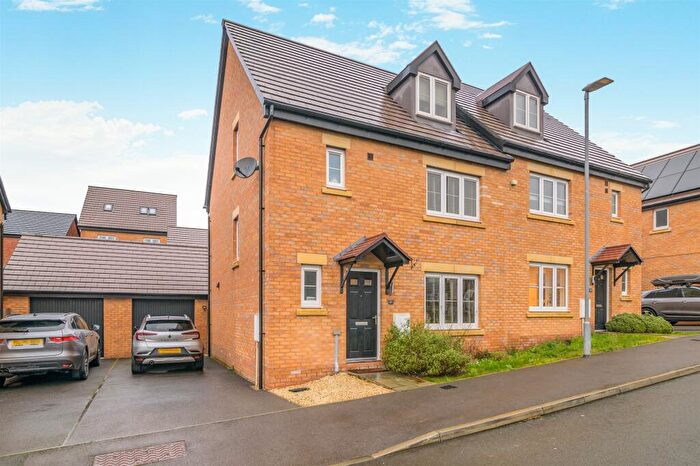
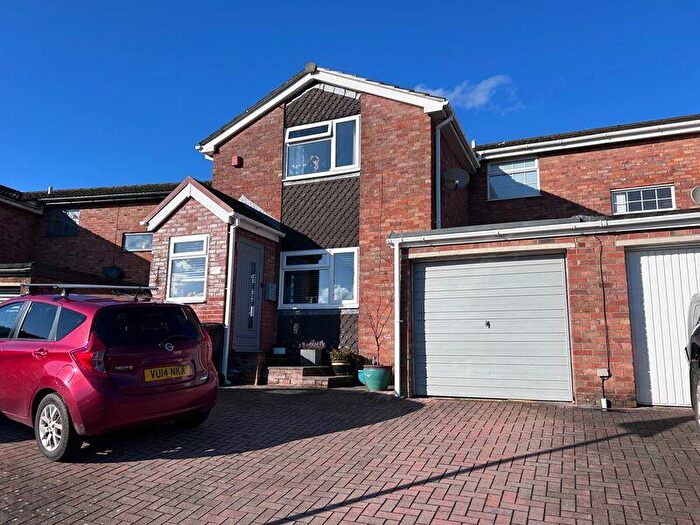
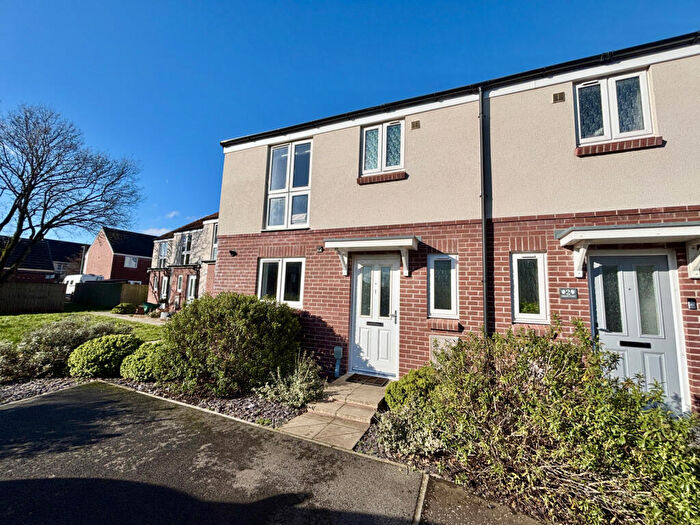
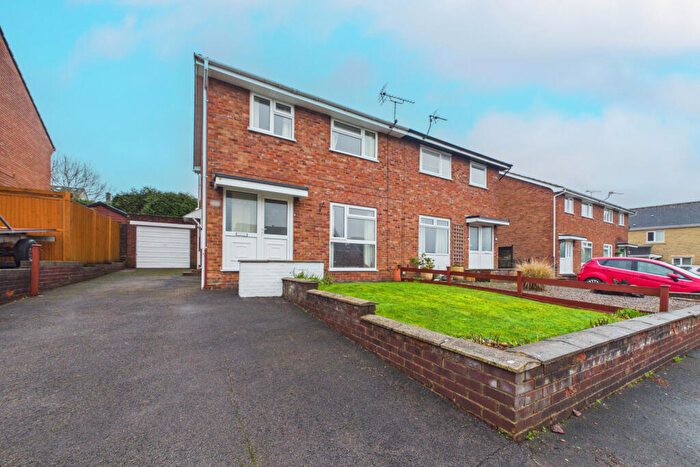
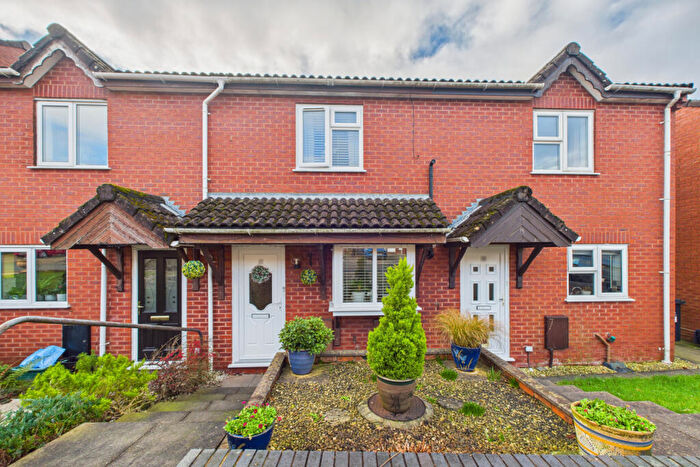
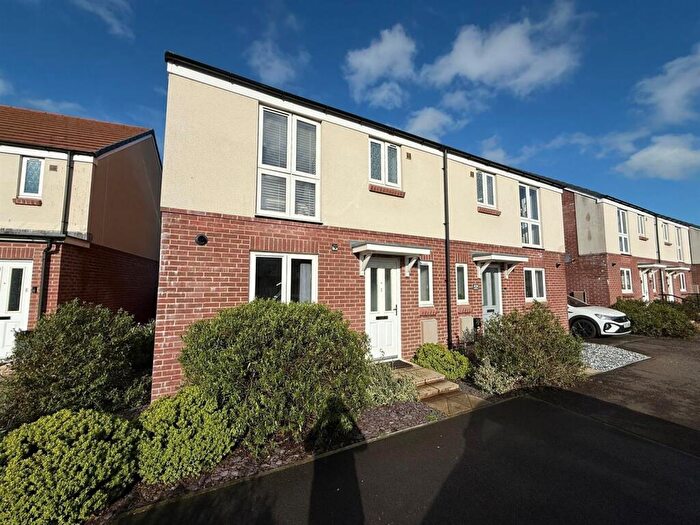
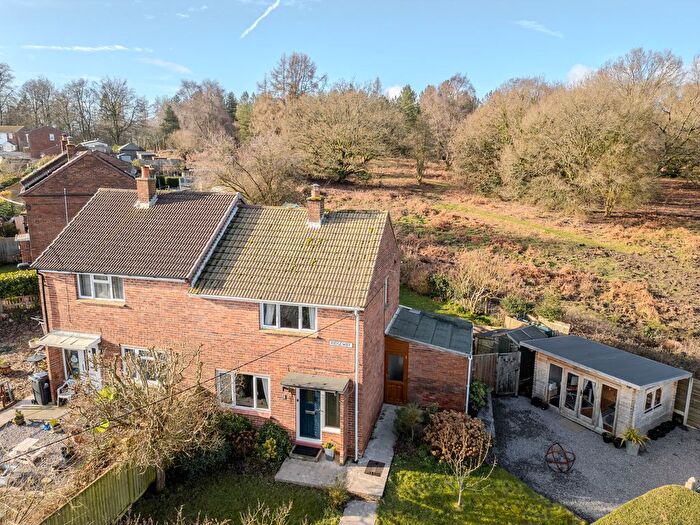
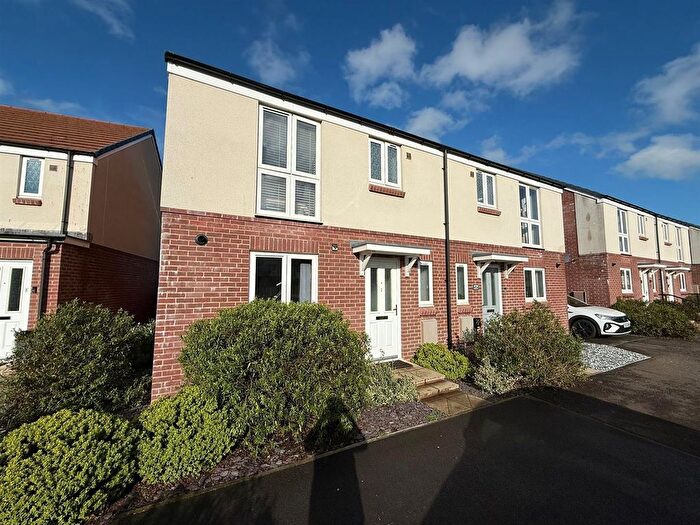
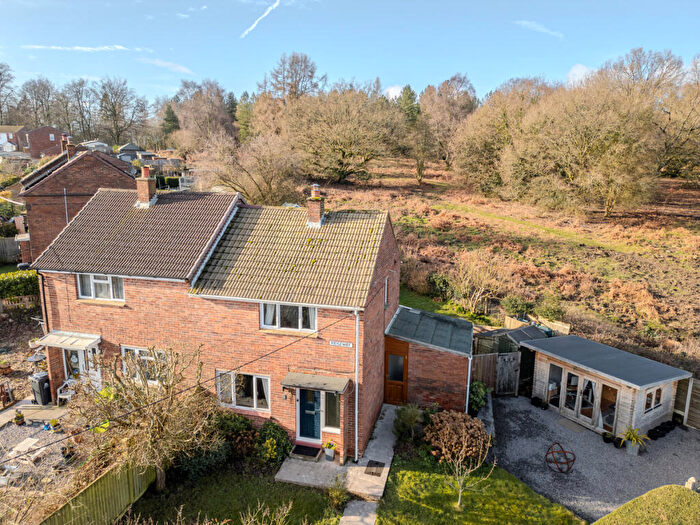
Properties for sale in Lydney North
Roads and Postcodes in Lydney North
Navigate through our locations to find the location of your next house in Lydney North, Lydney for sale or to rent.
| Streets | Postcodes |
|---|---|
| Allaston Road | GL15 4EX GL15 4EZ GL15 5SS GL15 5ST |
| Almond Walk | GL15 5LP |
| Ash Close | GL15 5NE |
| Berkeley Crescent | GL15 5SH |
| Charnwood Court | GL15 5TB |
| Cherry Walk | GL15 5LL |
| Court Road | GL15 5SR GL15 5SY |
| Dean Court | GL15 5TD |
| Driffield Road | GL15 4EU GL15 4LJ |
| Forest Road | GL15 4ET |
| Grove Lane | GL15 5SU |
| Highfield Lane | GL15 4LL |
| Lancaster Court | GL15 5SZ |
| Lancaster Drive | GL15 5SJ GL15 5SL GL15 5SN |
| Limeway | GL15 5LW |
| Lynwood Road | GL15 5SG |
| Neds Top | GL15 4NG GL15 4NH |
| Oak Meadow | GL15 5SD |
| Old Dam Road | GL15 4EY |
| Primrose Hill | GL15 5SE GL15 5SF GL15 5SP GL15 5SW |
| Primrose Way | GL15 5SQ |
| Purlieu | GL15 4LN |
| River View | GL15 5TQ |
| School Crescent | GL15 5TA |
| The Millrough | GL15 5TE |
| Willow Heights | GL15 5LR |
| Windsor Drive | GL15 5SX |
| Woodland Rise | GL15 5LH GL15 5LJ GL15 5LN |
| GL15 4LW |
Transport near Lydney North
- FAQ
- Price Paid By Year
- Property Type Price
Frequently asked questions about Lydney North
What is the average price for a property for sale in Lydney North?
The average price for a property for sale in Lydney North is £292,735. This amount is 0.4% higher than the average price in Lydney. There are 1,545 property listings for sale in Lydney North.
What streets have the most expensive properties for sale in Lydney North?
The streets with the most expensive properties for sale in Lydney North are Driffield Road at an average of £481,666, Court Road at an average of £473,000 and River View at an average of £365,000.
What streets have the most affordable properties for sale in Lydney North?
The streets with the most affordable properties for sale in Lydney North are Charnwood Court at an average of £205,000, School Crescent at an average of £231,750 and Dean Court at an average of £232,500.
Which train stations are available in or near Lydney North?
Some of the train stations available in or near Lydney North are Lydney, Cam and Dursley and Chepstow.
Property Price Paid in Lydney North by Year
The average sold property price by year was:
| Year | Average Sold Price | Price Change |
Sold Properties
|
|---|---|---|---|
| 2025 | £286,098 | -1% |
28 Properties |
| 2024 | £290,288 | -6% |
31 Properties |
| 2023 | £309,090 | -9% |
16 Properties |
| 2022 | £336,756 | 21% |
29 Properties |
| 2021 | £265,950 | 1% |
40 Properties |
| 2020 | £264,164 | 12% |
27 Properties |
| 2019 | £232,819 | 12% |
34 Properties |
| 2018 | £205,464 | -6% |
31 Properties |
| 2017 | £216,860 | 12% |
28 Properties |
| 2016 | £190,849 | 5% |
30 Properties |
| 2015 | £181,398 | 2% |
35 Properties |
| 2014 | £177,069 | 10% |
44 Properties |
| 2013 | £159,437 | -14% |
20 Properties |
| 2012 | £180,980 | -6% |
25 Properties |
| 2011 | £192,437 | 12% |
8 Properties |
| 2010 | £169,444 | -1% |
18 Properties |
| 2009 | £171,827 | -2% |
29 Properties |
| 2008 | £174,674 | -8% |
20 Properties |
| 2007 | £188,997 | -1% |
41 Properties |
| 2006 | £190,528 | 11% |
42 Properties |
| 2005 | £169,231 | 5% |
30 Properties |
| 2004 | £160,210 | 18% |
33 Properties |
| 2003 | £132,113 | 17% |
43 Properties |
| 2002 | £110,252 | 24% |
55 Properties |
| 2001 | £83,556 | 7% |
48 Properties |
| 2000 | £77,859 | 16% |
37 Properties |
| 1999 | £65,641 | -3% |
42 Properties |
| 1998 | £67,812 | 7% |
47 Properties |
| 1997 | £63,154 | 19% |
55 Properties |
| 1996 | £51,229 | 4% |
41 Properties |
| 1995 | £48,952 | - |
26 Properties |
Property Price per Property Type in Lydney North
Here you can find historic sold price data in order to help with your property search.
The average Property Paid Price for specific property types in the last three years are:
| Property Type | Average Sold Price | Sold Properties |
|---|---|---|
| Semi Detached House | £253,965.00 | 32 Semi Detached Houses |
| Detached House | £336,891.00 | 37 Detached Houses |
| Terraced House | £227,208.00 | 6 Terraced Houses |

