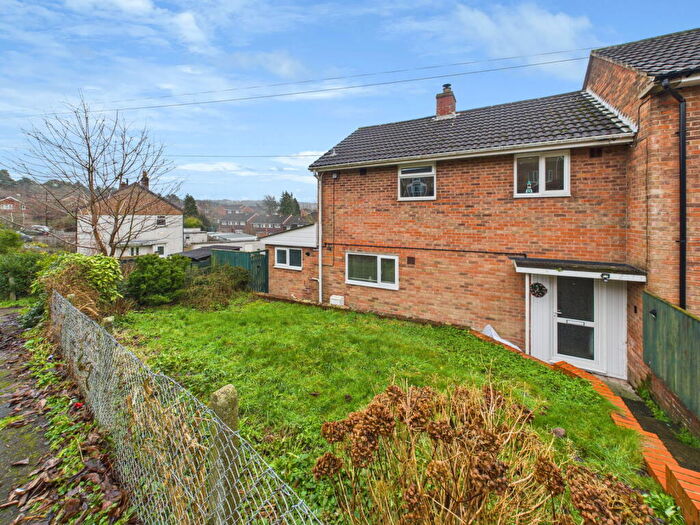
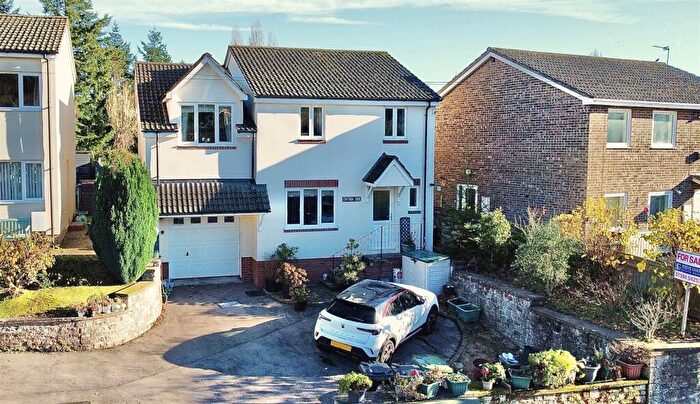
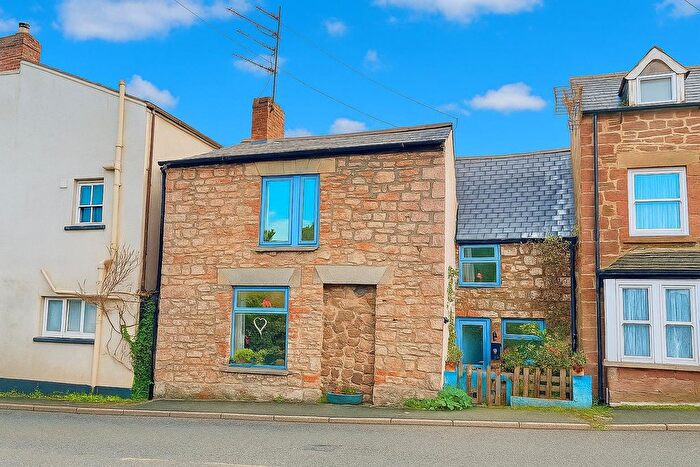
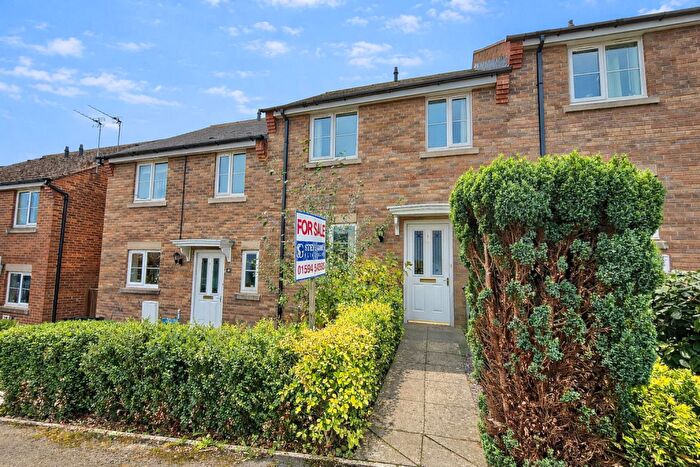
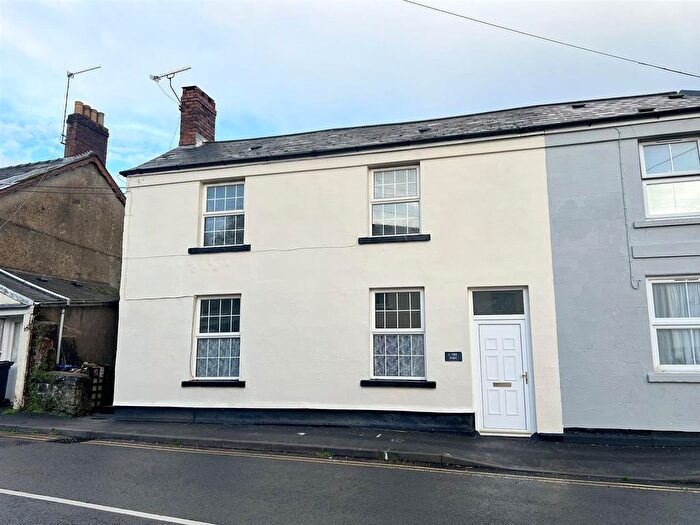
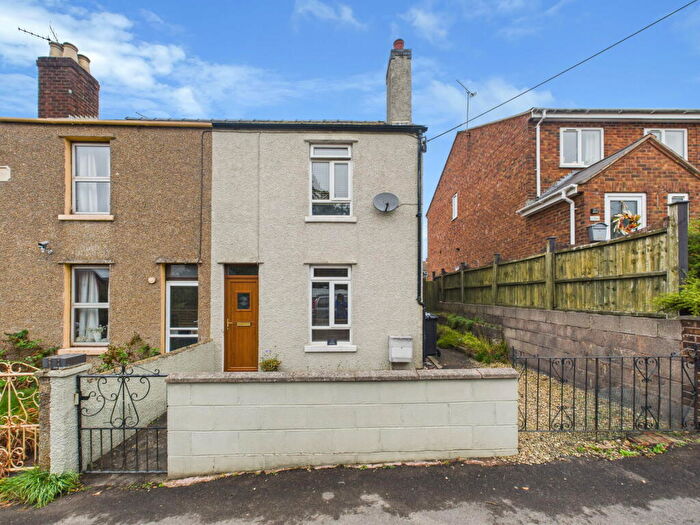
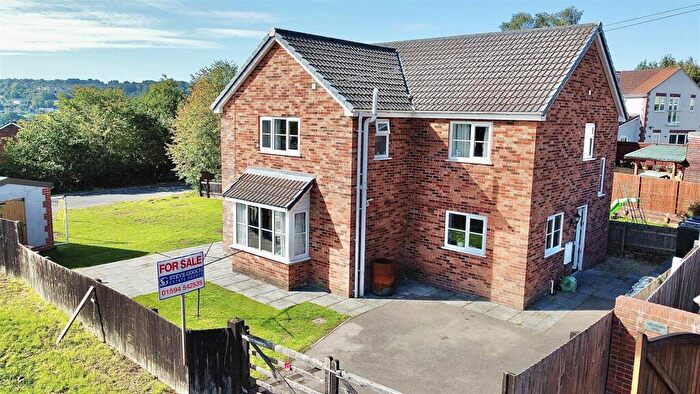
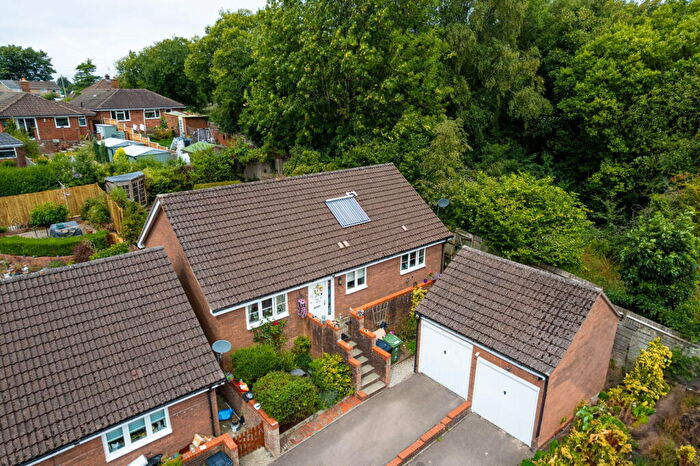
Houses for sale & to rent in Mitcheldean And Drybrook, Mitcheldean
House Prices in Mitcheldean And Drybrook
Properties in Mitcheldean And Drybrook have an average house price of £268,847.00 and had 84 Property Transactions within the last 3 years¹.
Mitcheldean And Drybrook is an area in Mitcheldean, Gloucestershire with 1,075 households², where the most expensive property was sold for £960,000.00.
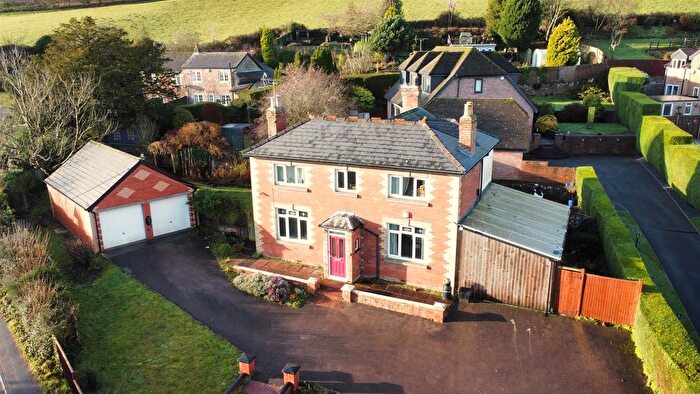
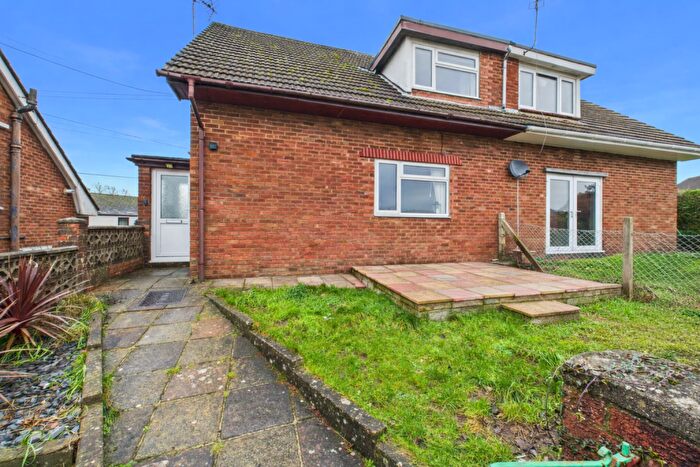
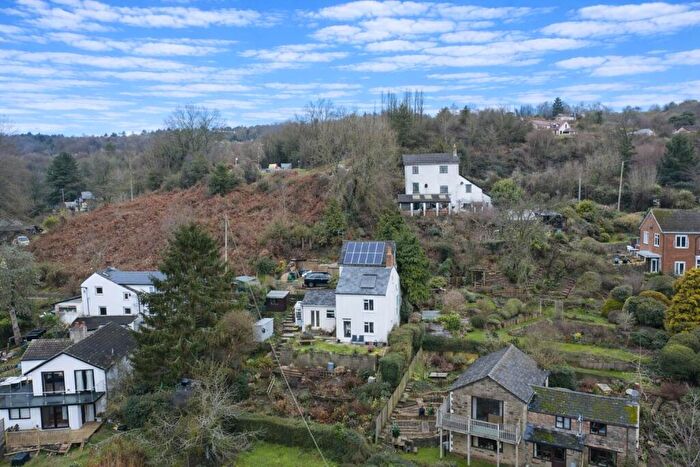
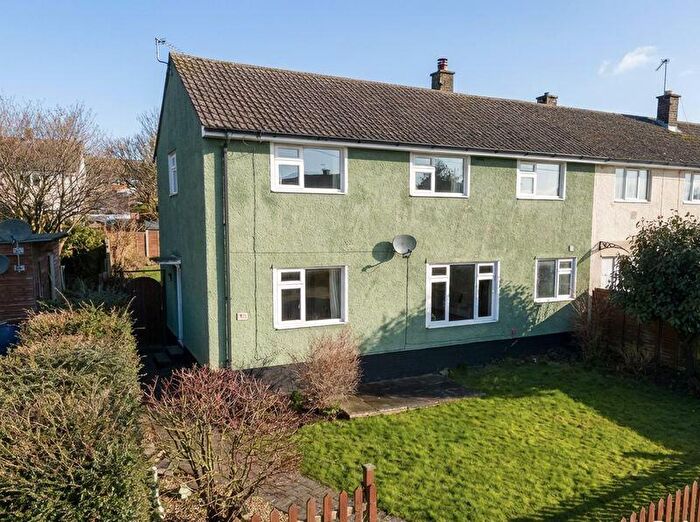
Properties for sale in Mitcheldean And Drybrook
Roads and Postcodes in Mitcheldean And Drybrook
Navigate through our locations to find the location of your next house in Mitcheldean And Drybrook, Mitcheldean for sale or to rent.
| Streets | Postcodes |
|---|---|
| Abenhall Road | GL17 0DT GL17 0DX GL17 0DY |
| Anns Walk | GL17 0DA |
| Ash Grove | GL17 0SE |
| Baby Lane | GL17 0SQ |
| Baynham Road | GL17 0JR |
| Belmont Terrace | GL17 0JD |
| Blackwell | GL17 0JJ |
| Bradley Court Road | GL17 0DR GL17 0SF |
| Brook Street | GL17 0AU |
| Carisbrooke Road | GL17 0SA |
| Church Lane | GL17 0AR |
| Churchill Way | GL17 0AZ |
| Colchester Close | GL17 0JS |
| Dean Meadows | GL17 0EJ |
| Deans Way Road | GL17 0BJ |
| Dockins Hill Way | GL17 0EX |
| Eastern Avenue | GL17 0DB GL17 0DE GL17 0DF GL17 0DG |
| Glebe Close | GL17 0BW |
| Glencoe Lane | GL17 0EU |
| Gloucester Road | GL17 0DS |
| Harptree Way | GL17 0BL |
| Hawkers Hill | GL17 0BS |
| Hazel Hill | GL17 0HE |
| High Street | GL17 0AT |
| Hollywell Road | GL17 0DL GL17 0DN GL17 0DW |
| Jubilee Road | GL17 0EE GL17 0EG |
| Lining Wood | GL17 0EN |
| Manor Cottages | GL17 0BY |
| May Meadow Lane | GL17 0HR |
| Merrin Street | GL17 0BT |
| Mill End Street | GL17 0HP |
| New Road | GL17 0BX GL17 0EP |
| New Street | GL17 0HS GL17 0HT |
| Nourse Place | GL17 0JU |
| Oakhill Road | GL17 0BN |
| Old Dean Road | GL17 0BH GL17 0BQ |
| Orchard Close | GL17 0JB |
| Parks Road | GL17 0DH GL17 0DQ |
| Platts Row | GL17 0AX |
| Plump Hill | GL17 0ES GL17 0ET GL17 0EY GL17 0EZ GL17 0HB GL17 0HG |
| Ross Road | GL17 0EQ |
| Silver Street | GL17 0BZ |
| St Michaels Close | GL17 0HU |
| Stars Pitch | GL17 0BP |
| Stenders Road | GL17 0JL |
| Talbot Place | GL17 0AY |
| The Crescent | GL17 0SB |
| The Merrin | GL17 0BU |
| The Rocks | GL17 0HF |
| The Rookery | GL17 0EF |
| The Stenders | GL17 0HX GL17 0HY GL17 0JE |
| Townsend | GL17 0BA GL17 0BD GL17 0BE |
| Tusculum Way | GL17 0HZ |
| Vicarage Drive | GL17 0XW |
| Walwyn Close | GL17 0JT |
| Wilderness Drive | GL17 0HA |
| Wintles Close | GL17 0JP |
| GL17 0DP GL17 0JG GL17 0JH GL17 0JN GL17 0JQ GL17 0JW |
Transport near Mitcheldean And Drybrook
-
Lydney Station
-
Gloucester Station
-
Cam and Dursley Station
-
Stonehouse Station
-
Ledbury Station
-
Stroud Station
- FAQ
- Price Paid By Year
- Property Type Price
Frequently asked questions about Mitcheldean And Drybrook
What is the average price for a property for sale in Mitcheldean And Drybrook?
The average price for a property for sale in Mitcheldean And Drybrook is £268,847. There are 412 property listings for sale in Mitcheldean And Drybrook.
What streets have the most expensive properties for sale in Mitcheldean And Drybrook?
The streets with the most expensive properties for sale in Mitcheldean And Drybrook are Abenhall Road at an average of £865,000, Wilderness Drive at an average of £525,000 and New Street at an average of £500,000.
What streets have the most affordable properties for sale in Mitcheldean And Drybrook?
The streets with the most affordable properties for sale in Mitcheldean And Drybrook are Mill End Street at an average of £75,000, Brook Street at an average of £118,000 and Stars Pitch at an average of £150,750.
Which train stations are available in or near Mitcheldean And Drybrook?
Some of the train stations available in or near Mitcheldean And Drybrook are Lydney, Gloucester and Cam and Dursley.
Property Price Paid in Mitcheldean And Drybrook by Year
The average sold property price by year was:
| Year | Average Sold Price | Price Change |
Sold Properties
|
|---|---|---|---|
| 2025 | £250,930 | -5% |
33 Properties |
| 2024 | £263,075 | -13% |
26 Properties |
| 2023 | £298,500 | - |
25 Properties |
| 2022 | £298,623 | 16% |
28 Properties |
| 2021 | £249,834 | 18% |
55 Properties |
| 2020 | £203,998 | -3% |
30 Properties |
| 2019 | £210,602 | 2% |
45 Properties |
| 2018 | £206,164 | -12% |
41 Properties |
| 2017 | £230,024 | 19% |
43 Properties |
| 2016 | £185,196 | 5% |
59 Properties |
| 2015 | £175,517 | 8% |
53 Properties |
| 2014 | £161,731 | 7% |
41 Properties |
| 2013 | £150,281 | -18% |
30 Properties |
| 2012 | £176,798 | 10% |
31 Properties |
| 2011 | £159,302 | -15% |
18 Properties |
| 2010 | £183,748 | 3% |
32 Properties |
| 2009 | £177,926 | -6% |
30 Properties |
| 2008 | £188,432 | 11% |
31 Properties |
| 2007 | £167,056 | 7% |
74 Properties |
| 2006 | £156,139 | -4% |
46 Properties |
| 2005 | £162,714 | 6% |
39 Properties |
| 2004 | £152,522 | 27% |
41 Properties |
| 2003 | £111,461 | 8% |
43 Properties |
| 2002 | £102,832 | 15% |
62 Properties |
| 2001 | £87,621 | 8% |
59 Properties |
| 2000 | £80,408 | 20% |
51 Properties |
| 1999 | £63,932 | 11% |
59 Properties |
| 1998 | £57,000 | -27% |
52 Properties |
| 1997 | £72,331 | 30% |
37 Properties |
| 1996 | £50,811 | -2% |
47 Properties |
| 1995 | £52,054 | - |
33 Properties |
Property Price per Property Type in Mitcheldean And Drybrook
Here you can find historic sold price data in order to help with your property search.
The average Property Paid Price for specific property types in the last three years are:
| Property Type | Average Sold Price | Sold Properties |
|---|---|---|
| Semi Detached House | £210,158.00 | 25 Semi Detached Houses |
| Detached House | £401,225.00 | 27 Detached Houses |
| Terraced House | £224,740.00 | 27 Terraced Houses |
| Flat | £85,620.00 | 5 Flats |

