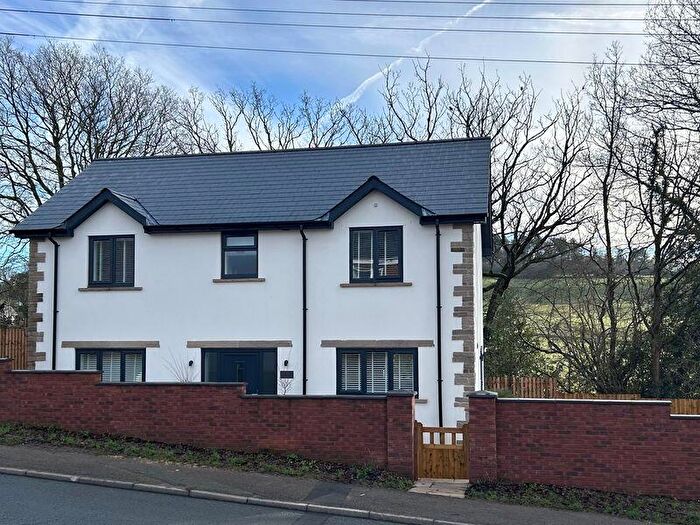
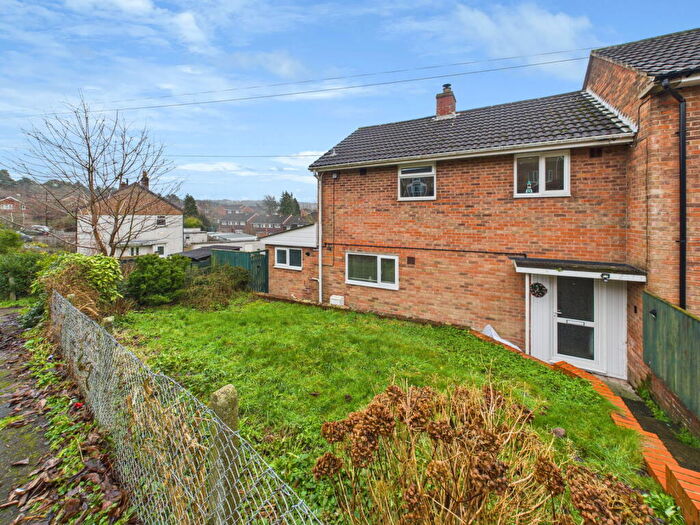
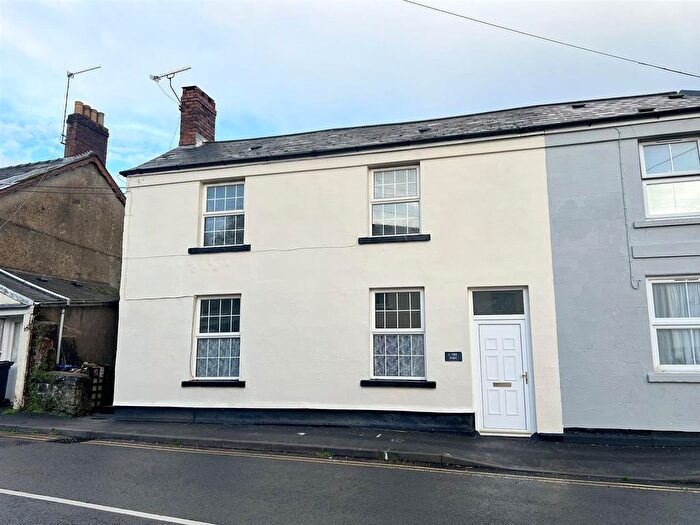
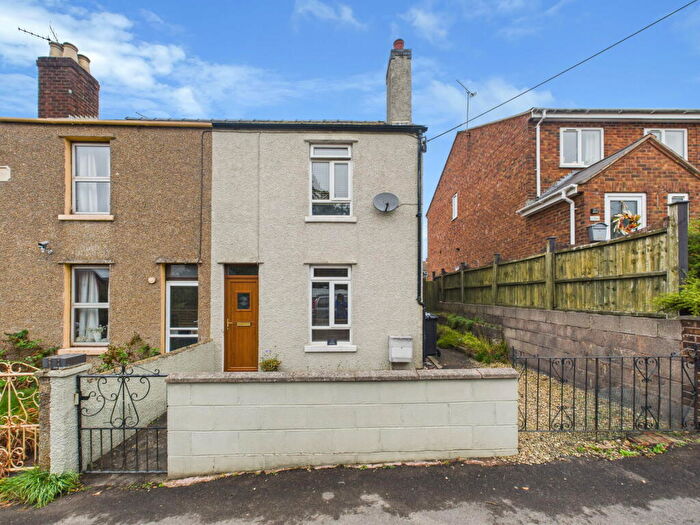
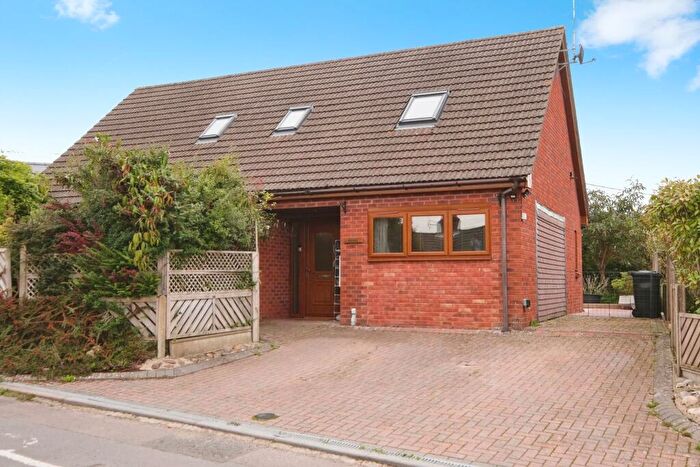
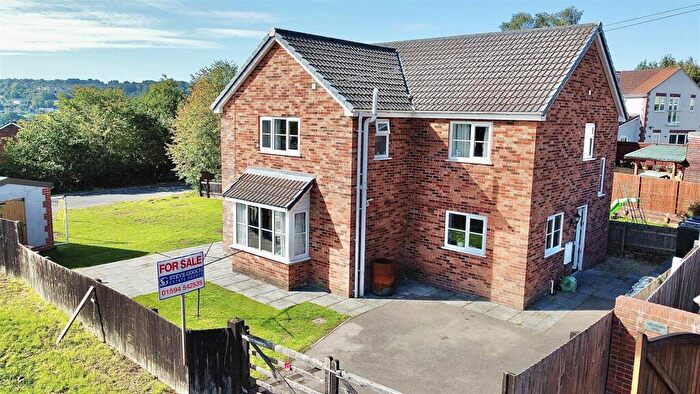
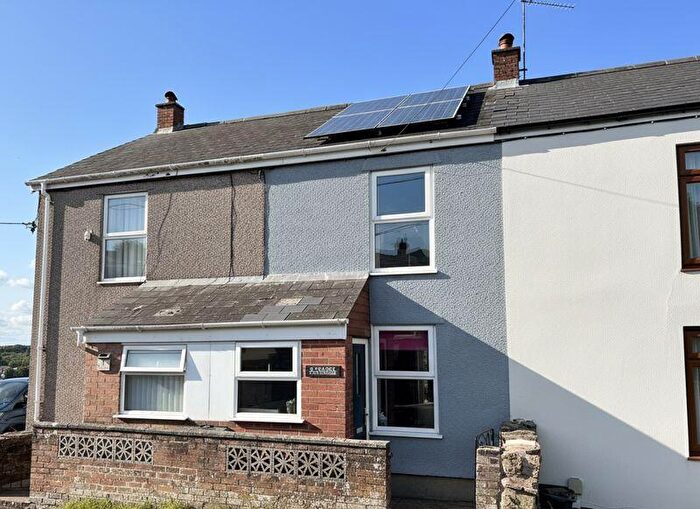
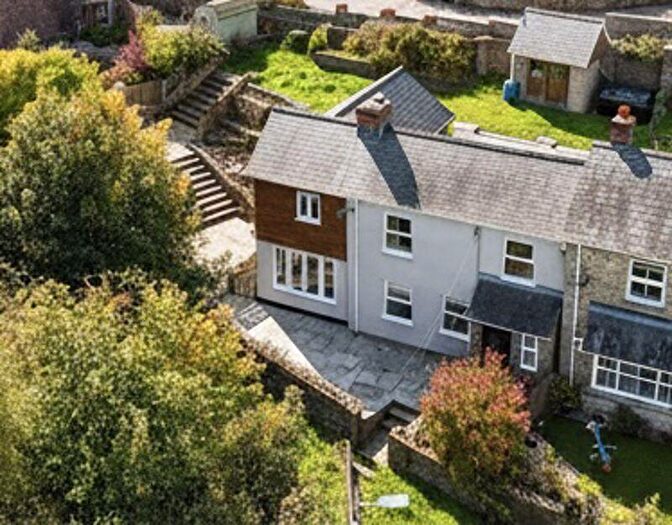
Houses for sale & to rent in Mitcheldean And Drybrook, Drybrook
House Prices in Mitcheldean And Drybrook
Properties in Mitcheldean And Drybrook have an average house price of £313,504.00 and had 53 Property Transactions within the last 3 years¹.
Mitcheldean And Drybrook is an area in Drybrook, Gloucestershire with 685 households², where the most expensive property was sold for £542,500.00.
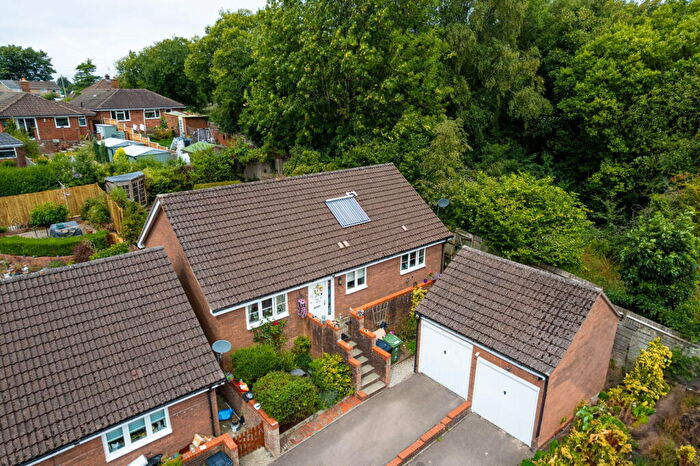
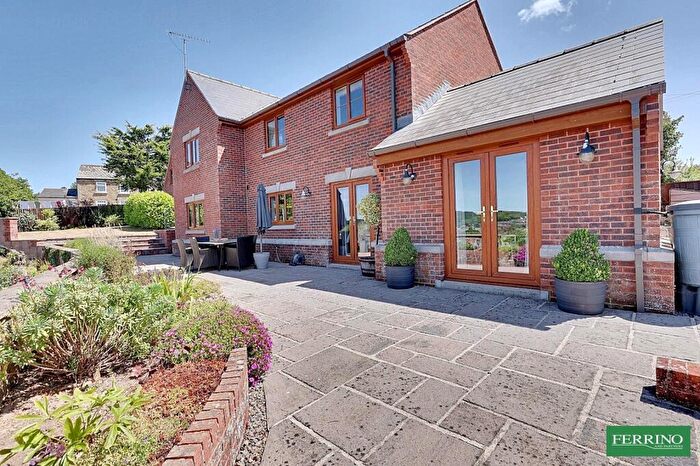
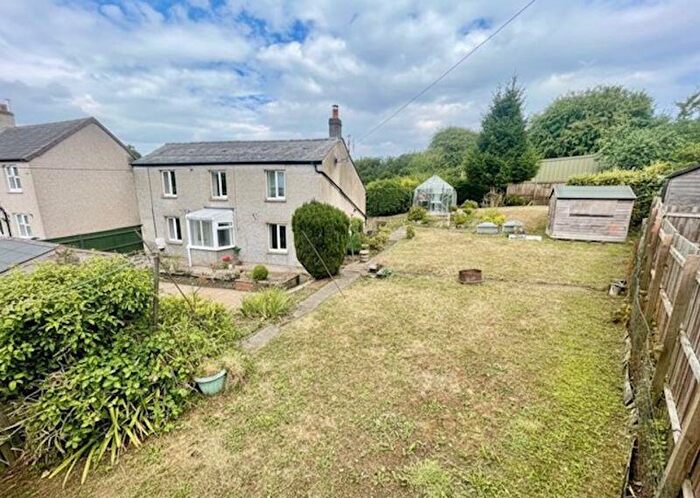
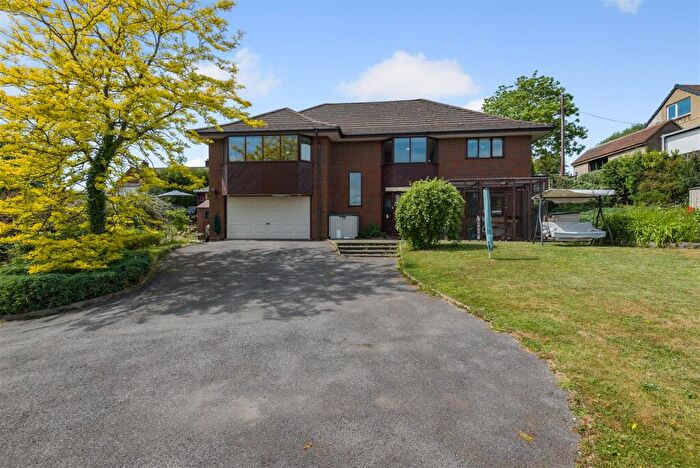
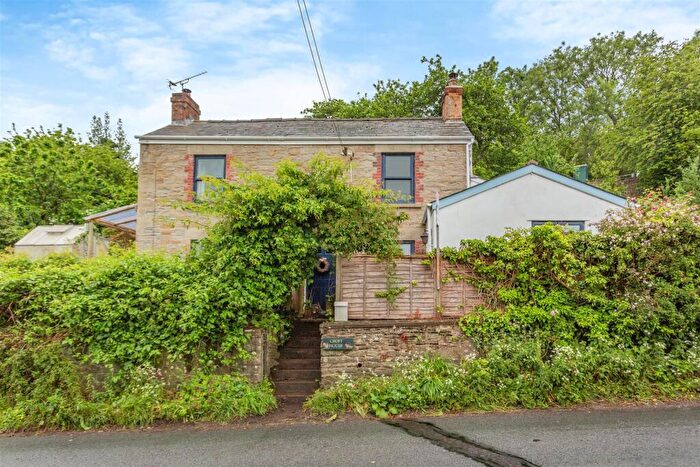
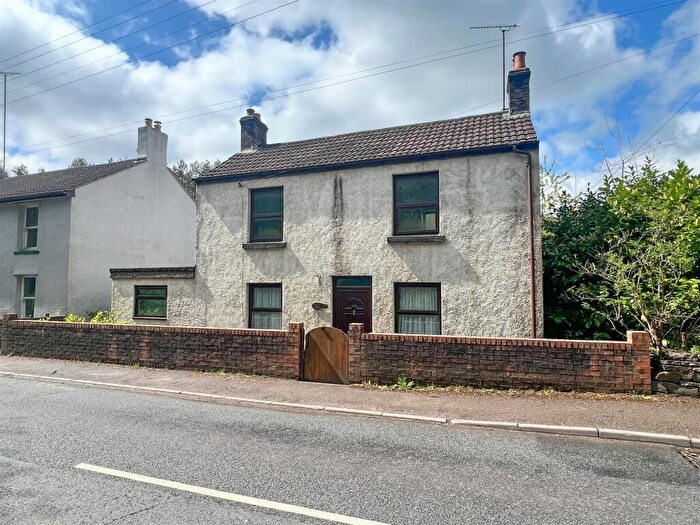
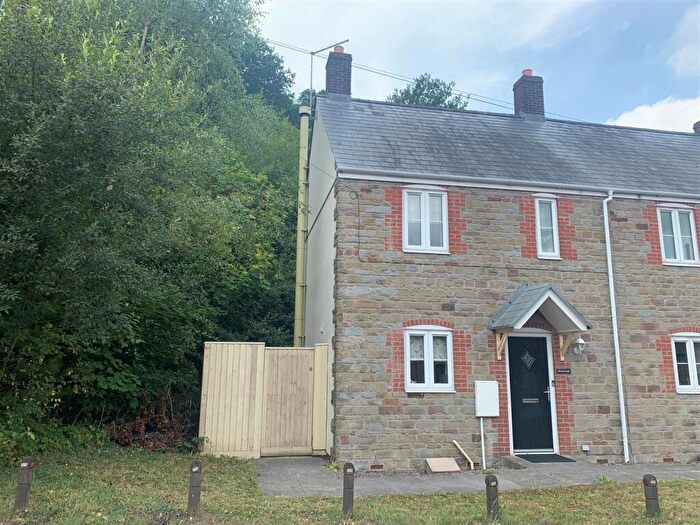
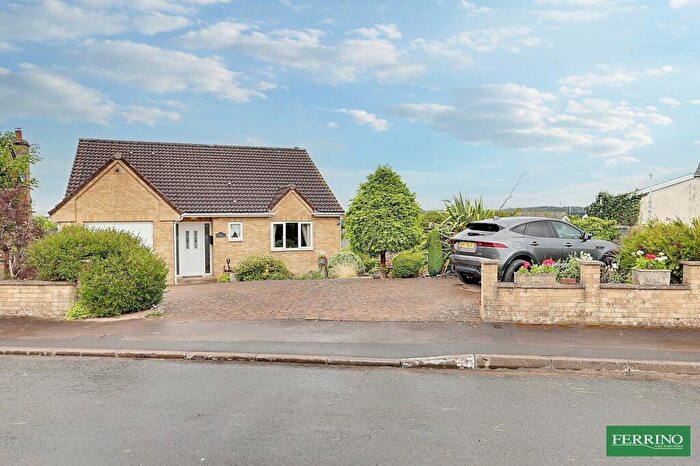
Properties for sale in Mitcheldean And Drybrook
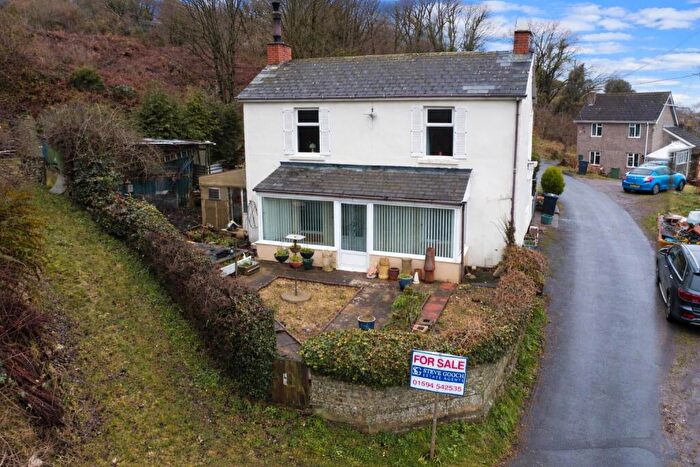
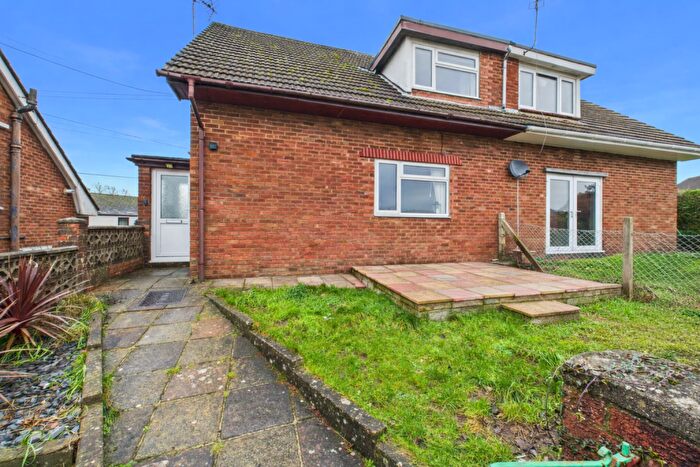
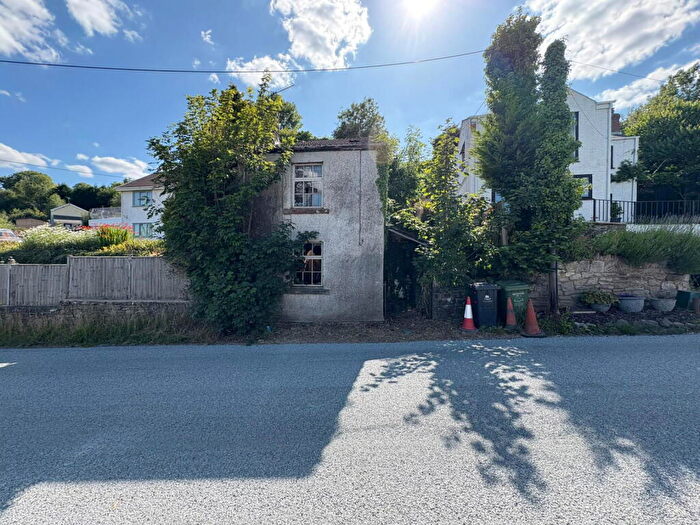
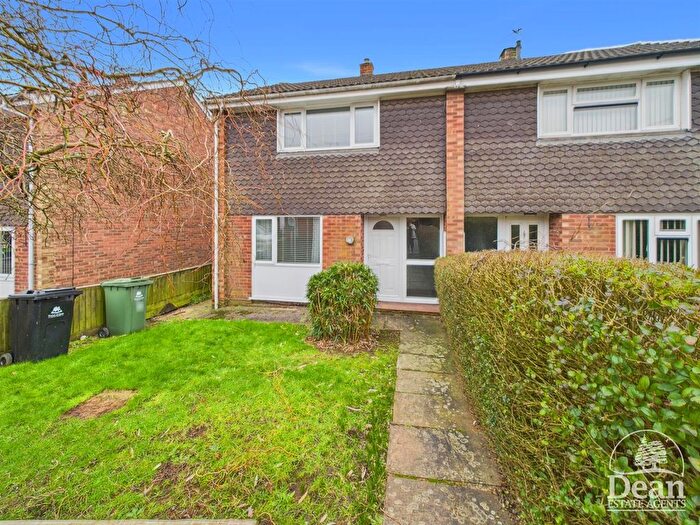
Previously listed properties in Mitcheldean And Drybrook
Roads and Postcodes in Mitcheldean And Drybrook
Navigate through our locations to find the location of your next house in Mitcheldean And Drybrook, Drybrook for sale or to rent.
| Streets | Postcodes |
|---|---|
| Bracken Road | GL17 9YD |
| Bridge Road | GL17 9JT |
| Deans Walk | GL17 9JU |
| Drybrook Road | GL17 9JA GL17 9JB GL17 9JG GL17 9JJ |
| Eastwood Road | GL17 9JY |
| Forest Edge | GL17 9HY |
| Hawthorns Road | GL17 9BP GL17 9BS GL17 9BU GL17 9BX |
| Hazel Hill | GL17 9EJ GL17 9HH GL17 9HJ GL17 9HR |
| Hazel Road | GL17 9EL GL17 9EP GL17 9HF GL17 9HQ |
| High Street | GL17 9EA GL17 9EQ GL17 9ER GL17 9ES GL17 9ET GL17 9EU |
| Hillside Road | GL17 9EW GL17 9HL GL17 9HN |
| Larksfield Road | GL17 9JP |
| Mannings Road | GL17 9HS |
| Manse Road | GL17 9EH |
| Morman Close | GL17 9HT |
| Morse Lane | GL17 9AE GL17 9AF GL17 9BA |
| Mount Close | GL17 9LB |
| North Avenue | GL17 9HU |
| Oakland Road | GL17 9JX |
| Quabbs Road | GL17 9AG GL17 9JD |
| Rose Villas | GL17 9JQ |
| Springfields | GL17 9BW |
| Sycamore Road | GL17 9JZ |
| The Cross | GL17 9EB GL17 9EE GL17 9EF |
| The Squirrels | GL17 9FB |
| Trinity Road | GL17 9JR GL17 9LD |
| West Avenue | GL17 9HX |
| Whitehill Lane | GL17 9AD |
| Woodend Road | GL17 9LA |
| Woodland Road | GL17 9HE |
| GL17 9EY GL17 9HP |
Transport near Mitcheldean And Drybrook
-
Lydney Station
-
Cam and Dursley Station
-
Gloucester Station
-
Stonehouse Station
-
Ledbury Station
-
Stroud Station
- FAQ
- Price Paid By Year
- Property Type Price
Frequently asked questions about Mitcheldean And Drybrook
What is the average price for a property for sale in Mitcheldean And Drybrook?
The average price for a property for sale in Mitcheldean And Drybrook is £313,504. This amount is 4% lower than the average price in Drybrook. There are 245 property listings for sale in Mitcheldean And Drybrook.
What streets have the most expensive properties for sale in Mitcheldean And Drybrook?
The streets with the most expensive properties for sale in Mitcheldean And Drybrook are Hazel Hill at an average of £465,000, Eastwood Road at an average of £417,500 and Sycamore Road at an average of £415,000.
What streets have the most affordable properties for sale in Mitcheldean And Drybrook?
The streets with the most affordable properties for sale in Mitcheldean And Drybrook are Whitehill Lane at an average of £185,666, Quabbs Road at an average of £192,000 and West Avenue at an average of £210,000.
Which train stations are available in or near Mitcheldean And Drybrook?
Some of the train stations available in or near Mitcheldean And Drybrook are Lydney, Cam and Dursley and Gloucester.
Property Price Paid in Mitcheldean And Drybrook by Year
The average sold property price by year was:
| Year | Average Sold Price | Price Change |
Sold Properties
|
|---|---|---|---|
| 2025 | £334,083 | 18% |
18 Properties |
| 2024 | £273,794 | -21% |
17 Properties |
| 2023 | £330,430 | 14% |
18 Properties |
| 2022 | £283,554 | 3% |
32 Properties |
| 2021 | £274,089 | 2% |
39 Properties |
| 2020 | £269,300 | -3% |
20 Properties |
| 2019 | £277,782 | 10% |
23 Properties |
| 2018 | £249,500 | 8% |
33 Properties |
| 2017 | £230,629 | 18% |
27 Properties |
| 2016 | £189,866 | 4% |
35 Properties |
| 2015 | £181,697 | 2% |
28 Properties |
| 2014 | £177,634 | 24% |
26 Properties |
| 2013 | £135,629 | -41% |
31 Properties |
| 2012 | £191,555 | 5% |
18 Properties |
| 2011 | £181,970 | -6% |
17 Properties |
| 2010 | £192,153 | 12% |
16 Properties |
| 2009 | £169,063 | -17% |
23 Properties |
| 2008 | £198,473 | 0,1% |
56 Properties |
| 2007 | £198,205 | 16% |
37 Properties |
| 2006 | £165,917 | -0,2% |
31 Properties |
| 2005 | £166,176 | 17% |
21 Properties |
| 2004 | £137,371 | 3% |
20 Properties |
| 2003 | £133,474 | 6% |
24 Properties |
| 2002 | £124,976 | 24% |
28 Properties |
| 2001 | £94,453 | 17% |
26 Properties |
| 2000 | £78,645 | 10% |
24 Properties |
| 1999 | £71,100 | 17% |
27 Properties |
| 1998 | £58,994 | 2% |
20 Properties |
| 1997 | £57,620 | -3% |
29 Properties |
| 1996 | £59,343 | 24% |
22 Properties |
| 1995 | £45,369 | - |
23 Properties |
Property Price per Property Type in Mitcheldean And Drybrook
Here you can find historic sold price data in order to help with your property search.
The average Property Paid Price for specific property types in the last three years are:
| Property Type | Average Sold Price | Sold Properties |
|---|---|---|
| Semi Detached House | £300,387.00 | 20 Semi Detached Houses |
| Detached House | £361,500.00 | 25 Detached Houses |
| Terraced House | £208,071.00 | 7 Terraced Houses |
| Flat | £114,000.00 | 1 Flat |

