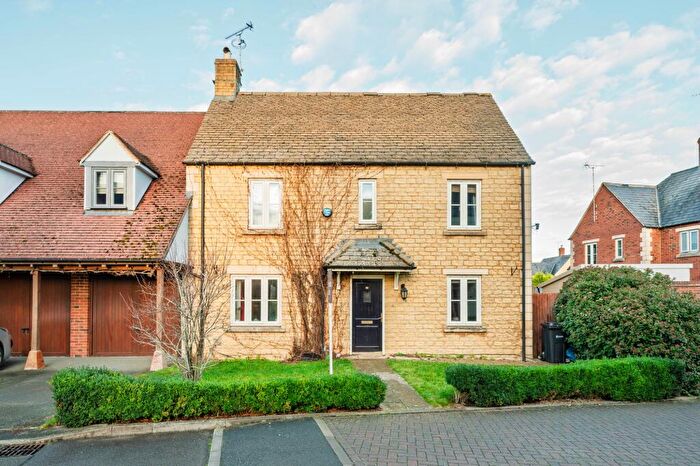
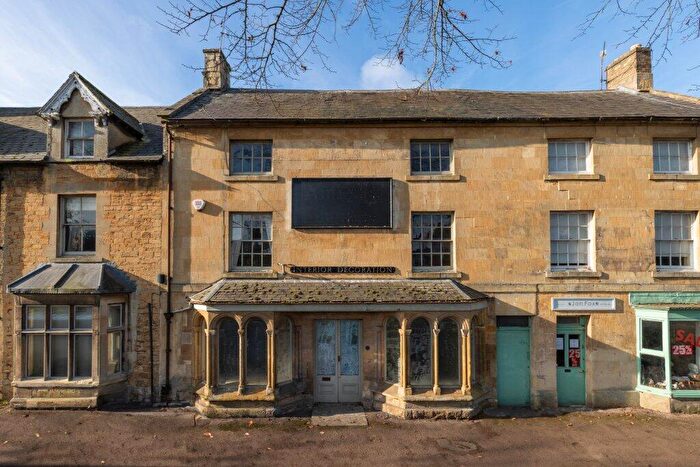
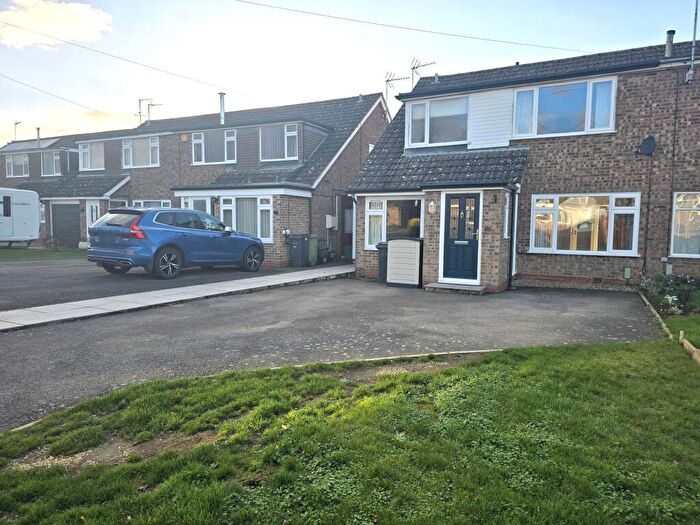
Houses for sale & to rent in Moreton-in-marsh, Moreton-in-marsh
House Prices in Moreton-in-marsh
Properties in Moreton-in-marsh have an average house price of £408,907.00 and had 208 Property Transactions within the last 3 years¹.
Moreton-in-marsh is an area in Moreton-in-marsh, Gloucestershire with 1,513 households², where the most expensive property was sold for £1,945,000.00.
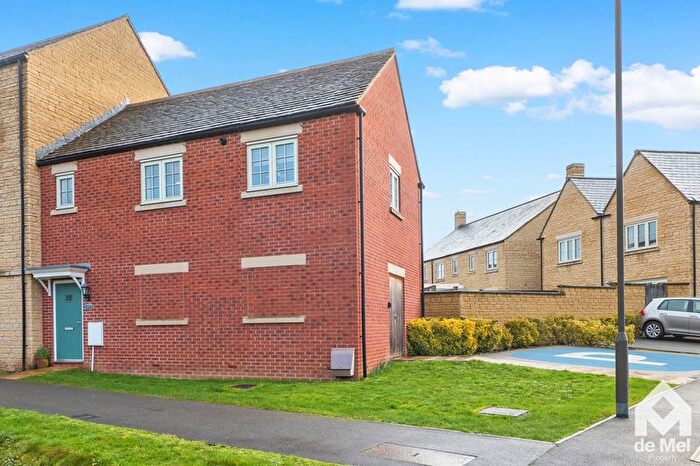
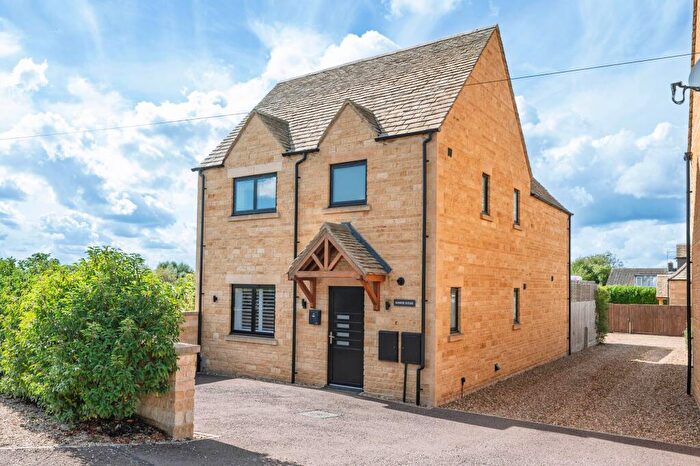
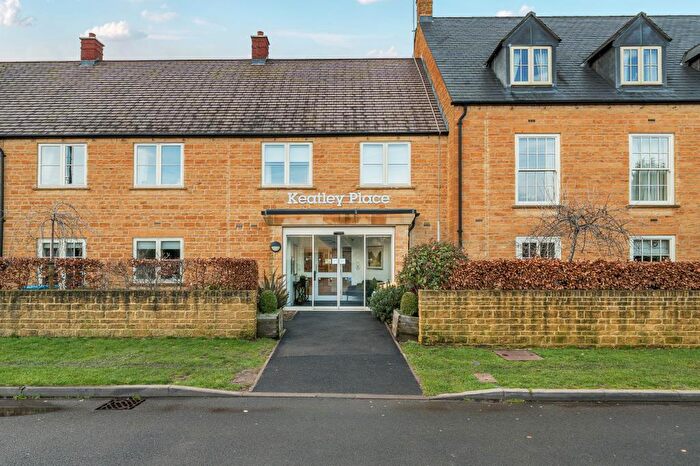
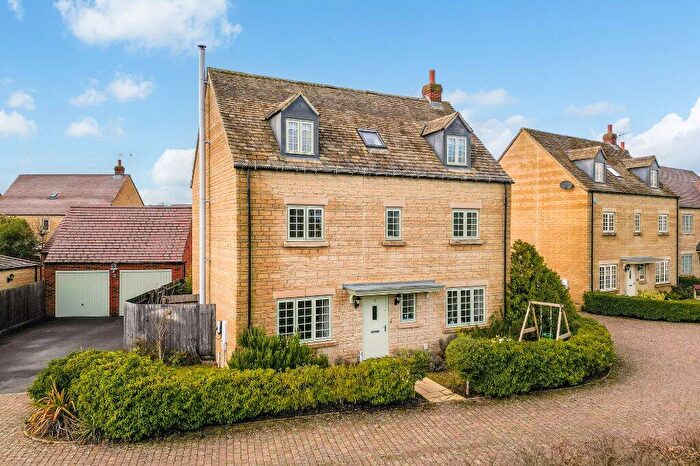
Properties for sale in Moreton-in-marsh
Roads and Postcodes in Moreton-in-marsh
Navigate through our locations to find the location of your next house in Moreton-in-marsh, Moreton-in-marsh for sale or to rent.
| Streets | Postcodes |
|---|---|
| Alpha Terrace | GL56 0BQ |
| Artisan Close | GL56 0DH |
| Beaufort Road | GL56 0GU |
| Beceshore Close | GL56 9NB |
| Blenheim Way | GL56 9NA |
| Bourton Road | GL56 0BD GL56 0BG |
| Bowes Lyon Close | GL56 0EN |
| Bowling Green Court | GL56 0BX |
| Church Street | GL56 0LN GL56 0LT |
| Cicester Terrace | GL56 0HD |
| Corders Close | GL56 0DA |
| Corders Lane | GL56 0BU |
| Cotsmore Close | GL56 0JE |
| Cotswold Gardens | GL56 0ND |
| Croft Holm | GL56 0JH |
| Davies Road | GL56 0HR |
| Dulverton Place | GL56 0HF |
| East Street | GL56 0LQ |
| Errington Road | GL56 0HW |
| Evenlode Gardens | GL56 0JF |
| Evenlode Road | GL56 0HS GL56 0JA GL56 0JB GL56 0JD GL56 0NJ |
| Fairview Terrace | GL56 0HU |
| Fedden Road | GL56 0GE |
| Fosseway Avenue | GL56 0DT GL56 0EA GL56 0EB GL56 0EH |
| Fosseway Close | GL56 0DX |
| Fosseway Drive | GL56 0DU |
| Grays Lane | GL56 0LP |
| Halifax Way | GL56 0GN |
| Hampden Way | GL56 0GT |
| Harvard Close | GL56 0JT |
| Hennemarsh Place | GL56 9NF |
| Hercules Close | GL56 0NB |
| High Street | GL56 0AD GL56 0AF GL56 0AT GL56 0AX GL56 0LH GL56 0LL |
| Hornes Place | GL56 0JX |
| Hospital Road | GL56 0BL GL56 0BN GL56 0BP |
| Keble Road | GL56 0DZ |
| Lemynton View | GL56 9NE |
| London Road | GL56 0HE GL56 0HH |
| London Road Terrace | GL56 0HN |
| Lysander Way | GL56 0GD GL56 0GF |
| Manchester Court | GL56 0BY |
| Mead Close | GL56 0LY |
| Merlin Close | GL56 0HL |
| Meteor Link | GL56 0GQ |
| Mitford Villas | GL56 0HB |
| Mosedale | GL56 0HP |
| New Road | GL56 0AS |
| Nursery Close | GL56 9NH |
| Old Wellington Court | GL56 0FZ |
| Oriel Grove | GL56 0ED |
| Oxford Street | GL56 0LA |
| Parkers Lane | GL56 0DP |
| Peelers Court | GL56 0AG |
| Primrose Court | GL56 0JG |
| Proctor Road | GL56 0GY |
| Radburn Close | GL56 0JP |
| Redesdale Place | GL56 0EF GL56 0EQ |
| Rolph Court | GL56 0EJ |
| Roundhouse Mews | GL56 9ND |
| Sankey Grove | GL56 0DY |
| St Davids Walk | GL56 0LU |
| St Edwards Court | GL56 0EP |
| St Georges Close | GL56 0LX GL56 0LZ |
| St James Court | GL56 0ER |
| St Pauls Court | GL56 0ET |
| St Peters Court | GL56 0ES |
| Station Road | GL56 0DE GL56 0JY |
| Stirling Way | GL56 0GS |
| Stockwells | GL56 0HQ |
| Stow Road | GL56 0DS GL56 0DW |
| Summers Way | GL56 0GA GL56 0GB |
| Sunderland Road | GL56 0JW |
| Swan Close | GL56 0BE |
| The Bungalows | GL56 0EG |
| The Grange | GL56 0AU |
| The Green | GL56 0JZ |
| The Grove | GL56 0JL GL56 0JN |
| Tinkers Close | GL56 0NE |
| Todenham Road | GL56 9NJ |
| Trubshaw Way | GL56 0GX |
| Turnpike Close | GL56 0JJ |
| Turnpike Terrace | GL56 0JR |
| University Farm | GL56 0DN |
| Walnut Close | GL56 0DF |
| Warneford Place | GL56 0LR |
| Wellington Road | GL56 0HZ |
| Wellington Terrace | GL56 0HX |
| Whitley Way | GL56 0GR |
| GL56 0LW |
Transport near Moreton-in-marsh
- FAQ
- Price Paid By Year
- Property Type Price
Frequently asked questions about Moreton-in-marsh
What is the average price for a property for sale in Moreton-in-marsh?
The average price for a property for sale in Moreton-in-marsh is £408,907. This amount is 24% lower than the average price in Moreton-in-marsh. There are 420 property listings for sale in Moreton-in-marsh.
What streets have the most expensive properties for sale in Moreton-in-marsh?
The streets with the most expensive properties for sale in Moreton-in-marsh are Church Street at an average of £1,080,781, Bourton Road at an average of £829,500 and Nursery Close at an average of £685,000.
What streets have the most affordable properties for sale in Moreton-in-marsh?
The streets with the most affordable properties for sale in Moreton-in-marsh are Rolph Court at an average of £192,500, Errington Road at an average of £196,875 and Station Road at an average of £211,666.
Which train stations are available in or near Moreton-in-marsh?
Some of the train stations available in or near Moreton-in-marsh are Moreton-In-Marsh, Kingham and Shipton.
Property Price Paid in Moreton-in-marsh by Year
The average sold property price by year was:
| Year | Average Sold Price | Price Change |
Sold Properties
|
|---|---|---|---|
| 2025 | £419,331 | 5% |
65 Properties |
| 2024 | £397,680 | -3% |
73 Properties |
| 2023 | £410,936 | 1% |
70 Properties |
| 2022 | £406,445 | 12% |
85 Properties |
| 2021 | £355,692 | 5% |
101 Properties |
| 2020 | £339,450 | 10% |
70 Properties |
| 2019 | £303,995 | -1% |
86 Properties |
| 2018 | £308,287 | 2% |
81 Properties |
| 2017 | £302,273 | 6% |
94 Properties |
| 2016 | £284,987 | -0,2% |
109 Properties |
| 2015 | £285,430 | -3% |
127 Properties |
| 2014 | £294,785 | 11% |
183 Properties |
| 2013 | £263,232 | -1% |
112 Properties |
| 2012 | £266,141 | 11% |
94 Properties |
| 2011 | £238,041 | 3% |
65 Properties |
| 2010 | £232,072 | -1% |
82 Properties |
| 2009 | £234,135 | 4% |
90 Properties |
| 2008 | £224,820 | -9% |
81 Properties |
| 2007 | £245,420 | -9% |
85 Properties |
| 2006 | £266,476 | 7% |
112 Properties |
| 2005 | £247,089 | 15% |
128 Properties |
| 2004 | £209,202 | -2% |
114 Properties |
| 2003 | £212,722 | 9% |
82 Properties |
| 2002 | £194,166 | 37% |
87 Properties |
| 2001 | £122,558 | 10% |
65 Properties |
| 2000 | £110,099 | -9% |
86 Properties |
| 1999 | £120,192 | 17% |
69 Properties |
| 1998 | £99,864 | 14% |
59 Properties |
| 1997 | £86,183 | 16% |
96 Properties |
| 1996 | £72,405 | -15% |
83 Properties |
| 1995 | £83,183 | - |
73 Properties |
Property Price per Property Type in Moreton-in-marsh
Here you can find historic sold price data in order to help with your property search.
The average Property Paid Price for specific property types in the last three years are:
| Property Type | Average Sold Price | Sold Properties |
|---|---|---|
| Semi Detached House | £368,125.00 | 59 Semi Detached Houses |
| Detached House | £591,562.00 | 62 Detached Houses |
| Terraced House | £371,594.00 | 53 Terraced Houses |
| Flat | £204,764.00 | 34 Flats |

