Houses for sale & to rent in Newent Central, Newent
House Prices in Newent Central
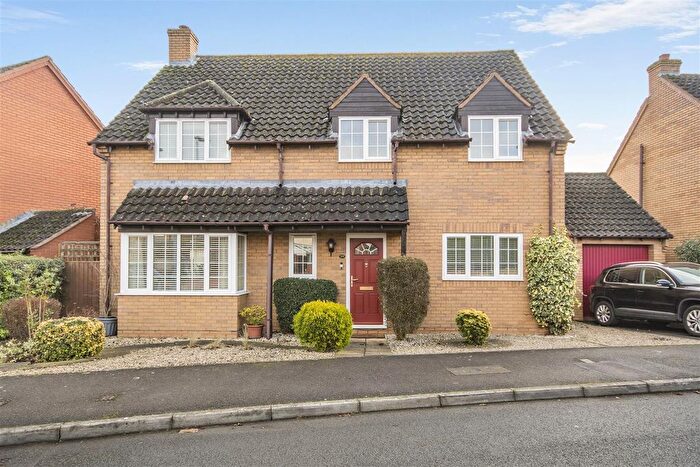
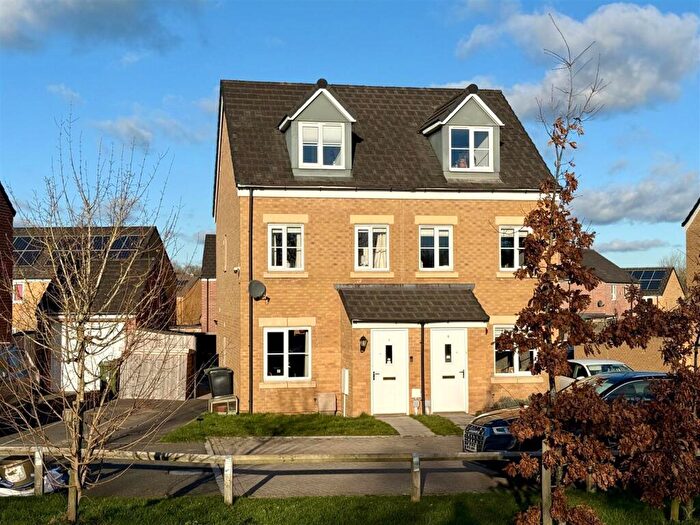
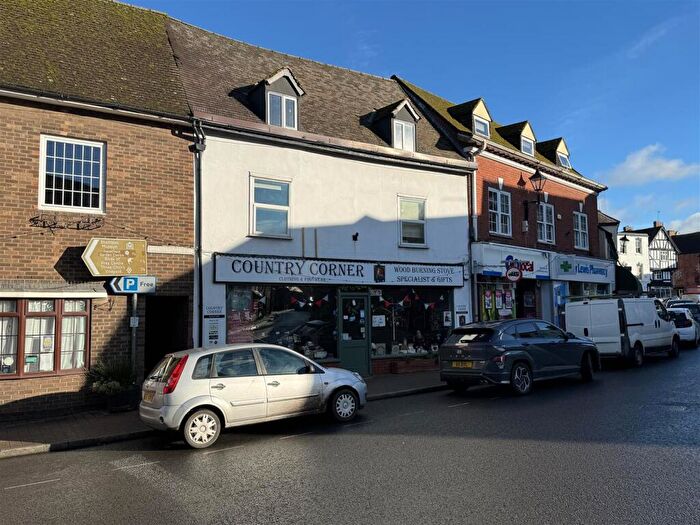
Properties in Newent Central have an average house price of £261,446.00 and had 190 Property Transactions within the last 3 years¹.
Newent Central is an area in Newent, Gloucestershire with 1,506 households², where the most expensive property was sold for £910,000.00.
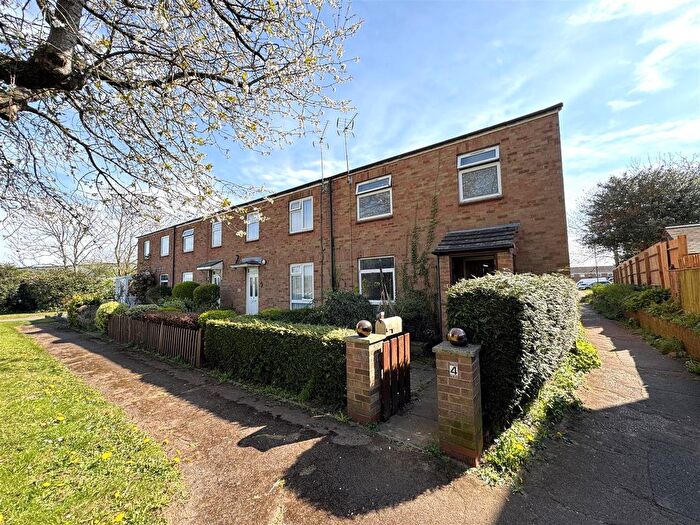
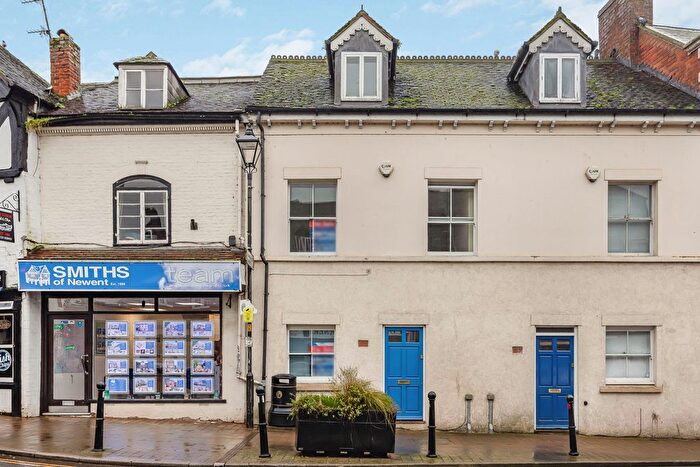
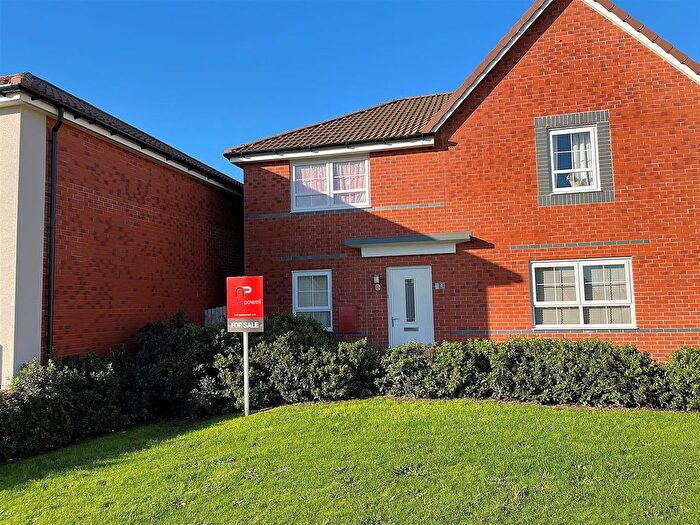
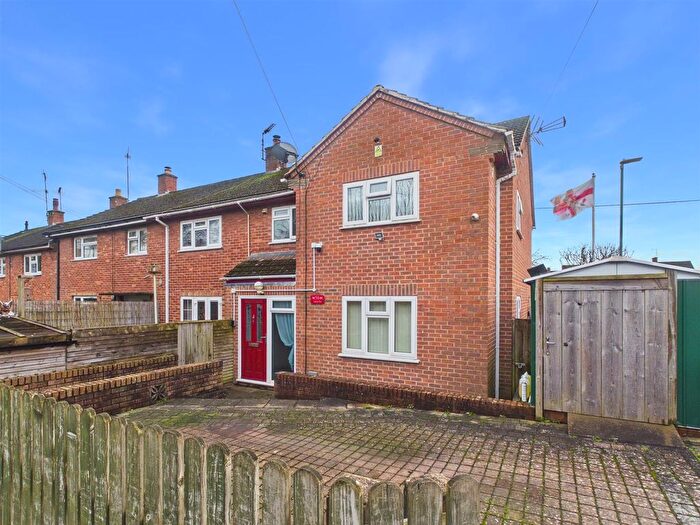
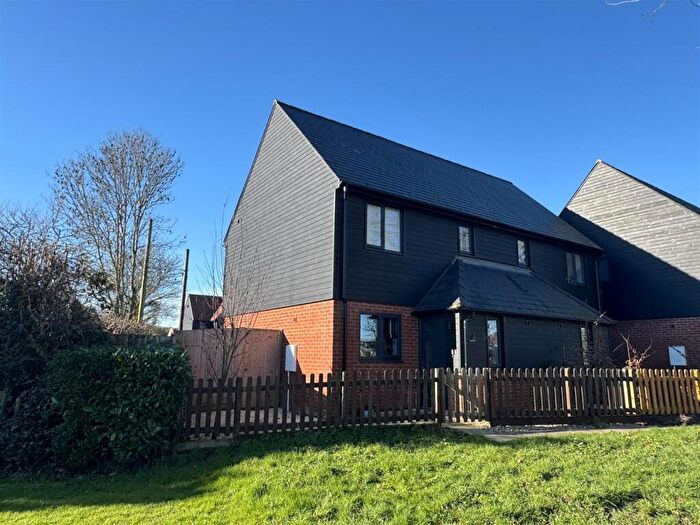
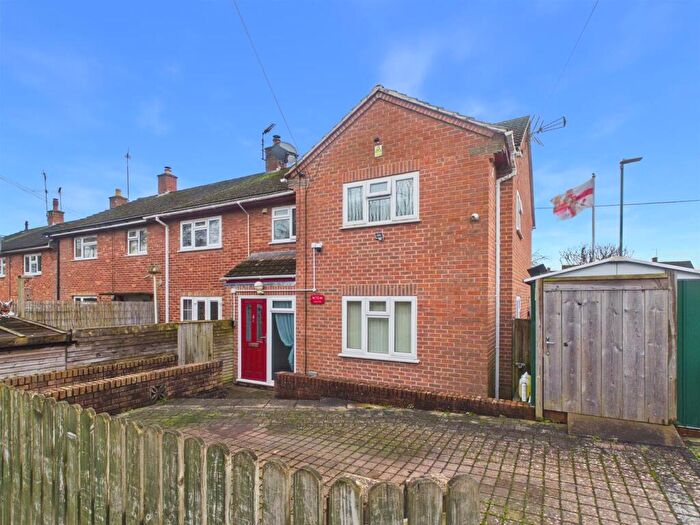
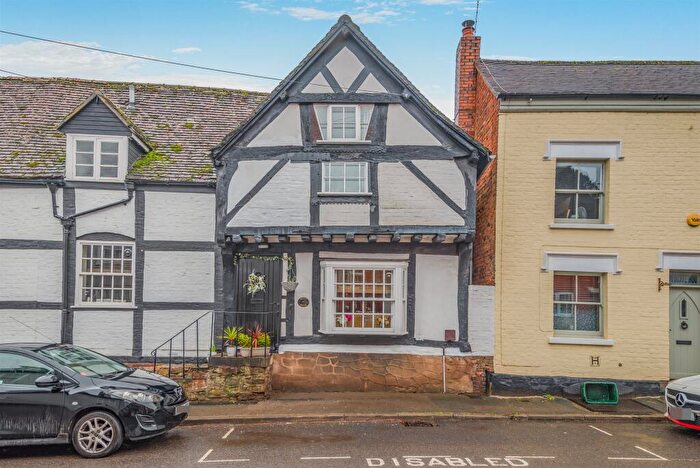
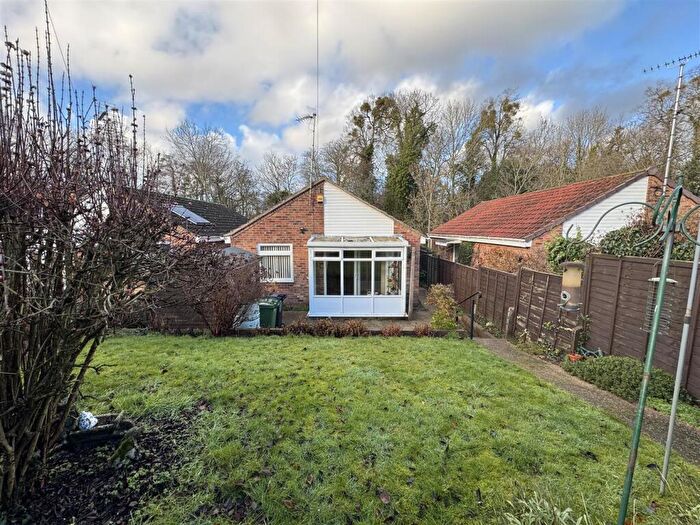
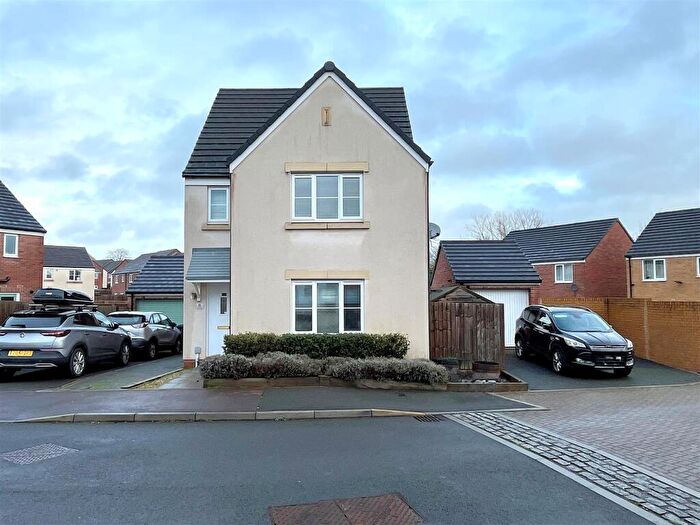
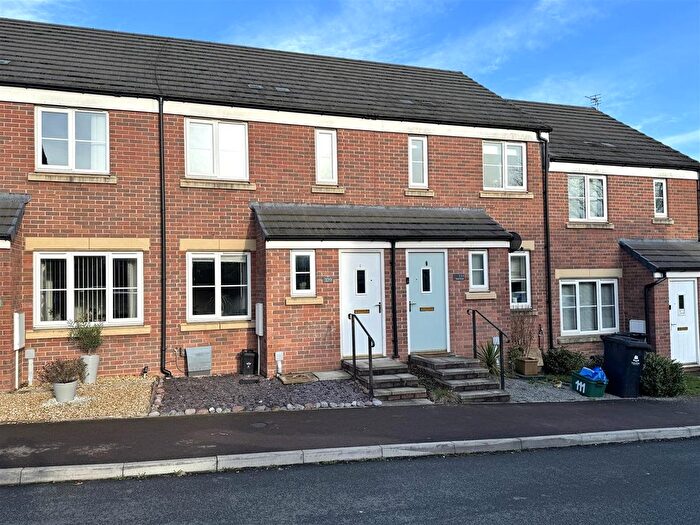
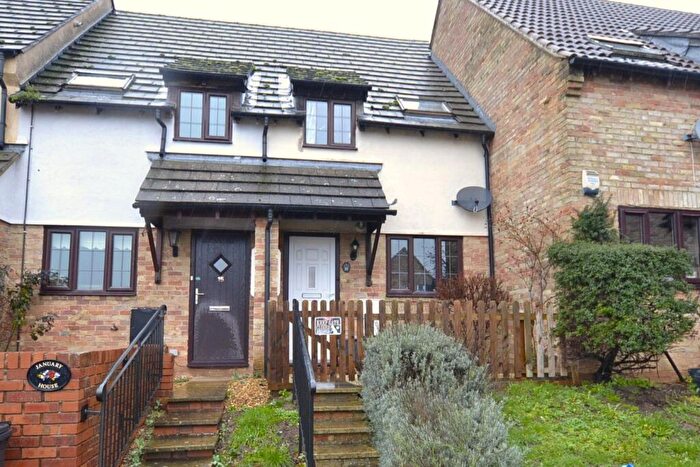
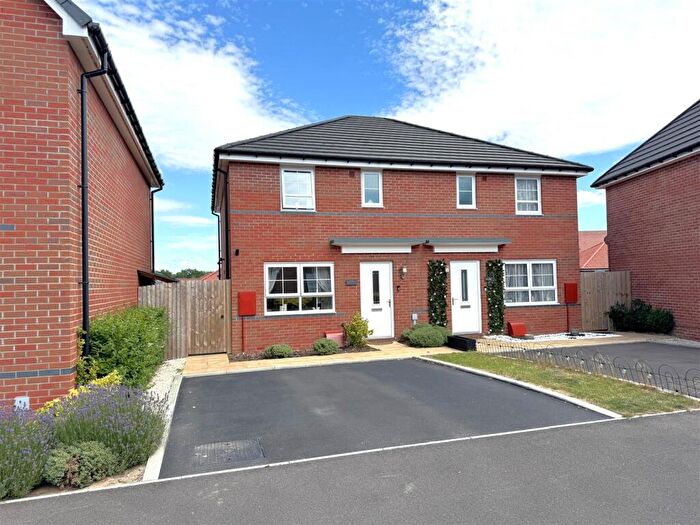
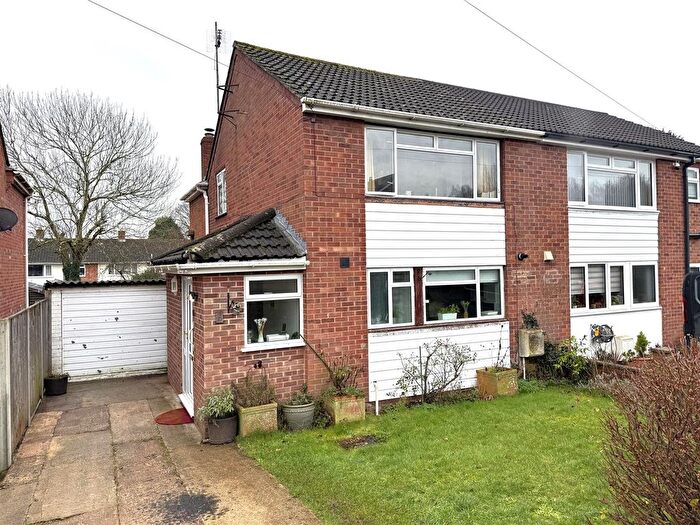
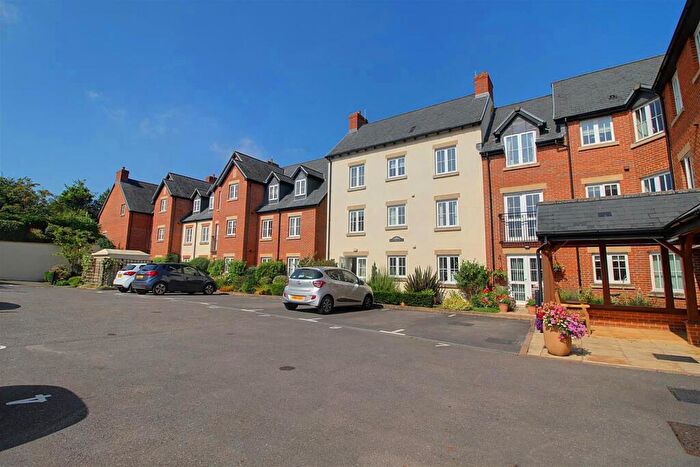
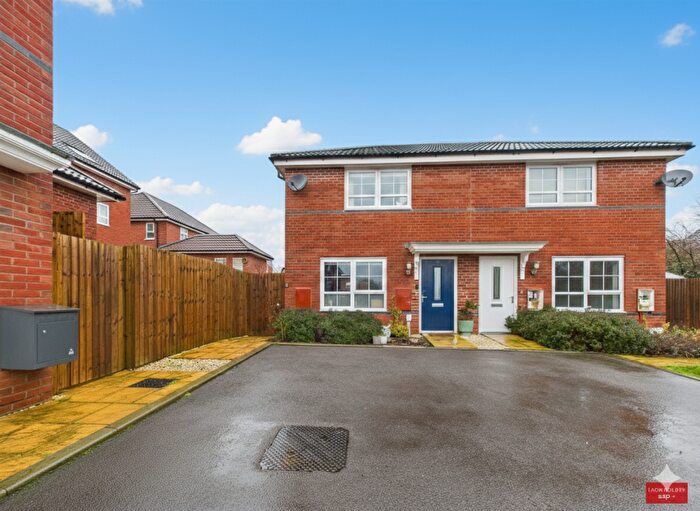
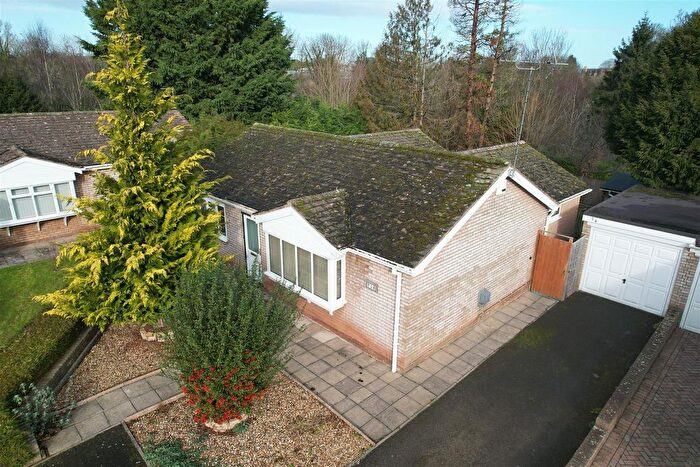
Properties for sale in Newent Central
Roads and Postcodes in Newent Central
Navigate through our locations to find the location of your next house in Newent Central, Newent for sale or to rent.
| Streets | Postcodes |
|---|---|
| Akermans Orchard | GL18 1QD |
| Ayland Close | GL18 1TB |
| Barton Court | GL18 1AW |
| Blenheim Drive | GL18 1TU |
| Boughton Way | GL18 1UH |
| Bradfords Close | GL18 1QW |
| Bradfords Court | GL18 1RF |
| Bradfords Lane | GL18 1QS |
| Broad Street | GL18 1AJ GL18 1AQ |
| Brookside | GL18 1RB |
| Bury Bar | GL18 1PT |
| Chedworth | GL18 1SE |
| Cherry Bank | GL18 1JZ |
| Church Street | GL18 1AA GL18 1AB GL18 1AD GL18 1AP GL18 1PP GL18 1PU |
| Connemara Close | GL18 1LA |
| Cooks Place | GL18 1TR |
| Coopers Way | GL18 1TJ |
| Court Lane | GL18 1AR |
| Craddock Road | GL18 1RA |
| Culver Street | GL18 1DA GL18 1DB GL18 1JA GL18 1JE |
| Daffodil Court | GL18 1TY |
| Drovers Way | GL18 1ET |
| Foley Road | GL18 1SP GL18 1SR GL18 1SS GL18 1ST |
| Freemans Orchard | GL18 1TX |
| Glebe Close | GL18 1BH GL18 1BQ |
| Glebe Court | GL18 1DU |
| Glebe Road | GL18 1BJ GL18 1BN GL18 1BP GL18 1BS GL18 1BW |
| Glebe Way | GL18 1BL |
| Gloucester Street | GL18 1AF |
| Graces Pitch | GL18 1SU |
| High Street | GL18 1AN GL18 1AS GL18 1AU GL18 1AY |
| Hills View | GL18 1SG |
| Holts Road | GL18 1BT |
| Holts Terrace | GL18 1BY |
| Johnstone Road | GL18 1PZ |
| Knights Crescent | GL18 1QN |
| Knights Way | GL18 1QJ GL18 1QL |
| Lightfoot | GL18 1SB |
| Market Square | GL18 1PS |
| May Hill View | GL18 1UB |
| Meek Road | GL18 1DX GL18 1UA |
| Nanfan & Dobyn Place | GL18 1TF |
| Newlands Court | GL18 1RY |
| Oak Tree Way | GL18 1UD |
| Onslow Road | GL18 1SA GL18 1TL |
| Peacock Close | GL18 1RD |
| Peacock Gardens | GL18 1RE |
| Perry Close | GL18 1TP |
| Pippin Close | GL18 1TW |
| Reevers Road | GL18 1TN |
| Russett Way | GL18 1TS |
| Southend Lane | GL18 1JD |
| Stokes Mews | GL18 1EU |
| The Crease | GL18 1SX |
| The Ryelands | GL18 1UE |
| The Tythings | GL18 1QQ |
| Tything Crescent | GL18 1QH |
| Tything Mews | GL18 1PW |
| Vauxhall | GL18 1QP |
| Waterloo Terrace | GL18 1BU |
| Watery Lane | GL18 1PY GL18 1QA GL18 1QE GL18 1QG |
| West View | GL18 1TE |
| Whitegates | GL18 1JB |
| Winfield | GL18 1QB |
| GL18 1JH |
Transport near Newent Central
-
Ledbury Station
-
Gloucester Station
-
Colwall Station
-
Great Malvern Station
-
Cheltenham Spa Station
-
Ashchurch Station
-
Stonehouse Station
-
Malvern Link Station
-
Cam and Dursley Station
- FAQ
- Price Paid By Year
- Property Type Price
Frequently asked questions about Newent Central
What is the average price for a property for sale in Newent Central?
The average price for a property for sale in Newent Central is £261,446. This amount is 16% lower than the average price in Newent. There are 506 property listings for sale in Newent Central.
What streets have the most expensive properties for sale in Newent Central?
The streets with the most expensive properties for sale in Newent Central are Cherry Bank at an average of £525,000, Gloucester Street at an average of £519,000 and High Street at an average of £442,833.
What streets have the most affordable properties for sale in Newent Central?
The streets with the most affordable properties for sale in Newent Central are Newlands Court at an average of £90,000, Daffodil Court at an average of £107,739 and Stokes Mews at an average of £132,500.
Which train stations are available in or near Newent Central?
Some of the train stations available in or near Newent Central are Ledbury, Gloucester and Colwall.
Property Price Paid in Newent Central by Year
The average sold property price by year was:
| Year | Average Sold Price | Price Change |
Sold Properties
|
|---|---|---|---|
| 2025 | £256,489 | -2% |
62 Properties |
| 2024 | £261,071 | -2% |
71 Properties |
| 2023 | £267,305 | 1% |
57 Properties |
| 2022 | £265,556 | 2% |
79 Properties |
| 2021 | £258,952 | 14% |
101 Properties |
| 2020 | £222,444 | 8% |
70 Properties |
| 2019 | £205,543 | -3% |
67 Properties |
| 2018 | £211,323 | 1% |
82 Properties |
| 2017 | £208,202 | 6% |
95 Properties |
| 2016 | £196,519 | 6% |
101 Properties |
| 2015 | £184,667 | -2% |
83 Properties |
| 2014 | £187,825 | 5% |
112 Properties |
| 2013 | £179,314 | -1% |
98 Properties |
| 2012 | £180,600 | -9% |
77 Properties |
| 2011 | £196,719 | 3% |
98 Properties |
| 2010 | £190,100 | 15% |
81 Properties |
| 2009 | £161,425 | -23% |
56 Properties |
| 2008 | £198,615 | 7% |
49 Properties |
| 2007 | £184,522 | 1% |
88 Properties |
| 2006 | £182,624 | 15% |
88 Properties |
| 2005 | £155,706 | -20% |
58 Properties |
| 2004 | £186,980 | 30% |
63 Properties |
| 2003 | £130,753 | 13% |
77 Properties |
| 2002 | £114,058 | 20% |
93 Properties |
| 2001 | £90,931 | 8% |
77 Properties |
| 2000 | £83,276 | 4% |
68 Properties |
| 1999 | £79,825 | 16% |
99 Properties |
| 1998 | £67,279 | 8% |
62 Properties |
| 1997 | £61,644 | 2% |
79 Properties |
| 1996 | £60,562 | -6% |
75 Properties |
| 1995 | £64,406 | - |
63 Properties |
Property Price per Property Type in Newent Central
Here you can find historic sold price data in order to help with your property search.
The average Property Paid Price for specific property types in the last three years are:
| Property Type | Average Sold Price | Sold Properties |
|---|---|---|
| Semi Detached House | £258,376.00 | 69 Semi Detached Houses |
| Detached House | £401,390.00 | 38 Detached Houses |
| Terraced House | £229,526.00 | 62 Terraced Houses |
| Flat | £112,540.00 | 21 Flats |

