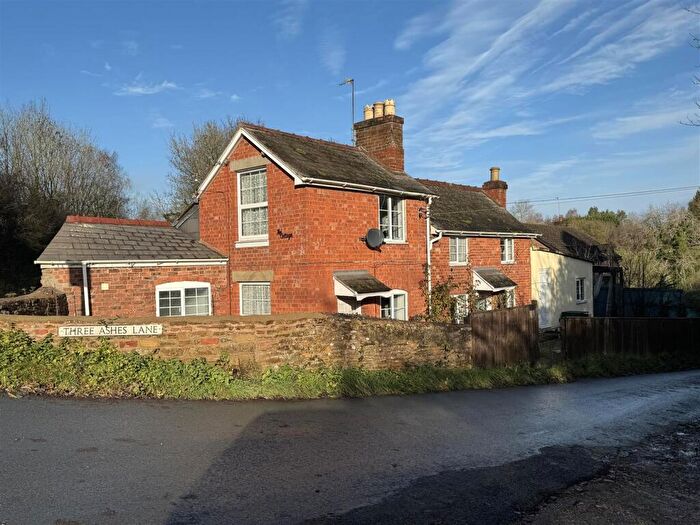
Houses for sale & to rent in Oxenhall And Newent North East, Newent
House Prices in Oxenhall And Newent North East
Properties in Oxenhall And Newent North East have an average house price of £423,353.00 and had 70 Property Transactions within the last 3 years¹.
Oxenhall And Newent North East is an area in Newent, Gloucestershire with 587 households², where the most expensive property was sold for £1,650,000.00.
Properties for sale in Oxenhall And Newent North East
Roads and Postcodes in Oxenhall And Newent North East
Navigate through our locations to find the location of your next house in Oxenhall And Newent North East, Newent for sale or to rent.
| Streets | Postcodes |
|---|---|
| Aston Ingham Road | GL18 1NP |
| Birches Lane | GL18 1DN |
| Blue Lane | GL18 1NG |
| Botloes Green | GL18 1DW |
| Bradfords Lane | GL18 1QT |
| Briery Hill Lane | GL18 1NH |
| Cleeve Mill Business Park | GL18 1EP |
| Cleeve Rise | GL18 1BZ |
| Cold Harbour Lane | GL18 1DJ |
| Court Road | GL18 1SL GL18 1SN GL18 1SY |
| Croft Close | GL18 1RQ |
| Croft Road | GL18 1SW |
| Ford House Road | GL18 1LQ |
| Ford Lane | GL18 1NW |
| Friars Walk | GL18 1TG |
| Furnace Lane | GL18 1DD |
| Golden Valley | GL18 1HN |
| Hill View Lane | GL18 1GG |
| Hooks Lane | GL18 1HW |
| Horse Fair Lane | GL18 1RG |
| Kews Lane | GL18 1GH |
| Kilcot Hill | GL18 1NJ |
| Kilcot Lane | GL18 1NQ |
| Kilcott Cross | GL18 1NN |
| Lakeside | GL18 1SZ GL18 1TA |
| Lancaster Terrace | GL18 1EA |
| Ledbury Road | GL18 1DE GL18 1DL |
| Mill Lane | GL18 1NX |
| Okle Green | GL18 1HT |
| Redmarley Road | GL18 1DR GL18 1LJ |
| Robinson Close | GL18 1TQ |
| Ross Road | GL18 1BD GL18 1BE GL18 1BG GL18 1NA GL18 1QX GL18 1QY |
| Shaw Common | GL18 1RW |
| Station Road | GL18 1BB |
| Stoney Road | GL18 1PB |
| Stony Lane | GL18 1NL |
| Strawberry Hill | GL18 1LH |
| Tewkesbury Road | GL18 1LG |
| The Butts | GL18 1SH GL18 1SJ |
| The Crofts | GL18 1SQ |
| The Scarr | GL18 1DQ |
| Three Ashes Lane | GL18 1DF GL18 1DG |
| Wyatt's Lane | GL18 1GL |
| GL18 1EB GL18 1ED GL18 1HD GL18 1HE GL18 1HF GL18 1RH GL18 1RN |
Transport near Oxenhall And Newent North East
-
Ledbury Station
-
Gloucester Station
-
Colwall Station
-
Great Malvern Station
-
Cheltenham Spa Station
-
Ashchurch Station
-
Malvern Link Station
-
Stonehouse Station
- FAQ
- Price Paid By Year
- Property Type Price
Frequently asked questions about Oxenhall And Newent North East
What is the average price for a property for sale in Oxenhall And Newent North East?
The average price for a property for sale in Oxenhall And Newent North East is £423,353. This amount is 35% higher than the average price in Newent. There are 727 property listings for sale in Oxenhall And Newent North East.
What streets have the most expensive properties for sale in Oxenhall And Newent North East?
The streets with the most expensive properties for sale in Oxenhall And Newent North East are Golden Valley at an average of £1,295,000, Kilcot Lane at an average of £830,000 and Shaw Common at an average of £580,000.
What streets have the most affordable properties for sale in Oxenhall And Newent North East?
The streets with the most affordable properties for sale in Oxenhall And Newent North East are The Crofts at an average of £190,090, The Butts at an average of £232,241 and Croft Close at an average of £237,500.
Which train stations are available in or near Oxenhall And Newent North East?
Some of the train stations available in or near Oxenhall And Newent North East are Ledbury, Gloucester and Colwall.
Property Price Paid in Oxenhall And Newent North East by Year
The average sold property price by year was:
| Year | Average Sold Price | Price Change |
Sold Properties
|
|---|---|---|---|
| 2025 | £359,750 | -38% |
10 Properties |
| 2024 | £497,726 | 26% |
15 Properties |
| 2023 | £368,384 | -24% |
22 Properties |
| 2022 | £455,082 | 11% |
23 Properties |
| 2021 | £404,149 | 23% |
25 Properties |
| 2020 | £311,861 | 7% |
22 Properties |
| 2019 | £291,181 | -29% |
22 Properties |
| 2018 | £375,798 | 15% |
15 Properties |
| 2017 | £319,291 | 12% |
17 Properties |
| 2016 | £281,236 | 16% |
19 Properties |
| 2015 | £235,429 | -12% |
15 Properties |
| 2014 | £264,146 | 9% |
32 Properties |
| 2013 | £241,608 | -14% |
23 Properties |
| 2012 | £274,643 | -2% |
24 Properties |
| 2011 | £279,975 | 12% |
20 Properties |
| 2010 | £246,114 | -5% |
17 Properties |
| 2009 | £258,795 | -17% |
22 Properties |
| 2008 | £301,805 | 6% |
17 Properties |
| 2007 | £284,095 | 11% |
26 Properties |
| 2006 | £251,913 | 7% |
23 Properties |
| 2005 | £233,543 | 14% |
23 Properties |
| 2004 | £200,827 | -6% |
27 Properties |
| 2003 | £211,913 | 7% |
30 Properties |
| 2002 | £197,392 | 29% |
28 Properties |
| 2001 | £140,716 | 9% |
30 Properties |
| 2000 | £127,716 | 5% |
18 Properties |
| 1999 | £121,210 | 22% |
23 Properties |
| 1998 | £94,965 | 5% |
18 Properties |
| 1997 | £90,383 | 5% |
30 Properties |
| 1996 | £86,132 | 5% |
29 Properties |
| 1995 | £81,481 | - |
19 Properties |
Property Price per Property Type in Oxenhall And Newent North East
Here you can find historic sold price data in order to help with your property search.
The average Property Paid Price for specific property types in the last three years are:
| Property Type | Average Sold Price | Sold Properties |
|---|---|---|
| Semi Detached House | £260,993.00 | 15 Semi Detached Houses |
| Detached House | £490,099.00 | 49 Detached Houses |
| Terraced House | £301,225.00 | 2 Terraced Houses |
| Flat | £275,625.00 | 4 Flats |

