
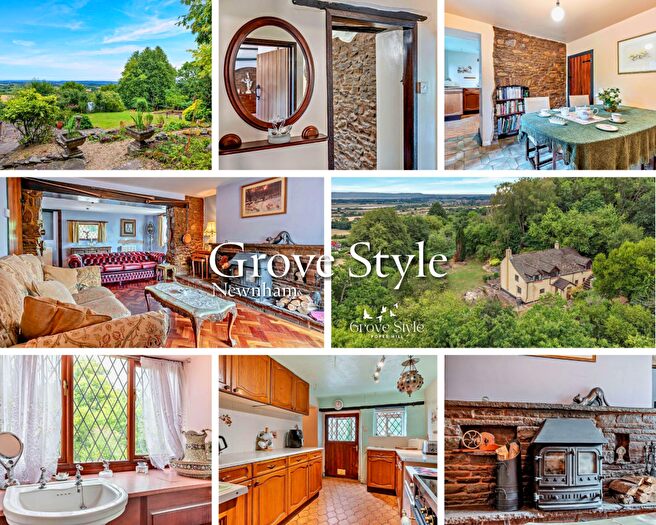
Houses for sale & to rent in Littledean And Ruspidge, Newnham
House Prices in Littledean And Ruspidge
Properties in Littledean And Ruspidge have an average house price of £502k and had 5 Property Transactions within the last 3 years¹.
Littledean And Ruspidge is an area in Newnham, Gloucestershire with 82 households², where the most expensive property was sold for £645k.
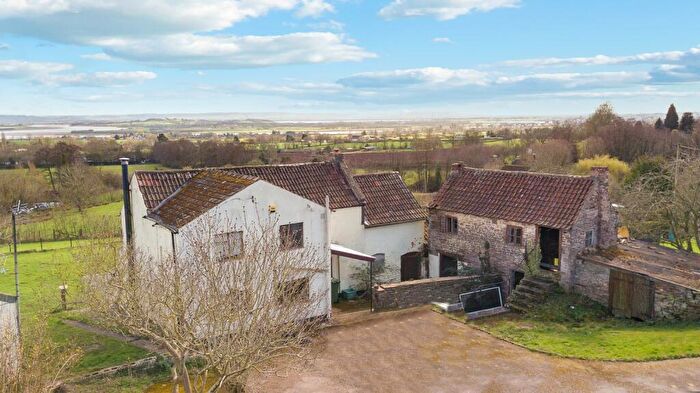
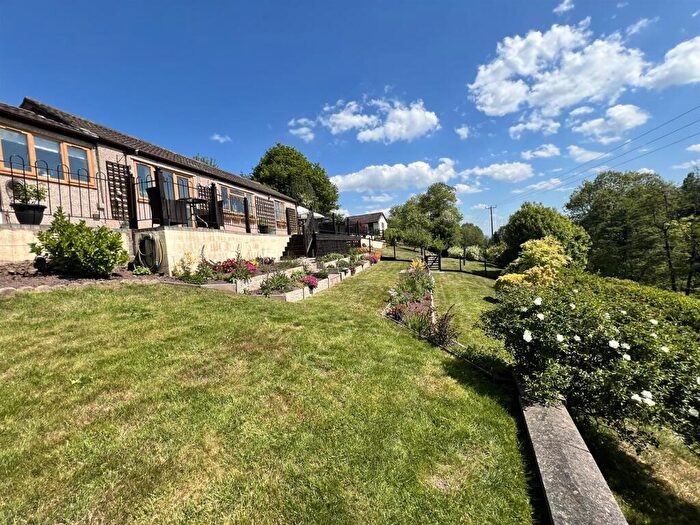
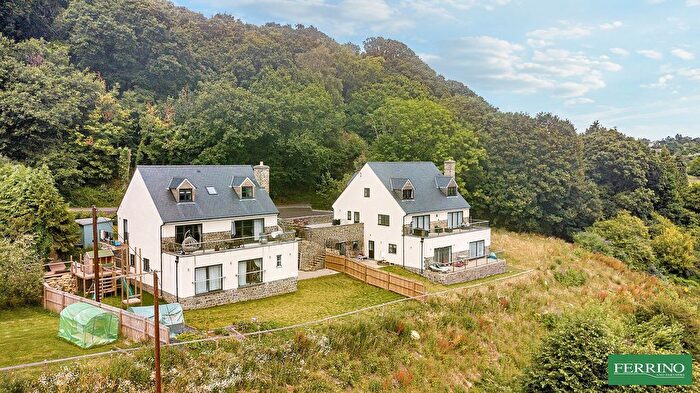
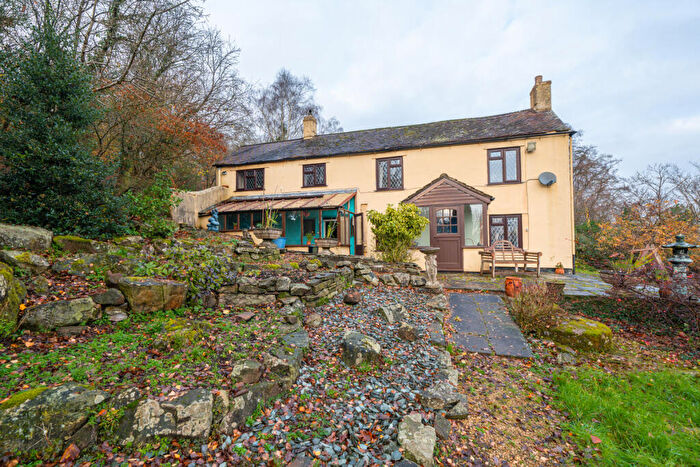
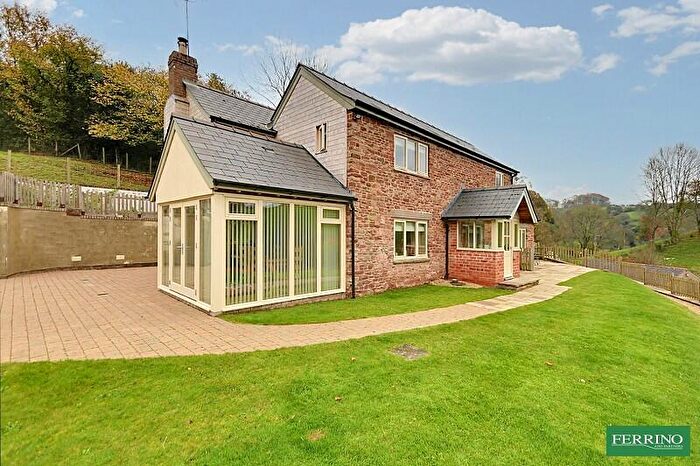
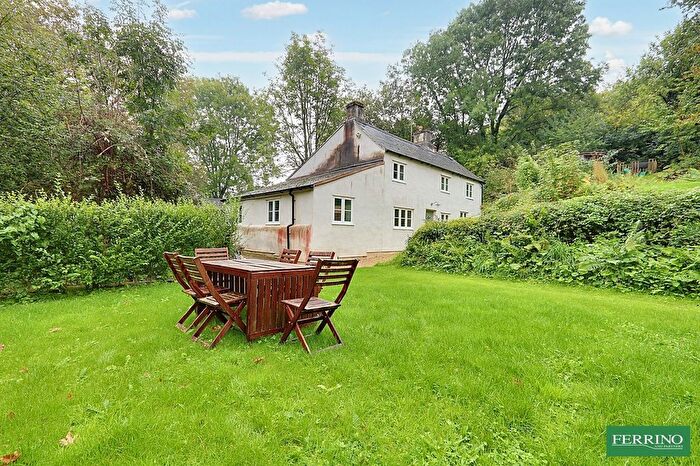
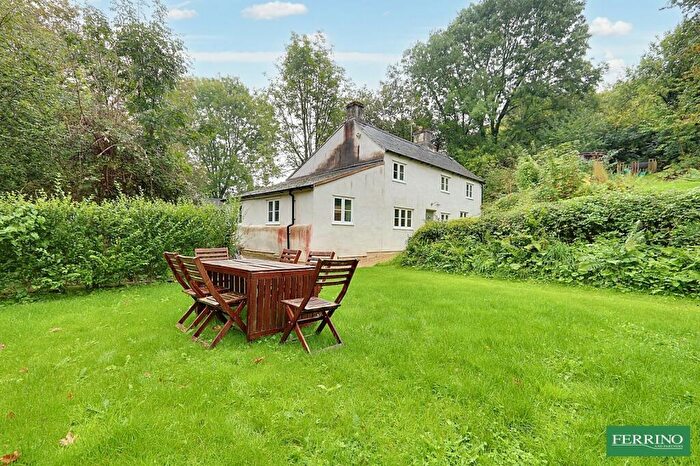
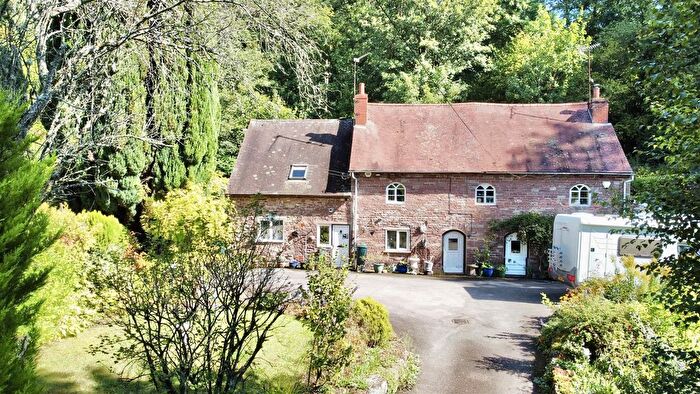
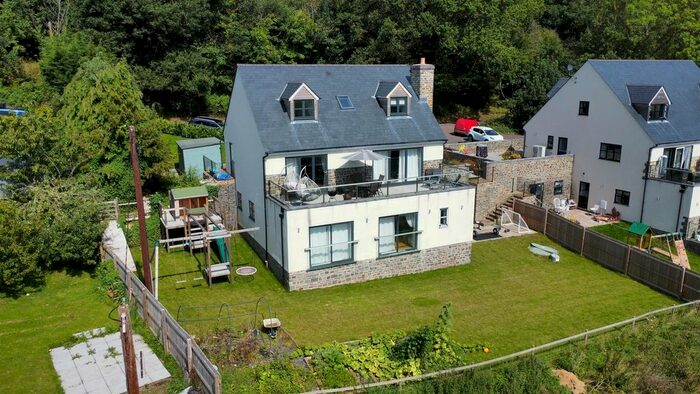
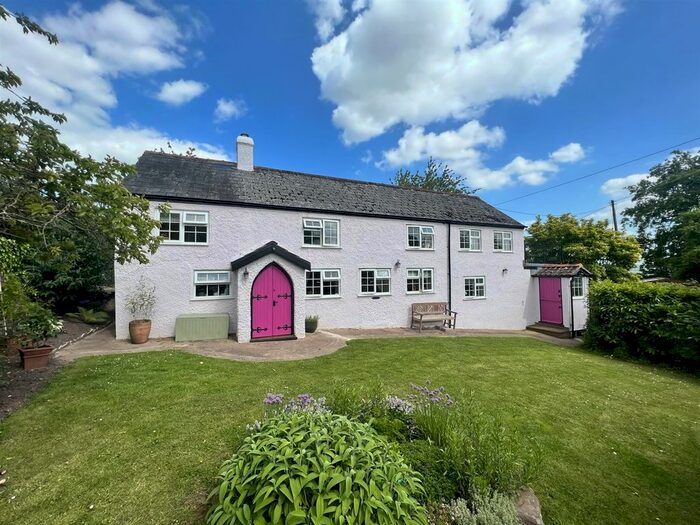
Properties for sale in Littledean And Ruspidge
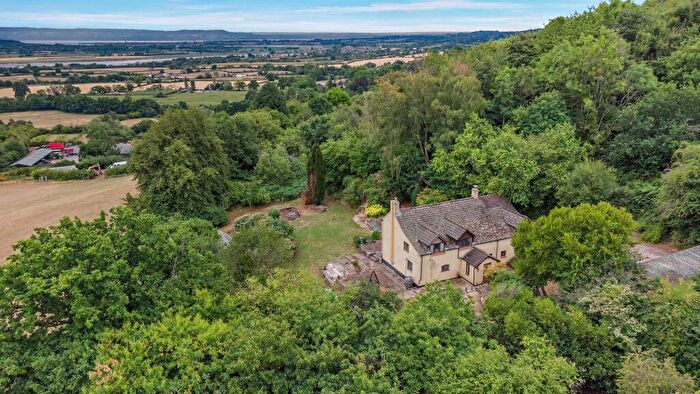
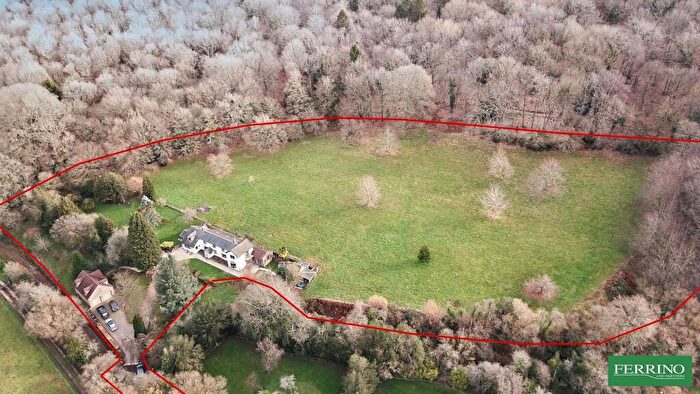
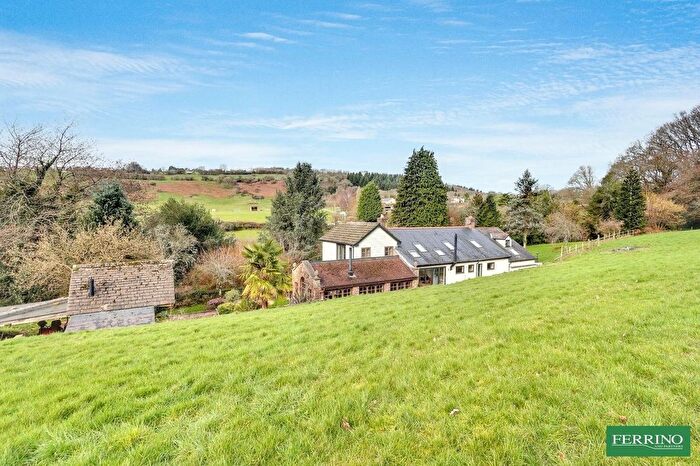
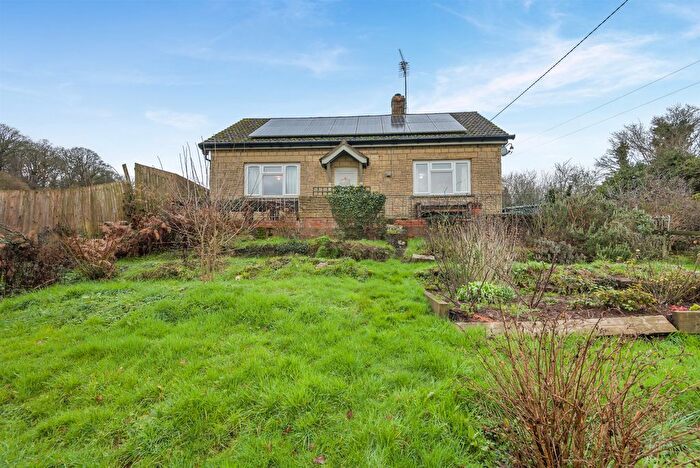
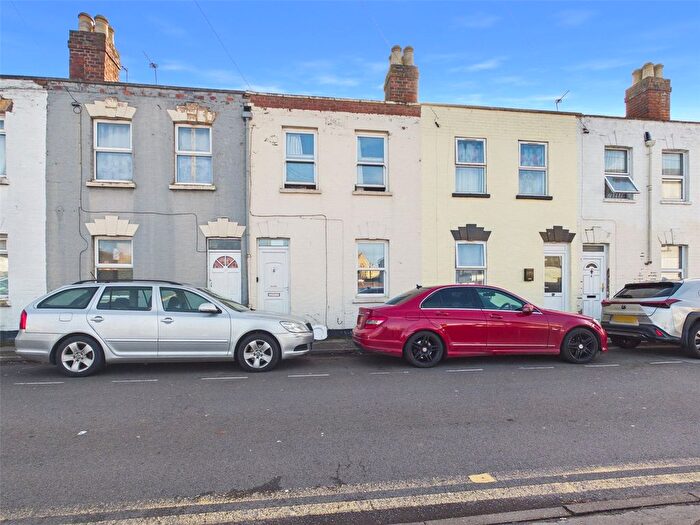
Previously listed properties in Littledean And Ruspidge

![]()
If you are looking to sell your house, let it out, or receive a property valuation, an expert can help you.
Click the button below to get started.


Roads and Postcodes in Littledean And Ruspidge
Navigate through our locations to find the location of your next house in Littledean And Ruspidge, Newnham for sale or to rent.
| Streets | Postcodes |
|---|---|
| Littledean Road | GL14 1JY |
| New Road | GL14 1JT |
| Popes Hill | GL14 1LD GL14 1LE |
| The Slad | GL14 1JX GL14 1JZ GL14 1LA GL14 1LB |
Transport near Littledean And Ruspidge

- FAQ
- Price Paid By Year
- Property Type Price
Frequently asked questions about Littledean And Ruspidge
What is the average price for a property for sale in Littledean And Ruspidge?
The average price for a property for sale in Littledean And Ruspidge is £501,500. This amount is 49% higher than the average price in Newnham. There are 34 property listings for sale in Littledean And Ruspidge.
What streets have the most expensive properties for sale in Littledean And Ruspidge?
The streets with the most expensive properties for sale in Littledean And Ruspidge are The Slad at an average of £645,000 and Popes Hill at an average of £525,000.
What streets have the most affordable properties for sale in Littledean And Ruspidge?
The street with the most affordable properties for sale in Littledean And Ruspidge is Littledean Road at an average of £282,500.
Which train stations are available in or near Littledean And Ruspidge?
Some of the train stations available in or near Littledean And Ruspidge are Lydney, Cam and Dursley and Stonehouse.
Property Price Paid in Littledean And Ruspidge by Year
The average sold property price by year was:
| Year | Average Sold Price | Price Change |
Sold Properties
|
|---|---|---|---|
| 2025 | £622,500 | 41% |
2 Properties |
| 2024 | £366,250 | -45% |
2 Properties |
| 2023 | £530,000 | 7% |
1 Property |
| 2022 | £492,400 | 10% |
5 Properties |
| 2021 | £442,142 | -15% |
7 Properties |
| 2020 | £509,375 | 30% |
4 Properties |
| 2019 | £356,250 | -33% |
2 Properties |
| 2018 | £472,500 | 17% |
2 Properties |
| 2017 | £393,750 | 28% |
2 Properties |
| 2016 | £283,333 | 20% |
3 Properties |
| 2015 | £227,500 | -80% |
2 Properties |
| 2014 | £410,000 | 48% |
2 Properties |
| 2013 | £214,750 | -81% |
4 Properties |
| 2012 | £389,000 | 69% |
2 Properties |
| 2010 | £122,500 | -204% |
1 Property |
| 2008 | £372,500 | 41% |
2 Properties |
| 2007 | £219,700 | -67% |
4 Properties |
| 2006 | £366,250 | 37% |
2 Properties |
| 2005 | £232,083 | -29% |
6 Properties |
| 2004 | £300,240 | 15% |
5 Properties |
| 2003 | £255,000 | 20% |
2 Properties |
| 2002 | £204,333 | 1% |
3 Properties |
| 2001 | £202,250 | 13% |
2 Properties |
| 2000 | £175,000 | 17% |
1 Property |
| 1999 | £144,833 | -62% |
3 Properties |
| 1998 | £235,000 | 68% |
1 Property |
| 1997 | £75,135 | -39% |
7 Properties |
| 1996 | £104,625 | -14% |
4 Properties |
| 1995 | £119,625 | - |
4 Properties |
Property Price per Property Type in Littledean And Ruspidge
Here you can find historic sold price data in order to help with your property search.
The average Property Paid Price for specific property types in the last three years are:
| Property Type | Average Sold Price | Sold Properties |
|---|---|---|
| Semi Detached House | £282,500.00 | 1 Semi Detached House |
| Detached House | £556,250.00 | 4 Detached Houses |