
Houses for sale in Uplands, Stroud
House Prices in Uplands
Properties in Uplands have an average house price of £337k and had 81 Property Transactions within the last 3 years¹.
Uplands is an area in Stroud, Gloucestershire with 890 households², where the most expensive property was sold for £775k.
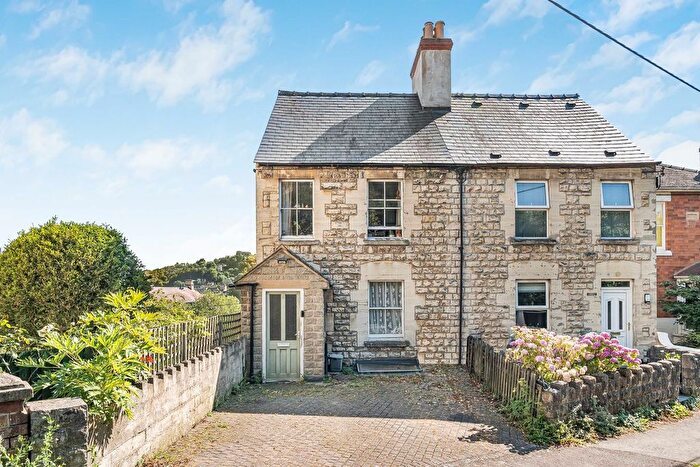
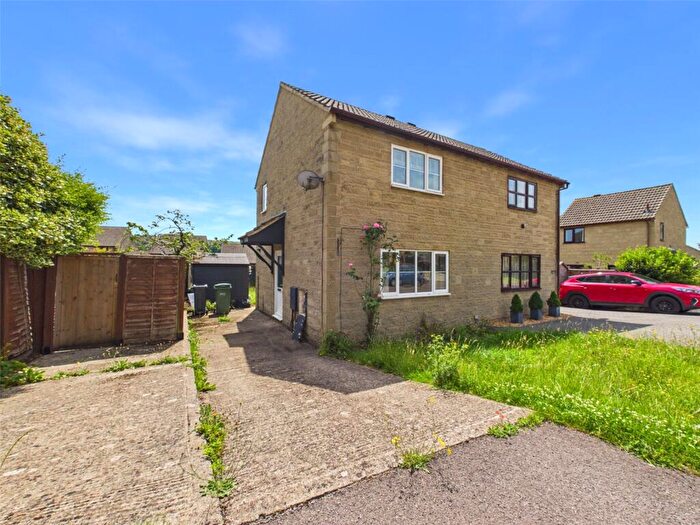
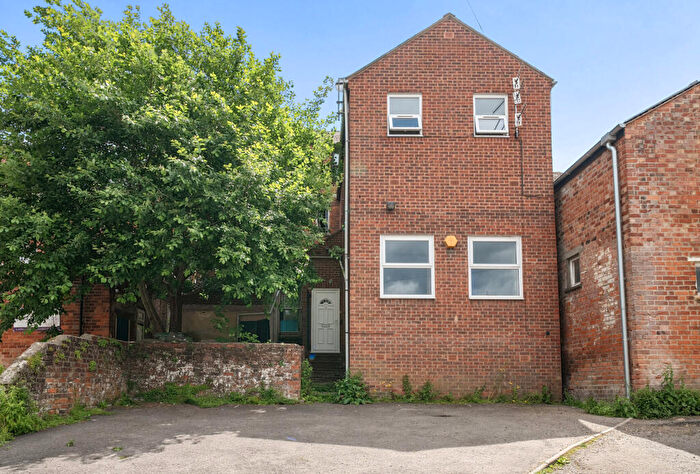
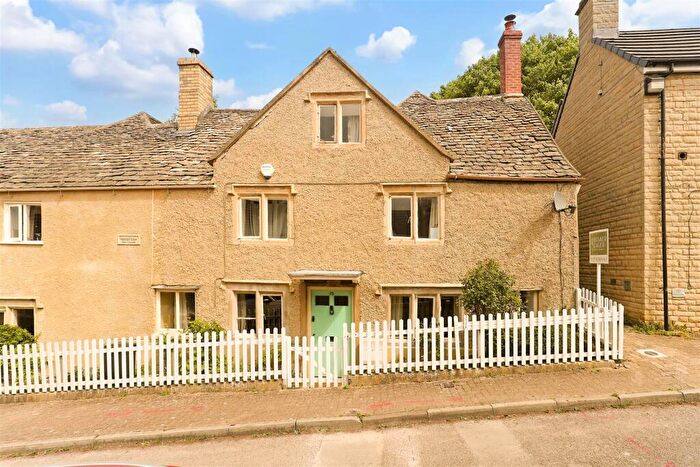
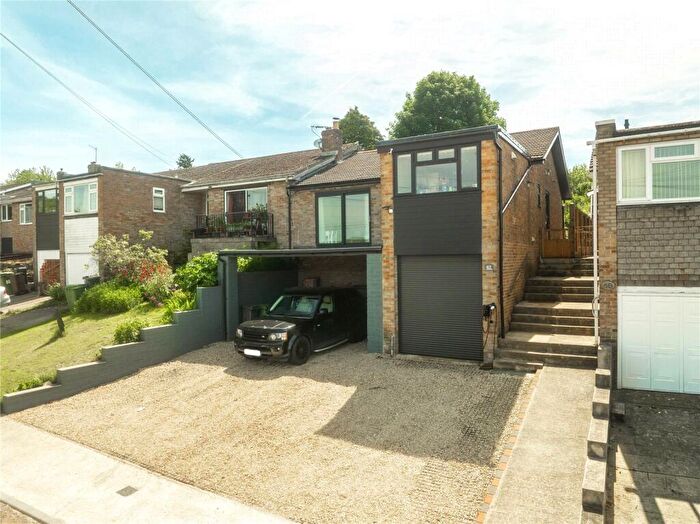
Properties for sale in Uplands
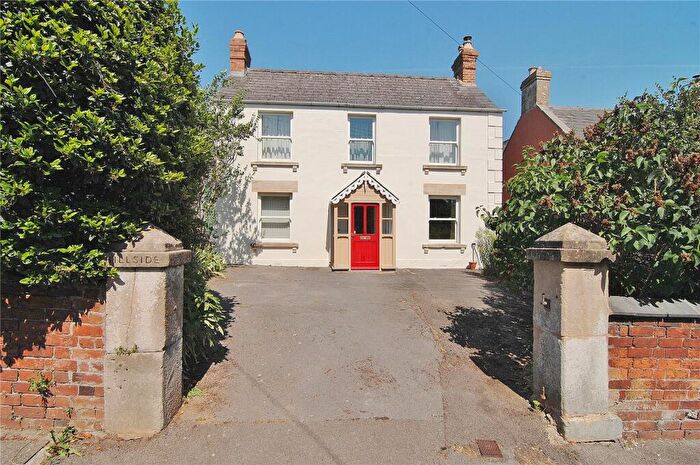
![]()
If you are looking to sell your house, let it out, or receive a property valuation, an expert can help you.
Click the button below to get started.
Roads and Postcodes in Uplands
Navigate through our locations to find the location of your next house in Uplands, Stroud for sale or to rent.
| Streets | Postcodes |
|---|---|
| Birches Close | GL5 1TJ |
| Birches Drive | GL5 1RP |
| Briar Close | GL5 1UU |
| Catswood Court | GL5 1XR |
| Cutler Road | GL5 1SZ GL5 1TA |
| Delmont Grove | GL5 1UN |
| Fennells View | GL5 1RW |
| Folly Lane | GL5 1SD GL5 1SF GL5 1SG GL5 1SJ GL5 1SP GL5 1SQ GL5 1SS GL5 1SU GL5 1SX GL6 7JT GL6 7LY |
| Folly Rise | GL5 1UX |
| Grove Cottages | GL6 6LE |
| Grove Park Road | GL5 1SW |
| Heazle Place | GL5 1UW |
| Hillier Close | GL5 1XS |
| Hope Villas | GL5 1TF |
| John Bevan Close | GL5 1UL |
| Lovedays Mead | GL5 1SB |
| Malvern Villas | GL5 1SL |
| Middle Street | GL5 1TG GL5 1TH GL5 1TQ |
| Northfield Mews | GL5 1UJ |
| Peghouse Close | GL5 1UP |
| Peghouse Rise | GL5 1RT GL5 1RU GL5 1UR GL5 1UZ GL5 1XT |
| Shepherds Close | GL5 1RZ |
| Shepherds Croft | GL5 1US |
| Swifts Hill View | GL5 1PR |
| The Budding | GL5 1XU |
| The Circle | GL5 1SH |
| The Square | GL5 1SR |
| The Woodlands | GL5 1QE |
| Thompson Road | GL5 1SY GL5 1TB GL5 1TE |
| Upper Springfield Road | GL5 1SN |
| Vatch View | GL5 1JW |
| Well End | GL5 1XA |
| Wickridge Close | GL5 1ST |
| Windsor Place | GL6 6LB GL6 6LD |
| GL6 6EA GL6 6EB |
Property price trends in Uplands
According to the latest Land Registry data, the average home in Uplands sold for £359,800 in 2026. That figure comes from 1,258 sales logged over the past 31 years.
Prices have continued to climb over the last three years. Compared with 2023, when the typical sale came in around £334,483, that's a rise of roughly 7.6%.
Looking back five years, average prices are up about 16.7% since 2021, a gain of around £51,430 in cash terms.
Zoom out to the past decade for the fuller picture. Back in 2016, homes here averaged £200,554, so the typical sold price has climbed about 79.4% since then, roughly 6% a year. Stretch the view to fifteen years and that annual pace eases back to about 4.5%.
Frequently asked questions about Uplands
What is the average price for a property for sale in Uplands?
The average price for a property for sale in Uplands is £336,688. This amount is 23% lower than the average price in Stroud. There are 492 property listings for sale in Uplands.
What streets have the most expensive properties for sale in Uplands?
The streets with the most expensive properties for sale in Uplands are Vatch View at an average of £685,000, Delmont Grove at an average of £494,500 and Wickridge Close at an average of £452,000.
What streets have the most affordable properties for sale in Uplands?
The streets with the most affordable properties for sale in Uplands are Cutler Road at an average of £146,986, Fennells View at an average of £232,000 and Peghouse Close at an average of £237,125.
Which train stations are available in or near Uplands?
Some of the train stations available in or near Uplands are Stroud, Stonehouse and Cam and Dursley.
Property Price Paid in Uplands by Year
The average sold property price by year was:
| Year | Average Sold Price | Price Change |
Sold Properties
|
|---|---|---|---|
| 2026 | £359,800 | 2% |
5 Properties |
| 2025 | £351,500 | 10% |
26 Properties |
| 2024 | £317,509 | -5% |
23 Properties |
| 2023 | £334,483 | 9% |
27 Properties |
| 2022 | £304,382 | -1% |
34 Properties |
| 2021 | £308,370 | 3% |
36 Properties |
| 2020 | £299,748 | 16% |
30 Properties |
| 2019 | £251,099 | -2% |
20 Properties |
| 2018 | £255,502 | -1% |
37 Properties |
| 2017 | £258,291 | 22% |
29 Properties |
Property Price per Property Type in Uplands
Here you can find historic sold price data in order to help with your property search.
The average Property Paid Price for specific property types in the last three years are:
| Property Type | Average Sold Price | Sold Properties |
|---|---|---|
| Semi Detached House | £290,494.00 | 39 Semi Detached Houses |
| Detached House | £451,351.00 | 27 Detached Houses |
| Terraced House | £280,708.00 | 12 Terraced Houses |
| Flat | £129,166.00 | 3 Flats |
