Houses for sale & to rent in Valley, Stroud
House Prices in Valley
Properties in Valley have an average house price of £357,631.00 and had 105 Property Transactions within the last 3 years¹.
Valley is an area in Stroud, Gloucestershire with 1,011 households², where the most expensive property was sold for £2,190,000.00.
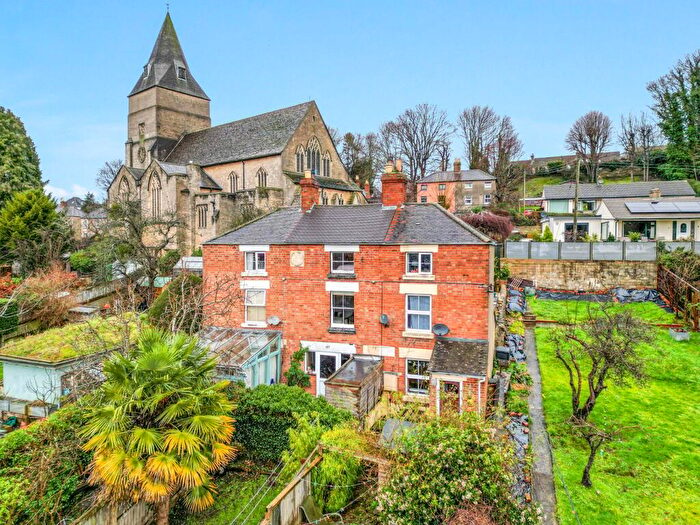
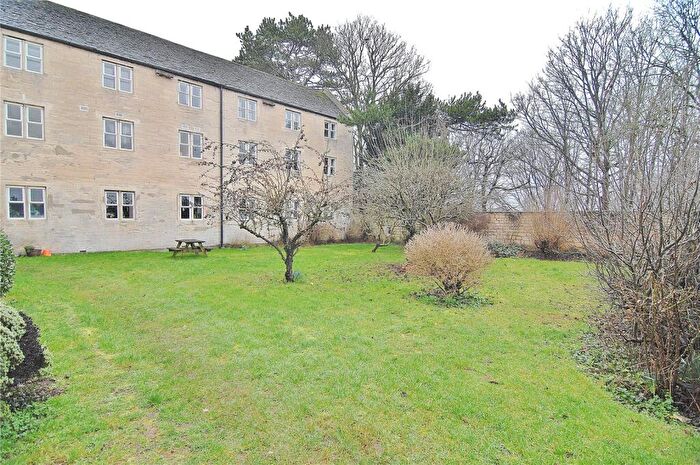
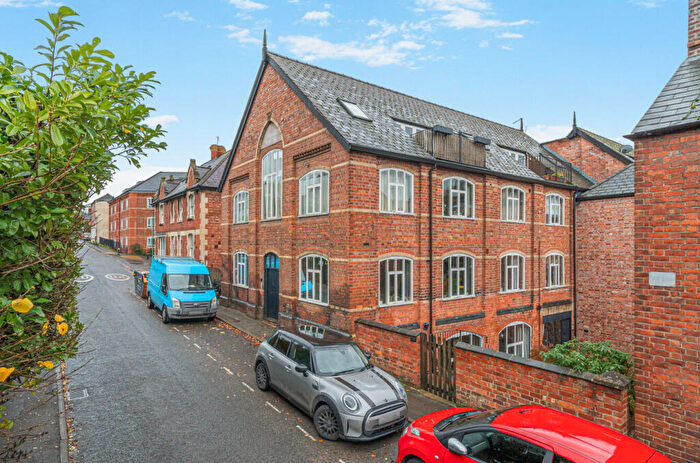
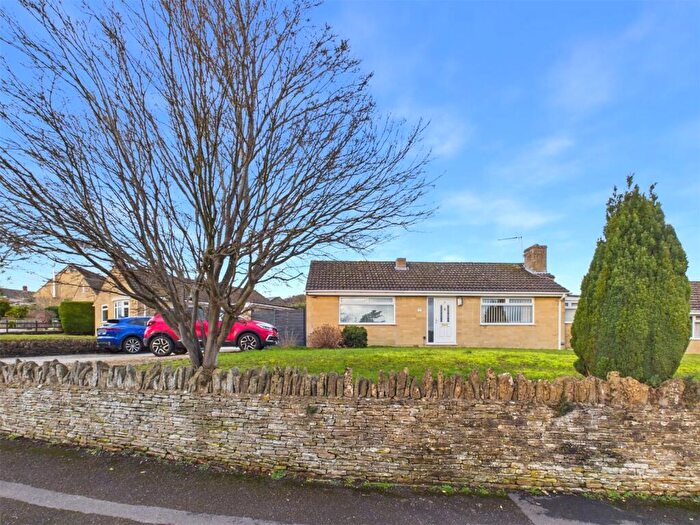
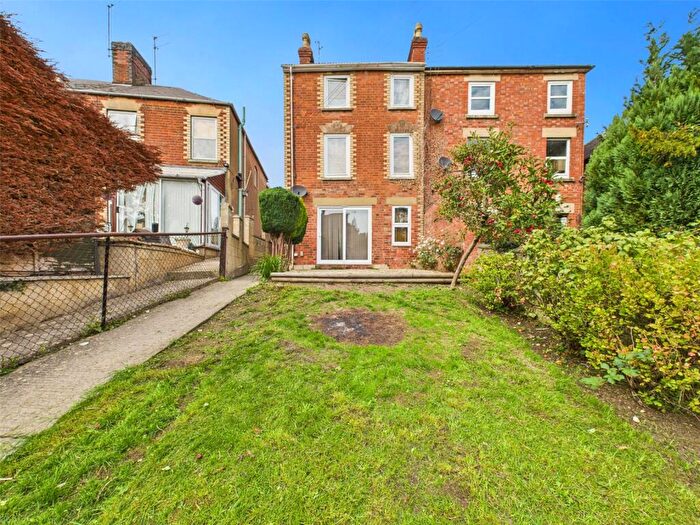
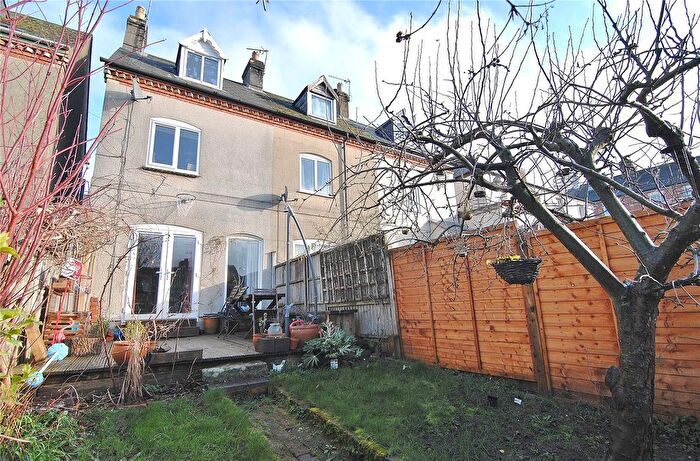
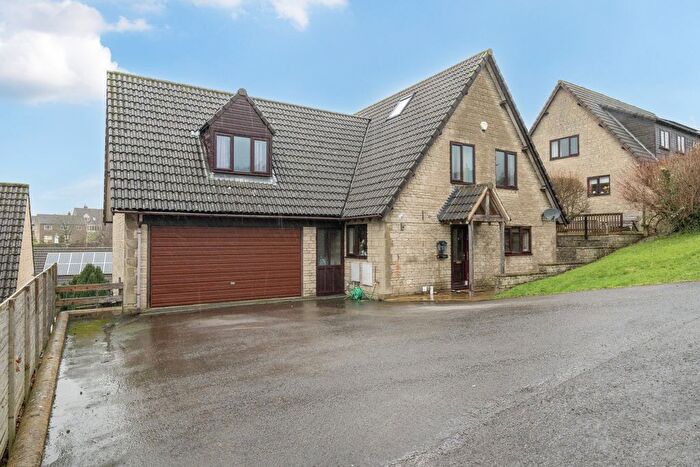
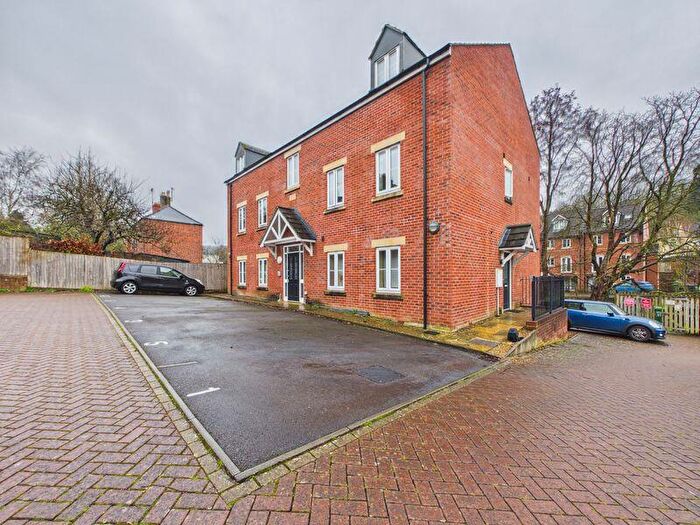
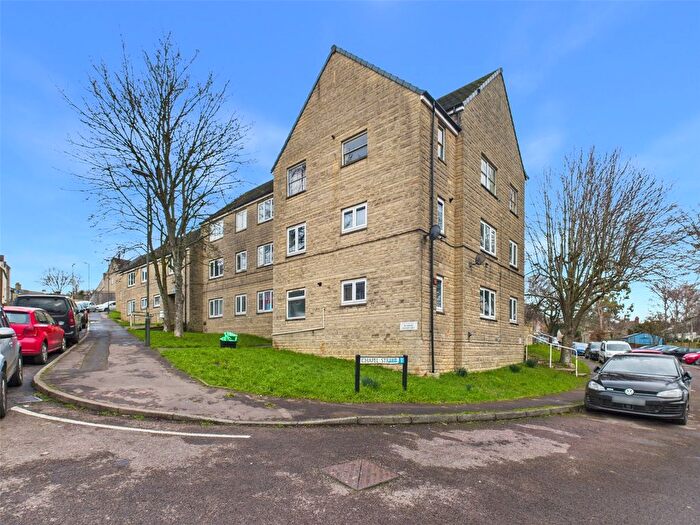
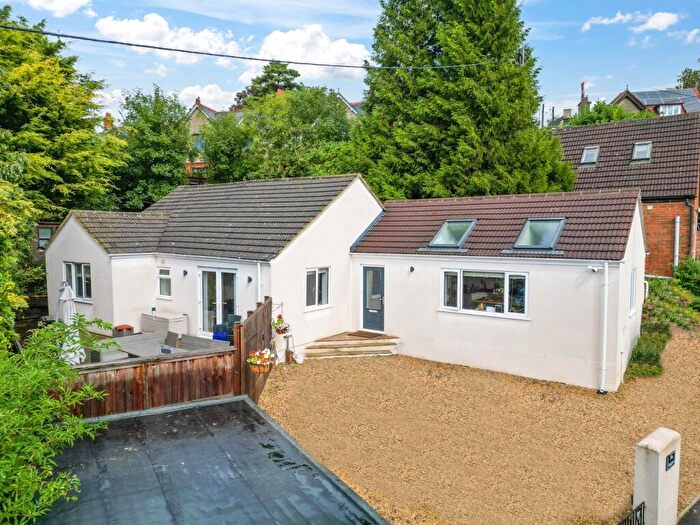
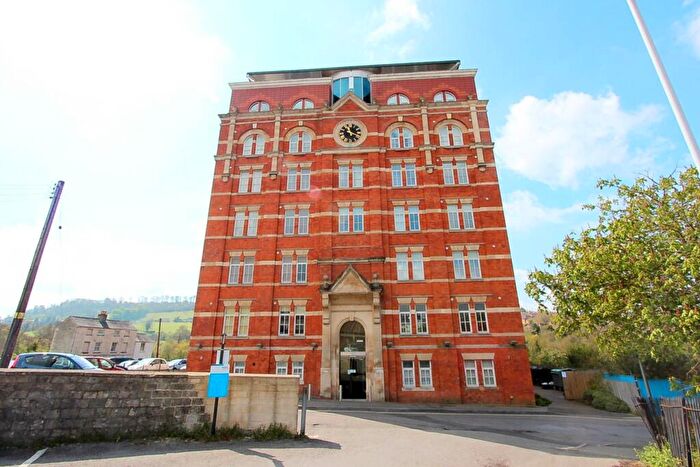
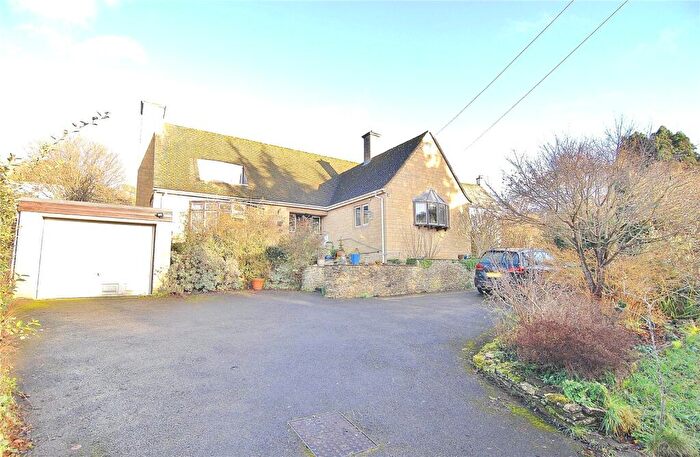
Properties for sale in Valley
Roads and Postcodes in Valley
Navigate through our locations to find the location of your next house in Valley, Stroud for sale or to rent.
| Streets | Postcodes |
|---|---|
| All Saints Fields | GL5 1NE |
| All Saints Road | GL5 1TT |
| Belle Vue Close | GL5 1ND |
| Belle Vue Road | GL5 1JP GL5 1JT GL5 1JU GL5 1PY |
| Ben Grazebrooks Well | GL5 1DL |
| Bisley Old Road | GL5 1LU |
| Captain Barton Close | GL5 1RF |
| Catherines Close | GL5 1PD |
| Claremont Villas | GL5 1TS |
| Fairview Villas | GL5 1LD |
| Glenroy Cottages | GL5 1UE |
| Glenroy Villas | GL5 1UF |
| Gordon Terrace | GL5 1LE |
| Henley Villas | GL5 1UH |
| Huddersfield Villas | GL5 1DD |
| Lansdown | GL5 1BG GL5 1BH GL5 1BN GL5 1BS GL5 1BT GL5 1BU GL5 1BW GL5 1BX GL5 1BZ GL5 1DA |
| Libbys Drive | GL5 1RN |
| Lime Grove | GL5 1JN |
| Little Mill Court | GL5 1DJ GL5 1DN |
| Locking Hill | GL5 1QN |
| Lorne Villas | GL5 1UG |
| Lower Leazes | GL5 1JY GL5 1JZ |
| Middle Hill | GL5 1NT GL5 1NU |
| Millbrook Place | GL5 1BA |
| Nouncells Cross | GL5 1PT GL5 1PU |
| Oxford Terrace | GL5 1TW |
| Parliament Close | GL5 1DQ |
| Parliament Street | GL5 1LL GL5 1LN GL5 1LW |
| Peghouse Rise | GL5 1RS |
| Sheppey Villas | GL5 1DB |
| Slad Road | GL5 1QP GL5 1QR GL5 1QS GL5 1QT GL5 1QU GL5 1QW GL5 1QX GL5 1QY GL5 1QZ GL5 1RD GL5 1RE GL5 1RG GL5 1RH GL5 1RJ |
| Slad View | GL5 1LQ |
| Slade Brook | GL5 1RL |
| Springfield Road | GL5 1TL GL5 1TY GL5 1UB |
| Springfield Villas | GL5 1TX |
| Springhill | GL5 1TN |
| St Brendans Road | GL5 1PB |
| Summer Close | GL5 1PF |
| Summer Crescent | GL5 1PP |
| Summer Street | GL5 1NX GL5 1NY GL5 1PA GL5 1PG GL5 1PH GL5 1PJ GL5 1PQ |
| Sycamore Drive | GL5 1RB |
| The Knoll | GL5 1LJ |
| Upland Villas | GL5 1TR |
| Uplands View Terrace | GL5 1LF |
| Upper Leazes | GL5 1LA GL5 1LB |
| Witcombe Cottages | GL5 1UD |
| Woodlands Drive | GL5 1RX |
| Woodside | GL5 1PL GL5 1PW |
| Wycliffe Villas | GL5 1UQ |
| York Villas | GL5 1TP |
| GL5 1LG |
Transport near Valley
- FAQ
- Price Paid By Year
- Property Type Price
Frequently asked questions about Valley
What is the average price for a property for sale in Valley?
The average price for a property for sale in Valley is £357,631. This amount is 19% lower than the average price in Stroud. There are 538 property listings for sale in Valley.
What streets have the most expensive properties for sale in Valley?
The streets with the most expensive properties for sale in Valley are Springfield Villas at an average of £750,000, Bisley Old Road at an average of £502,250 and Slad Road at an average of £485,107.
What streets have the most affordable properties for sale in Valley?
The streets with the most affordable properties for sale in Valley are Lansdown at an average of £234,454, Little Mill Court at an average of £243,804 and Slad View at an average of £250,000.
Which train stations are available in or near Valley?
Some of the train stations available in or near Valley are Stroud, Stonehouse and Cam and Dursley.
Property Price Paid in Valley by Year
The average sold property price by year was:
| Year | Average Sold Price | Price Change |
Sold Properties
|
|---|---|---|---|
| 2025 | £398,466 | 18% |
30 Properties |
| 2024 | £326,435 | -9% |
37 Properties |
| 2023 | £355,769 | 6% |
38 Properties |
| 2022 | £334,013 | 8% |
50 Properties |
| 2021 | £305,801 | 18% |
52 Properties |
| 2020 | £251,845 | -8% |
32 Properties |
| 2019 | £271,013 | 9% |
53 Properties |
| 2018 | £247,569 | -5% |
45 Properties |
| 2017 | £261,049 | 11% |
40 Properties |
| 2016 | £232,784 | -9% |
49 Properties |
| 2015 | £253,556 | 21% |
45 Properties |
| 2014 | £200,052 | 7% |
45 Properties |
| 2013 | £186,712 | 4% |
40 Properties |
| 2012 | £179,503 | 11% |
29 Properties |
| 2011 | £160,358 | -10% |
34 Properties |
| 2010 | £176,919 | -1% |
47 Properties |
| 2009 | £179,012 | 9% |
62 Properties |
| 2008 | £162,319 | -12% |
46 Properties |
| 2007 | £182,514 | -3% |
55 Properties |
| 2006 | £187,830 | -8% |
60 Properties |
| 2005 | £202,844 | 32% |
47 Properties |
| 2004 | £137,776 | -9% |
64 Properties |
| 2003 | £149,974 | 24% |
63 Properties |
| 2002 | £114,102 | 11% |
66 Properties |
| 2001 | £101,939 | 11% |
43 Properties |
| 2000 | £91,038 | 22% |
43 Properties |
| 1999 | £70,695 | -0,3% |
57 Properties |
| 1998 | £70,894 | 14% |
43 Properties |
| 1997 | £60,729 | 15% |
56 Properties |
| 1996 | £51,410 | -18% |
37 Properties |
| 1995 | £60,835 | - |
36 Properties |
Property Price per Property Type in Valley
Here you can find historic sold price data in order to help with your property search.
The average Property Paid Price for specific property types in the last three years are:
| Property Type | Average Sold Price | Sold Properties |
|---|---|---|
| Semi Detached House | £356,250.00 | 32 Semi Detached Houses |
| Detached House | £727,538.00 | 13 Detached Houses |
| Terraced House | £334,380.00 | 40 Terraced Houses |
| Flat | £165,907.00 | 20 Flats |

