
Houses for sale in Upton St Leonards, Stroud
House Prices in Upton St Leonards
Properties in Upton St Leonards have an average house price of £901k and had 2 Property Transactions within the last 3 years¹.
Upton St Leonards is an area in Stroud, Gloucestershire with 32 households², where the most expensive property was sold for £902k.
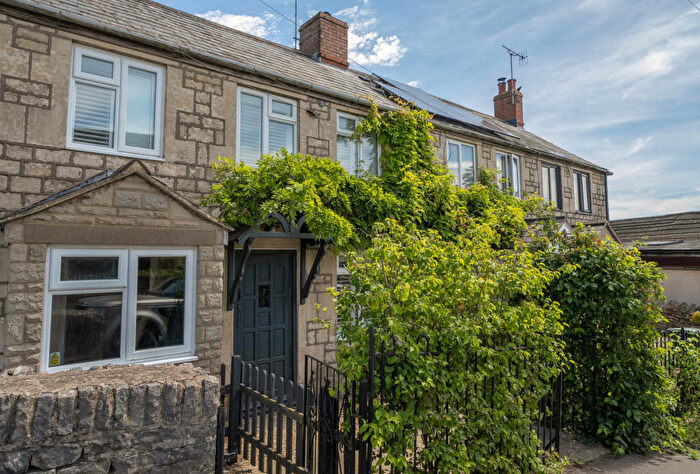
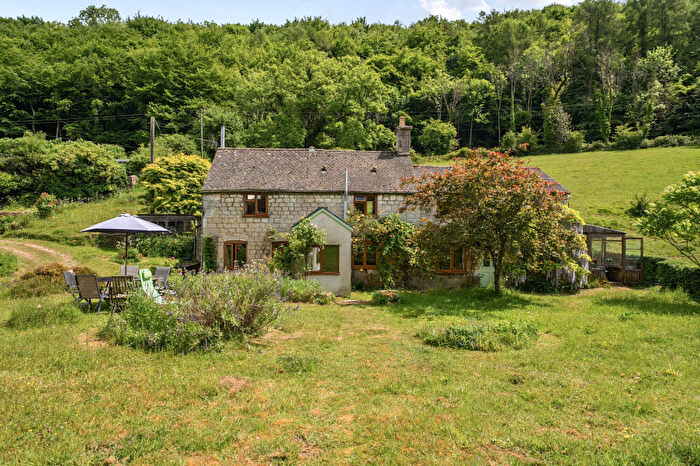
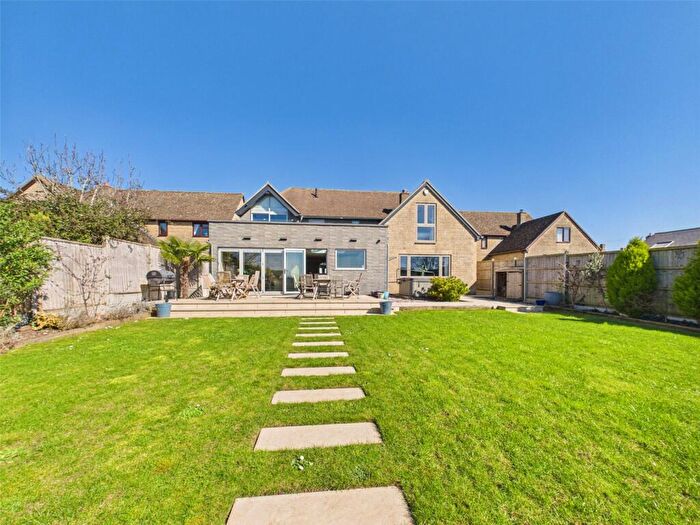
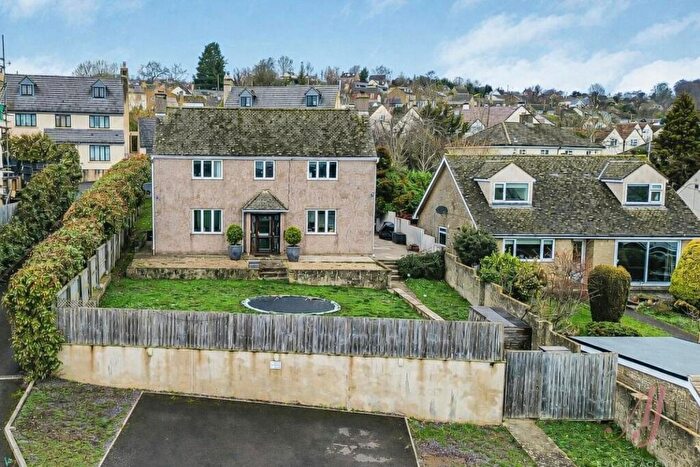
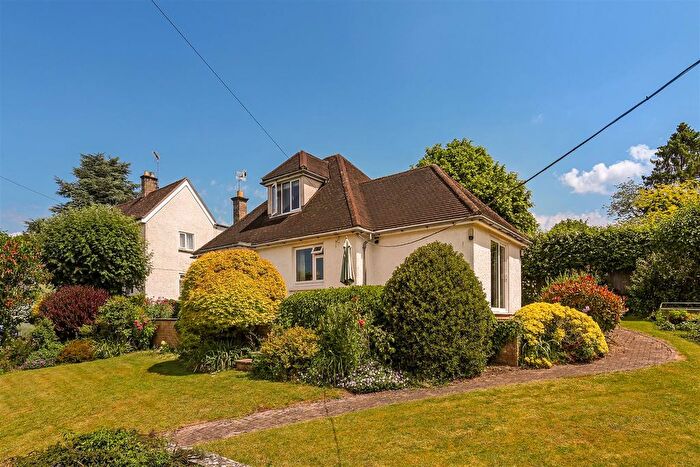
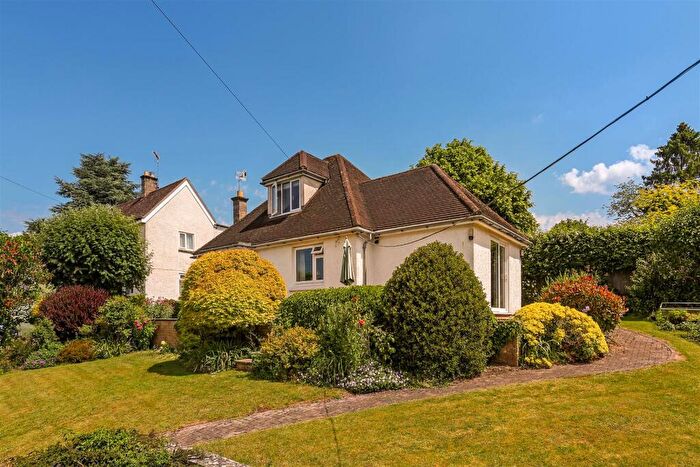
Properties for sale in Upton St Leonards

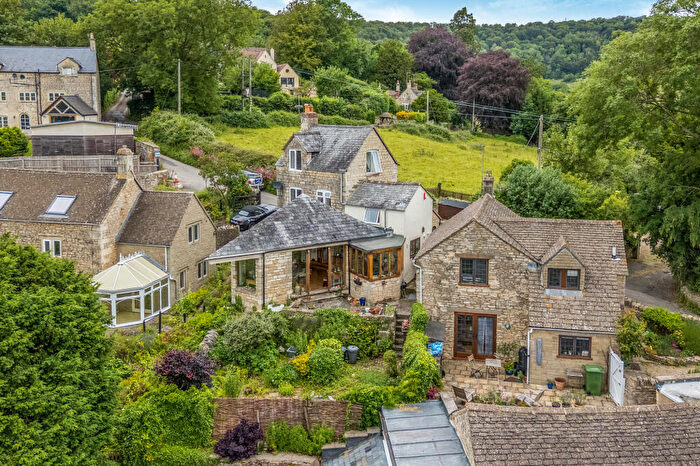
![]()
If you are looking to sell your house, let it out, or receive a property valuation, an expert can help you.
Click the button below to get started.
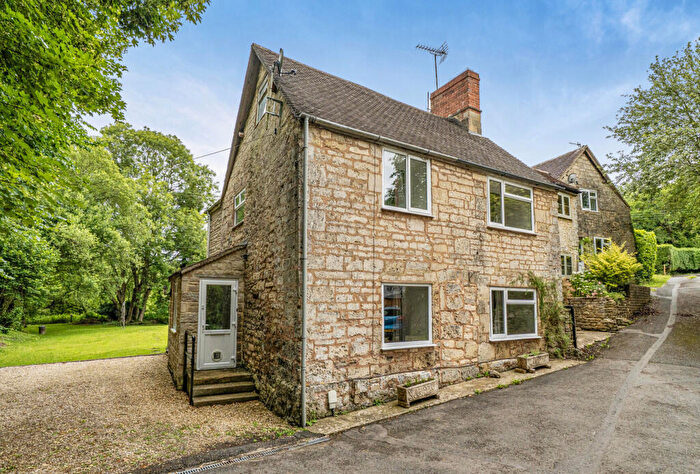
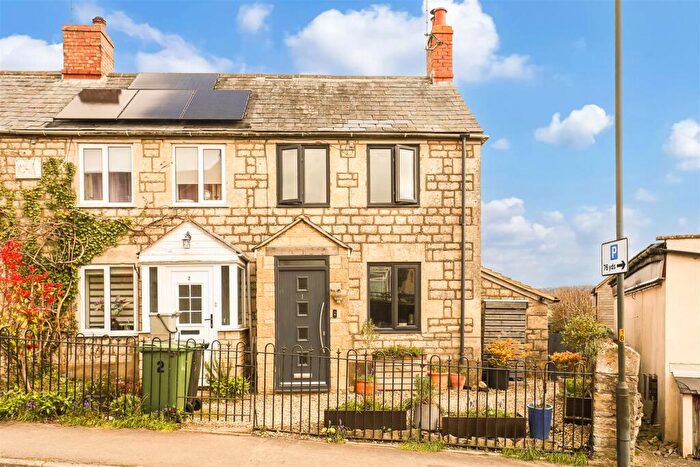
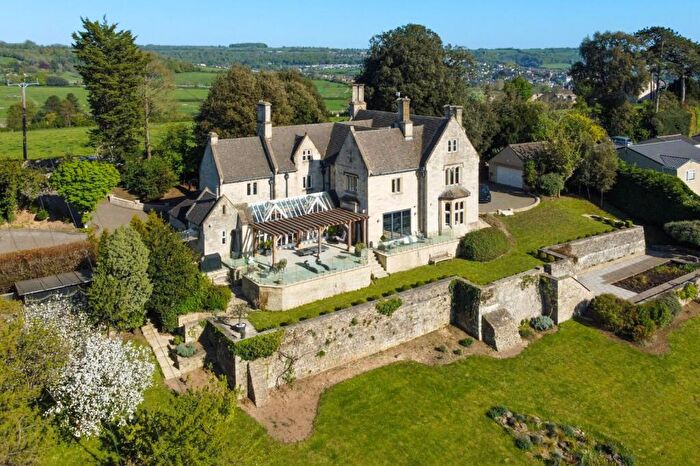
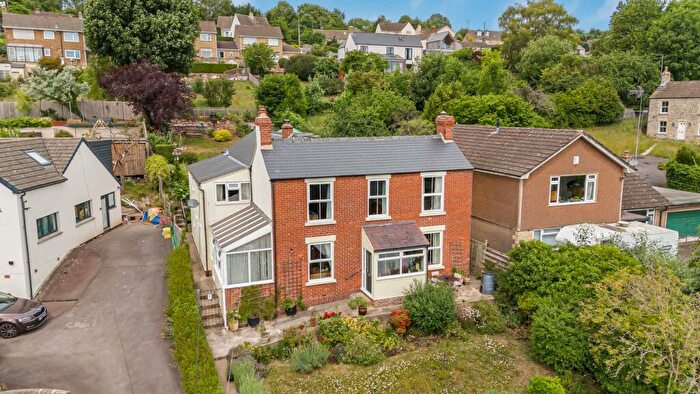

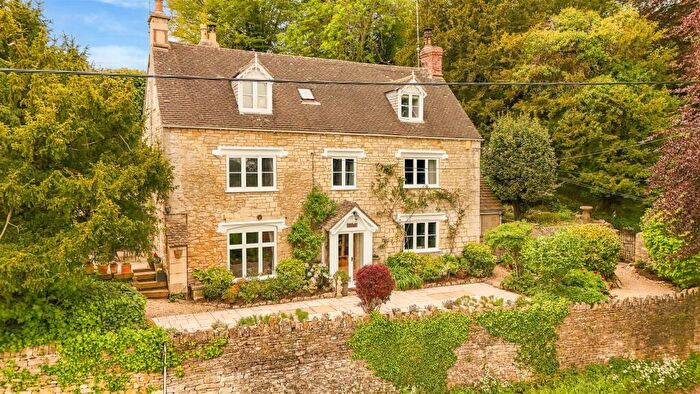
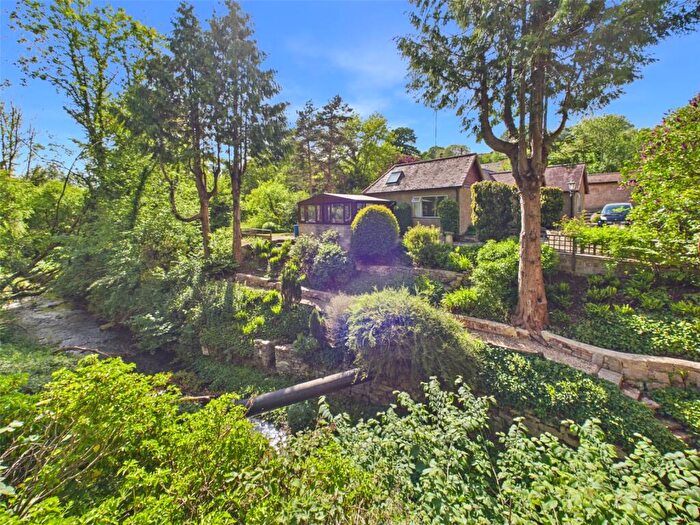
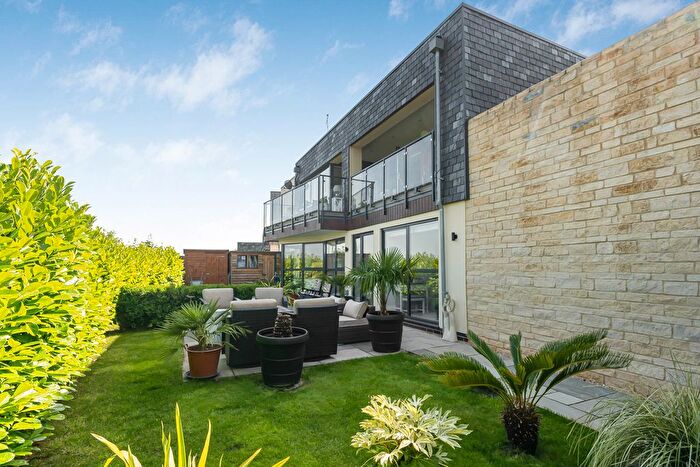
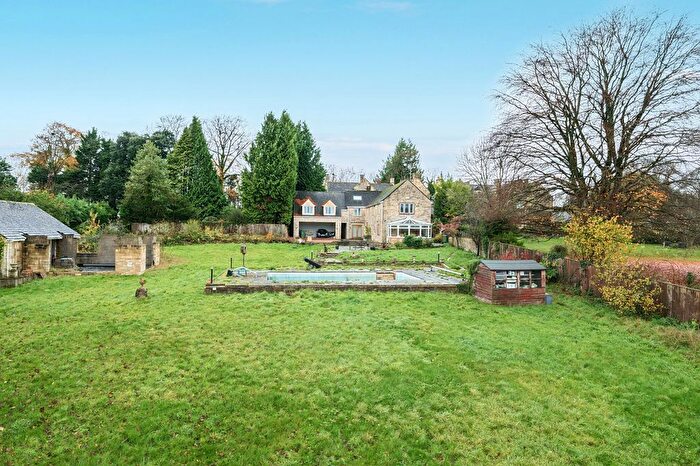
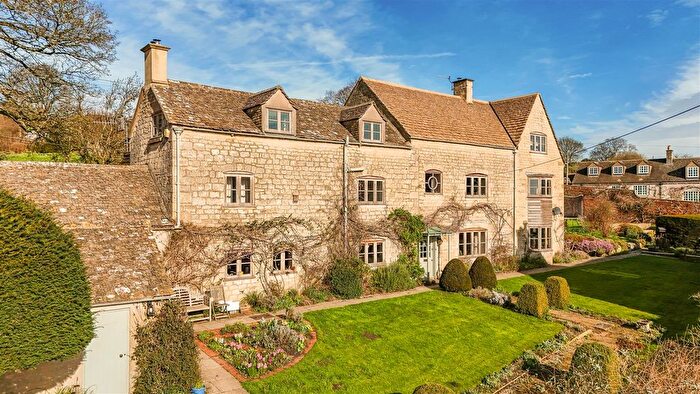
Previously listed properties in Upton St Leonards

![]()
If you are looking to sell your house, let it out, or receive a property valuation, an expert can help you.
Click the button below to get started.
Roads and Postcodes in Upton St Leonards
Navigate through our locations to find the location of your next house in Upton St Leonards, Stroud for sale or to rent.
| Streets | Postcodes |
|---|---|
| Edge | GL6 6PH |
| Haresfield Lane | GL6 6PP GL6 6PR |
| Madams Wood | GL6 6SZ |
| Seven Leaze Lane | GL6 6NL |
| Stockend | GL6 6PJ GL6 6PL GL6 6PN |
Property price trends in Upton St Leonards
According to the latest Land Registry data, the average home in Upton St Leonards sold for £901,000 in 2025. That figure comes from 21 sales logged over the past 29 years.
Looking back five years, average prices are up about 14.8% since 2020, a gain of around £116,000 in cash terms.
Zoom out to the past decade for the fuller picture. Back in 2015, homes here averaged £755,000, so the typical sold price has climbed about 19.3% since then, roughly 1.8% a year. Stretch the view to fifteen years and that annual pace edges up closer to 10.4%.
Frequently asked questions about Upton St Leonards
What is the average price for a property for sale in Upton St Leonards?
The average price for a property for sale in Upton St Leonards is £901,000. This amount is 105% higher than the average price in Stroud. There are 182 property listings for sale in Upton St Leonards.
Which train stations are available in or near Upton St Leonards?
Some of the train stations available in or near Upton St Leonards are Stroud, Stonehouse and Gloucester.
Property Price Paid in Upton St Leonards by Year
The average sold property price by year was:
| Year | Average Sold Price | Price Change |
Sold Properties
|
|---|---|---|---|
| 2025 | £901,000 | 13% |
2 Properties |
| 2020 | £785,000 | 4% |
1 Property |
| 2015 | £755,000 | 67% |
1 Property |
| 2012 | £250,000 | -98% |
1 Property |
| 2005 | £495,000 | 8% |
1 Property |
| 2004 | £456,500 | 28% |
2 Properties |
| 2003 | £330,000 | -50% |
1 Property |
| 2002 | £495,000 | 50% |
1 Property |
| 2000 | £248,750 | 19% |
2 Properties |
| 1999 | £201,000 | 5% |
1 Property |
Property Price per Property Type in Upton St Leonards
Here you can find historic sold price data in order to help with your property search.
The average Property Paid Price for specific property types in the last three years are:
| Property Type | Average Sold Price | Sold Properties |
|---|---|---|
| Detached House | £901,000.00 | 2 Detached Houses |
