
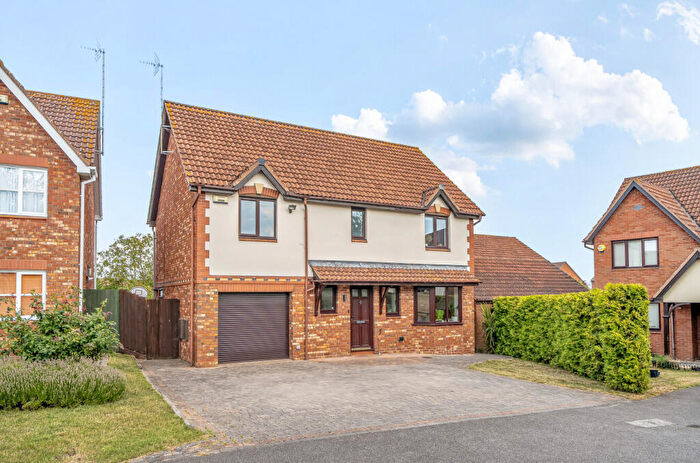
Houses for sale in Tewkesbury, Gloucestershire
House Prices in Tewkesbury
Properties in Tewkesbury have an average house price of £298k and had 1,025 Property Transactions within the last 3 years.¹
Tewkesbury is an area in Gloucestershire with 10,739 households², where the most expensive property was sold for £1.17M.
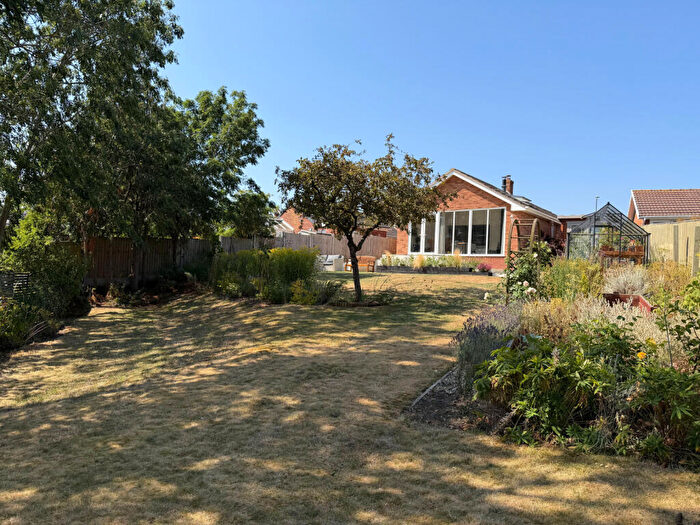
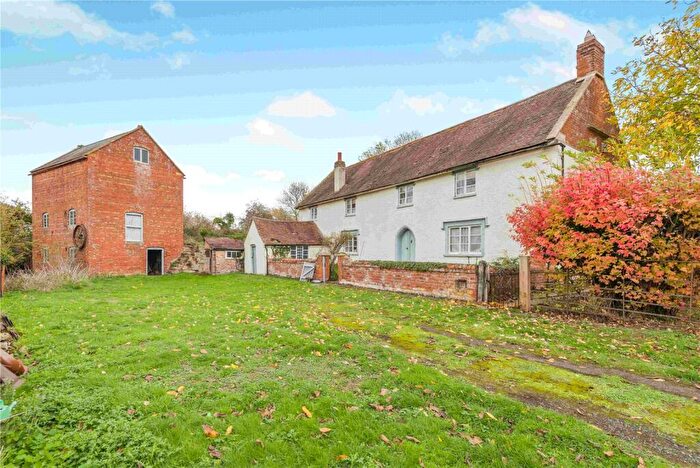
Properties for sale in Tewkesbury
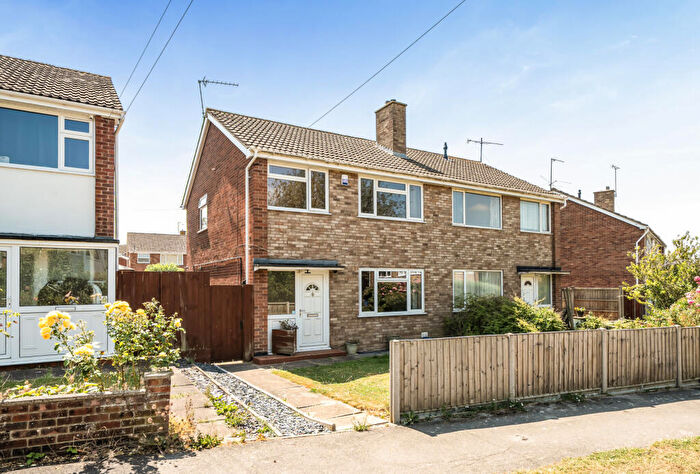
![]()
If you are looking to sell your house, let it out, or receive a property valuation, an expert can help you.
Click the button below to get started.


Neighbourhoods in Tewkesbury
Navigate through our locations to find the location of your next house in Tewkesbury, Gloucestershire for sale or to rent.
Property price trends in Tewkesbury
According to the latest Land Registry data, the average home in Tewkesbury sold for £286,250 in 2026. That figure comes from a substantial record of 14,957 sales logged over the past 31 years.
Prices have softened over the last three years. Compared with 2023, when the typical sale came in around £292,564, that's a fall of roughly 2.2%.
Looking back five years, average prices are up about 2.4% since 2021, a gain of around £6,773 in cash terms.
Zoom out to the past decade for the fuller picture. Back in 2016, homes here averaged £229,167, so the typical sold price has climbed about 24.9% since then, roughly 2.2% a year. Stretch the view to fifteen years and that annual pace edges up closer to 2.8%.
Frequently asked questions about Tewkesbury
What is the average price for a property for sale in Tewkesbury?
The average price for a property for sale in Tewkesbury is £297,554. This amount is 21% lower than the average price in Gloucestershire. There are 6,813 property listings for sale in Tewkesbury.
What locations have the most expensive properties for sale in Tewkesbury?
The locations with the most expensive properties for sale in Tewkesbury are Tewkesbury South at an average of £498,333, Winchcombe at an average of £484,043 and Twyning at an average of £471,491.
What locations have the most affordable properties for sale in Tewkesbury?
The locations with the most affordable properties for sale in Tewkesbury are Northway at an average of £237,644, Tewkesbury Priors Park at an average of £242,646 and Tewkesbury Town With Mitton at an average of £245,481.
Which train stations are available in or near Tewkesbury?
Some of the train stations available in or near Tewkesbury are Ashchurch, Cheltenham Spa and Pershore.
Property Price Paid in Tewkesbury by Year
The average sold property price by year was:
| Year | Average Sold Price | Price Change |
Sold Properties
|
|---|---|---|---|
| 2026 | £286,250 | -7% |
24 Properties |
| 2025 | £305,988 | 4% |
357 Properties |
| 2024 | £294,055 | 1% |
318 Properties |
| 2023 | £292,564 | 2% |
326 Properties |
| 2022 | £287,549 | 3% |
393 Properties |
| 2021 | £279,477 | 4% |
523 Properties |
| 2020 | £269,425 | 1% |
353 Properties |
| 2019 | £265,890 | 6% |
454 Properties |
| 2018 | £249,835 | 1% |
549 Properties |
| 2017 | £247,407 | 7% |
473 Properties |
Property Price per Property Type in Tewkesbury
Here you can find historic sold price data in order to help with your property search.
The average Property Paid Price for specific property types in the last three years are:
| Property Type | Average Sold Price | Sold Properties |
|---|---|---|
| Semi Detached House | £286,044.00 | 316 Semi Detached Houses |
| Detached House | £464,216.00 | 241 Detached Houses |
| Terraced House | £242,030.00 | 361 Terraced Houses |
| Flat | £143,498.00 | 107 Flats |
Transport in Tewkesbury
Please see below transportation links in this area:
