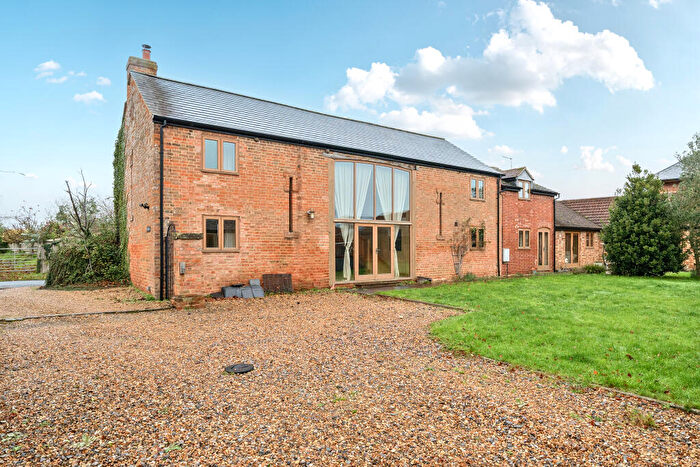
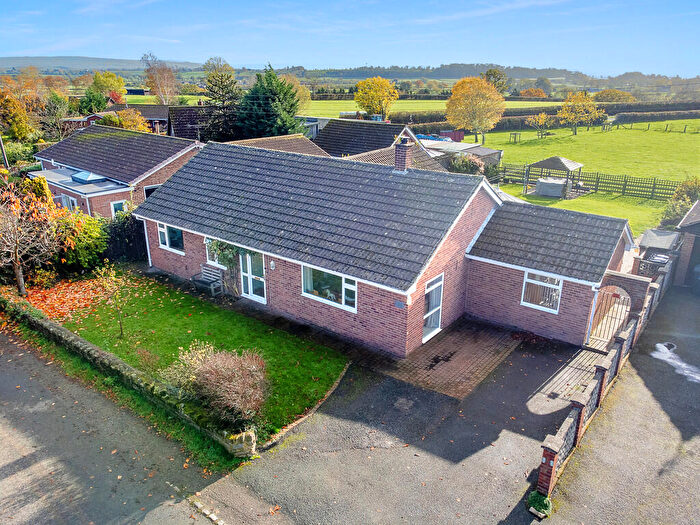
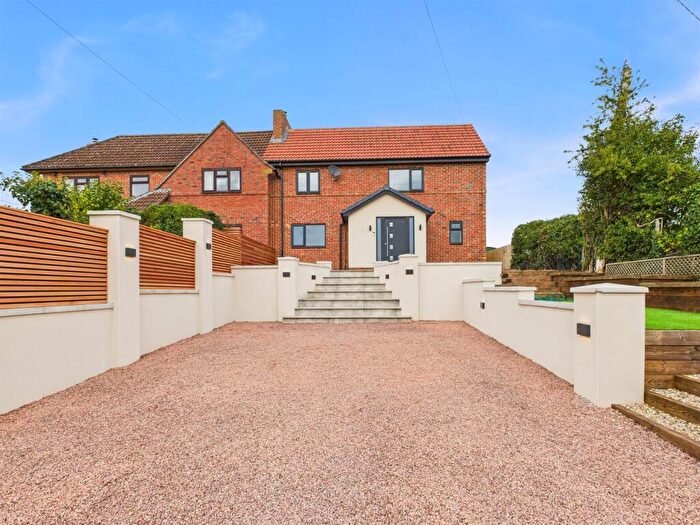
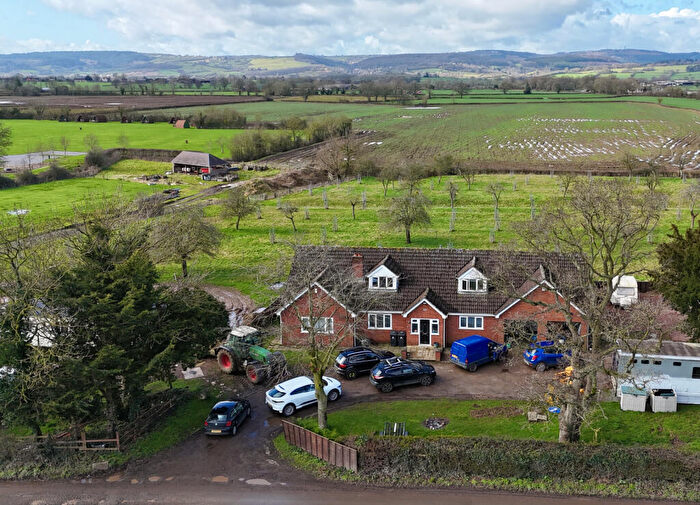
Houses for sale & to rent in Newnham And Westbury, Westbury-on-severn
House Prices in Newnham And Westbury
Properties in Newnham And Westbury have an average house price of £443,906.00 and had 16 Property Transactions within the last 3 years¹.
Newnham And Westbury is an area in Westbury-on-severn, Gloucestershire with 451 households², where the most expensive property was sold for £800,000.00.
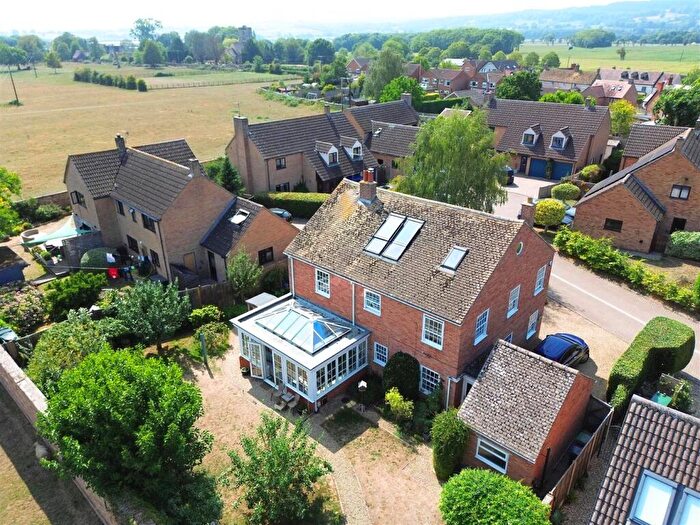
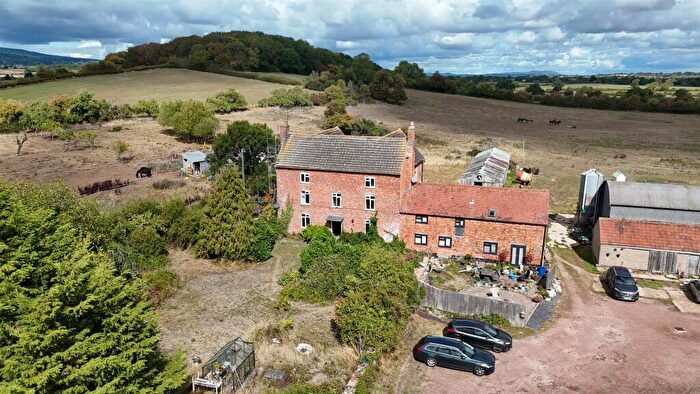
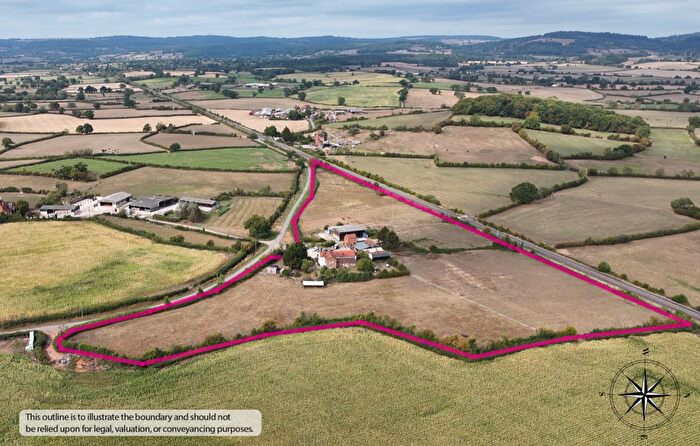
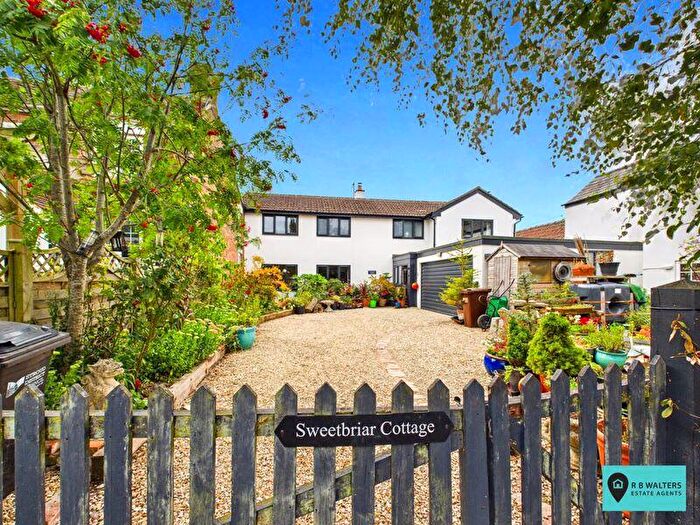
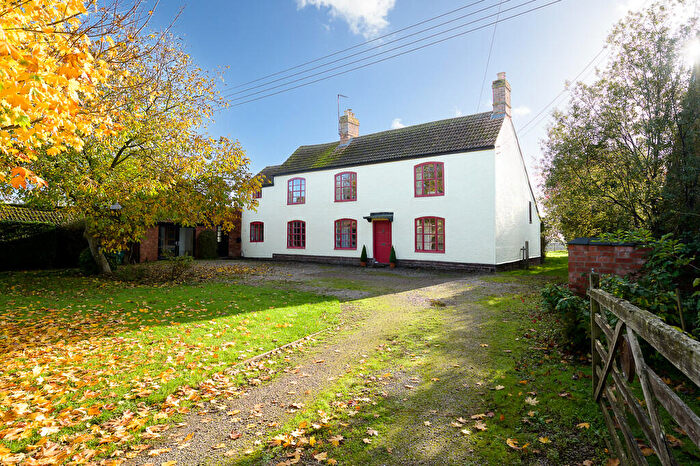
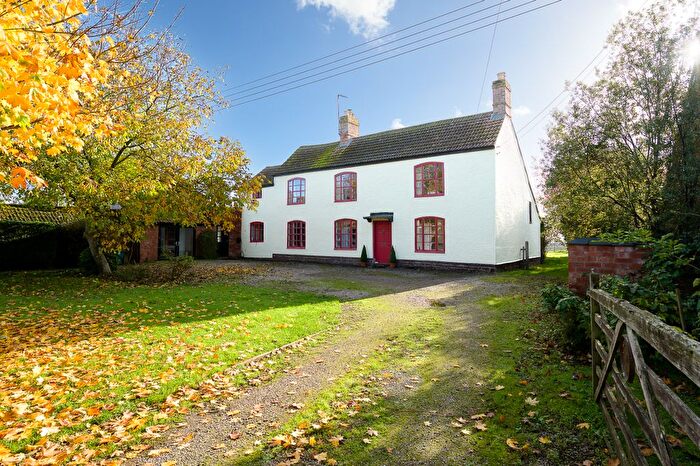
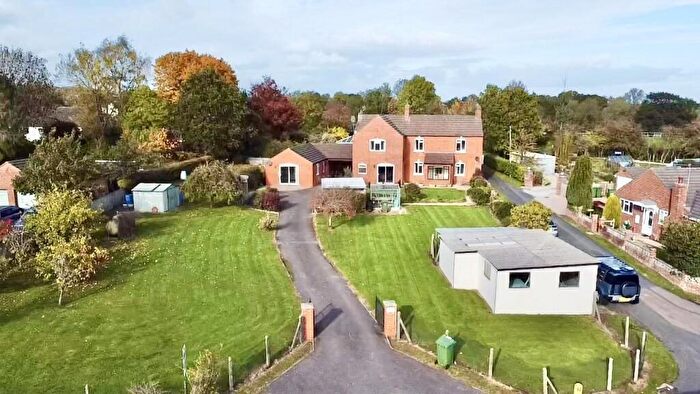
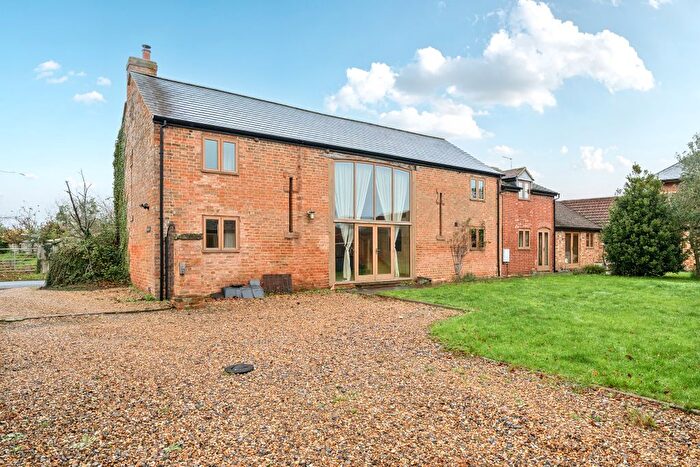
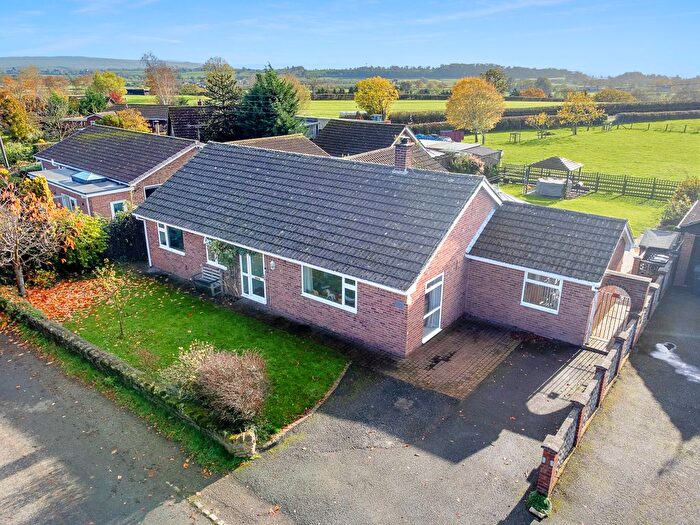
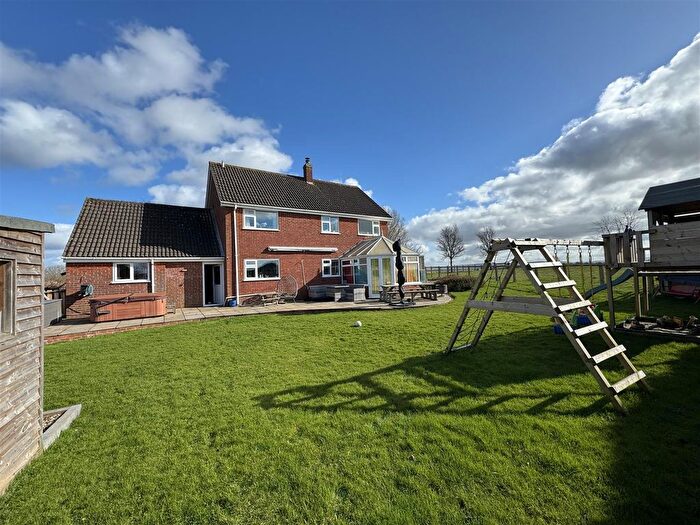
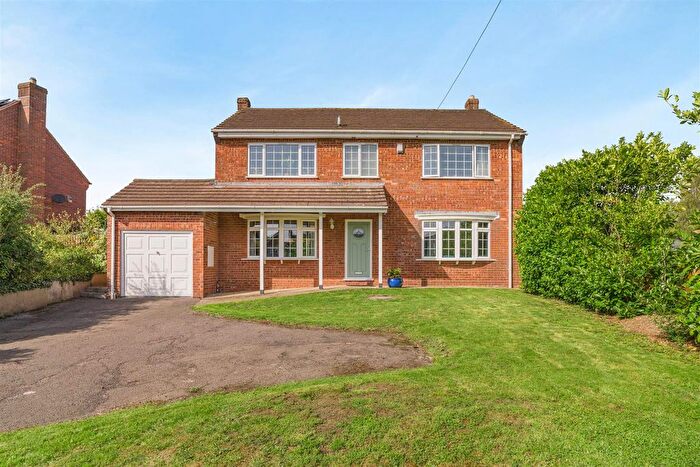
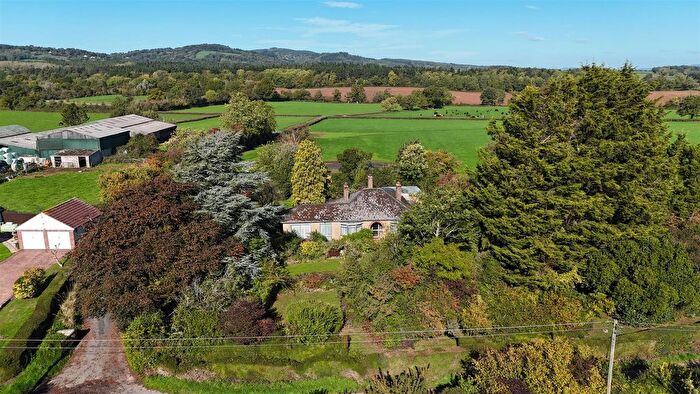
Properties for sale in Newnham And Westbury
Previously listed properties in Newnham And Westbury
Roads and Postcodes in Newnham And Westbury
Navigate through our locations to find the location of your next house in Newnham And Westbury, Westbury-on-severn for sale or to rent.
| Streets | Postcodes |
|---|---|
| Adsett Court | GL14 1PQ |
| Ampney Lane | GL14 1LX |
| Bell Lane | GL14 1PS |
| Blaisdon Road | GL14 1LR GL14 1LS |
| Brook Lane | GL14 1NE |
| Chaxhill | GL14 1QE GL14 1QP GL14 1QR |
| Church Lane | GL14 1ND GL14 1NF |
| Cleeve | GL14 1RF |
| Colchester Close | GL14 1PU |
| Crowgate Lane | GL14 1QS |
| Denmark Villas | GL14 1QT |
| Frewins Lane | GL14 1PT |
| Gatwick Close | GL14 1QQ |
| Grange Court | GL14 1PL |
| Hunt Hill Road | GL14 1QD |
| Northwood Green | GL14 1LZ GL14 1NA GL14 1NB GL14 1NH |
| Rock & Fountain Lane | GL14 1QN |
| Rodley Road | GL14 1PF |
| Stantway Lane | GL14 1QG GL14 1QH |
| The Crescent | GL14 1LY |
| The Village | GL14 1LN GL14 1PA |
| Upper Rodley Road | GL14 1QU |
| Walmore Common | GL14 1PN |
| Wintles Hill | GL14 1QA GL14 1QB |
| GL14 1LW GL14 1PG GL14 1PH GL14 1QX GL14 1QY GL14 1QZ GL14 1RA GL14 1RD GL14 1RE |
Transport near Newnham And Westbury
- FAQ
- Price Paid By Year
- Property Type Price
Frequently asked questions about Newnham And Westbury
What is the average price for a property for sale in Newnham And Westbury?
The average price for a property for sale in Newnham And Westbury is £443,906. There are 174 property listings for sale in Newnham And Westbury.
What streets have the most expensive properties for sale in Newnham And Westbury?
The streets with the most expensive properties for sale in Newnham And Westbury are Northwood Green at an average of £625,833, The Village at an average of £397,916 and Denmark Villas at an average of £376,250.
What streets have the most affordable properties for sale in Newnham And Westbury?
The streets with the most affordable properties for sale in Newnham And Westbury are Upper Rodley Road at an average of £330,000, Colchester Close at an average of £350,000 and Stantway Lane at an average of £367,000.
Which train stations are available in or near Newnham And Westbury?
Some of the train stations available in or near Newnham And Westbury are Gloucester, Stonehouse and Cam and Dursley.
Property Price Paid in Newnham And Westbury by Year
The average sold property price by year was:
| Year | Average Sold Price | Price Change |
Sold Properties
|
|---|---|---|---|
| 2025 | £272,500 | -47% |
2 Properties |
| 2024 | £400,625 | -24% |
4 Properties |
| 2023 | £495,500 | 4% |
10 Properties |
| 2022 | £475,714 | 23% |
14 Properties |
| 2021 | £368,513 | 23% |
19 Properties |
| 2020 | £282,850 | -2% |
7 Properties |
| 2019 | £288,200 | -22% |
5 Properties |
| 2018 | £351,375 | -4% |
12 Properties |
| 2017 | £365,188 | 4% |
13 Properties |
| 2016 | £350,730 | 26% |
13 Properties |
| 2015 | £258,994 | -20% |
19 Properties |
| 2014 | £311,045 | 15% |
11 Properties |
| 2013 | £265,343 | 7% |
8 Properties |
| 2012 | £247,194 | -17% |
9 Properties |
| 2011 | £288,610 | 9% |
9 Properties |
| 2010 | £263,800 | -12% |
10 Properties |
| 2009 | £296,458 | -18% |
12 Properties |
| 2008 | £348,909 | 7% |
11 Properties |
| 2007 | £325,153 | 16% |
13 Properties |
| 2006 | £273,020 | 15% |
24 Properties |
| 2005 | £231,285 | 2% |
7 Properties |
| 2004 | £226,529 | -1% |
17 Properties |
| 2003 | £229,186 | 22% |
18 Properties |
| 2002 | £177,704 | 4% |
21 Properties |
| 2001 | £169,777 | -9% |
22 Properties |
| 2000 | £184,235 | 20% |
17 Properties |
| 1999 | £147,071 | 10% |
14 Properties |
| 1998 | £131,897 | 3% |
22 Properties |
| 1997 | £127,633 | 30% |
15 Properties |
| 1996 | £89,340 | -24% |
15 Properties |
| 1995 | £110,942 | - |
13 Properties |
Property Price per Property Type in Newnham And Westbury
Here you can find historic sold price data in order to help with your property search.
The average Property Paid Price for specific property types in the last three years are:
| Property Type | Average Sold Price | Sold Properties |
|---|---|---|
| Semi Detached House | £350,500.00 | 5 Semi Detached Houses |
| Detached House | £579,625.00 | 8 Detached Houses |
| Terraced House | £272,500.00 | 2 Terraced Houses |
| Flat | £168,000.00 | 1 Flat |

