
Houses for sale in Greenwich London Borough, England
House Prices in Greenwich London Borough
Properties in Greenwich London Borough have
an average house price of
£499k
and had 8,464 Property Transactions
within the last 3 years.¹
Greenwich London Borough is a location in
England with
114,774 households², where the most expensive property was sold for £4.6M.
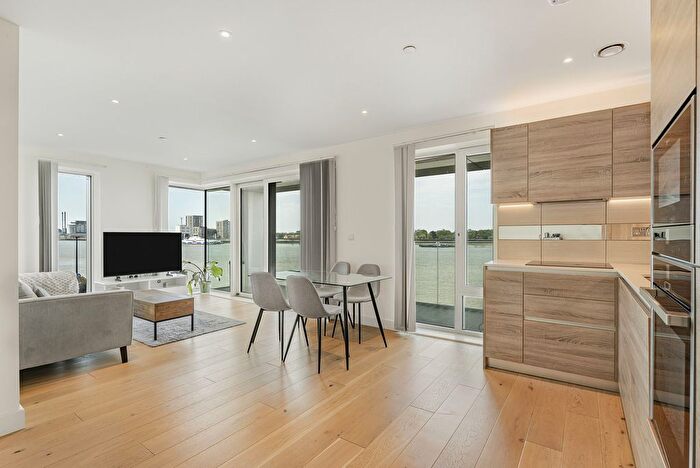
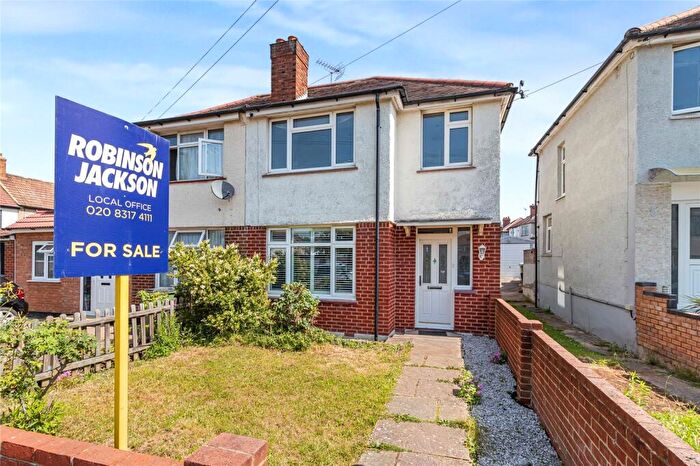
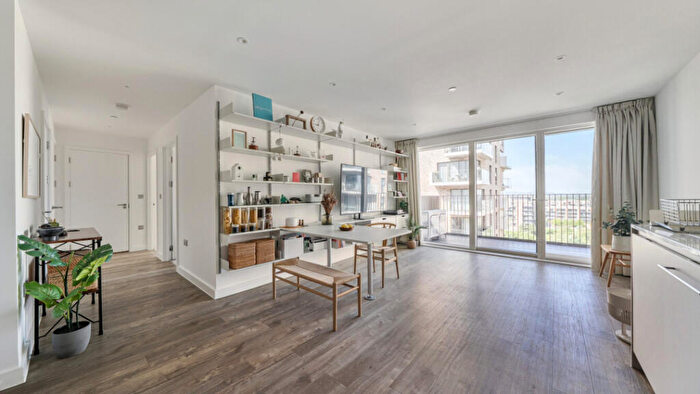
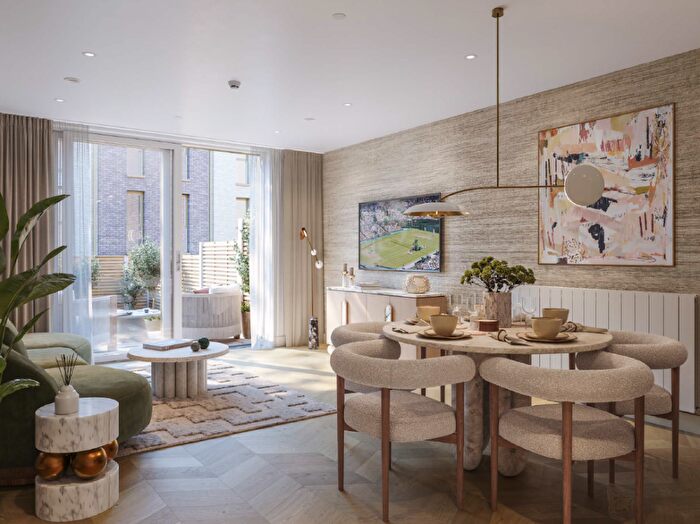
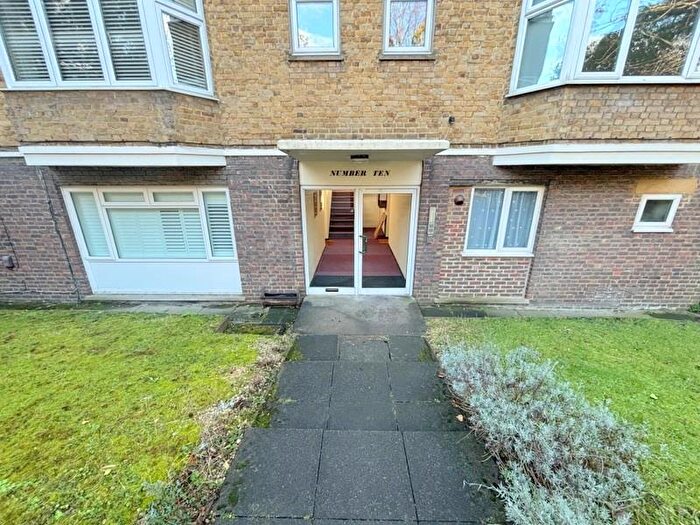
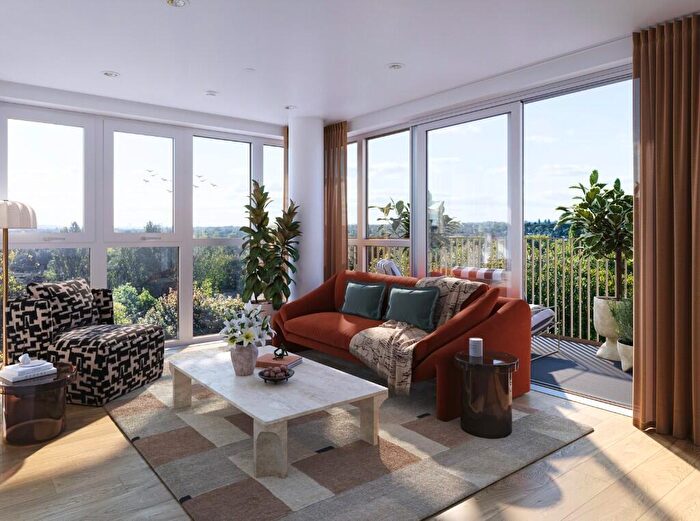
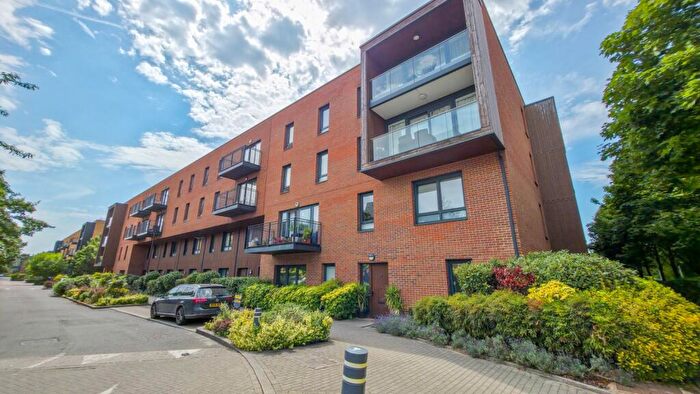
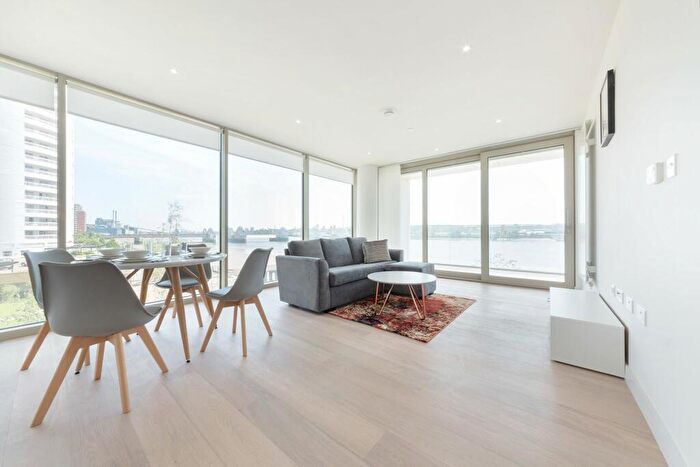
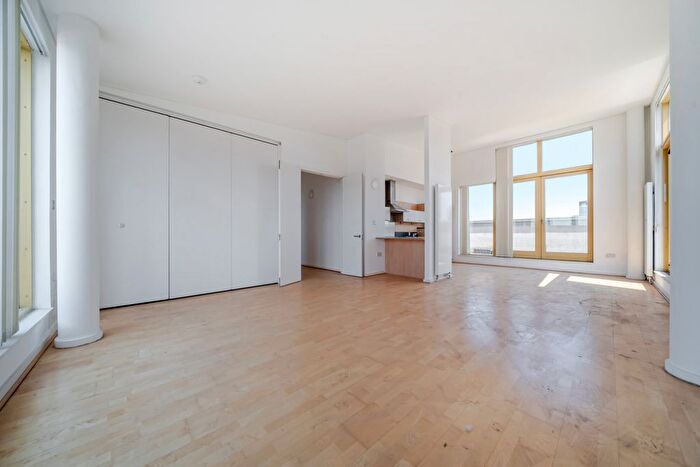
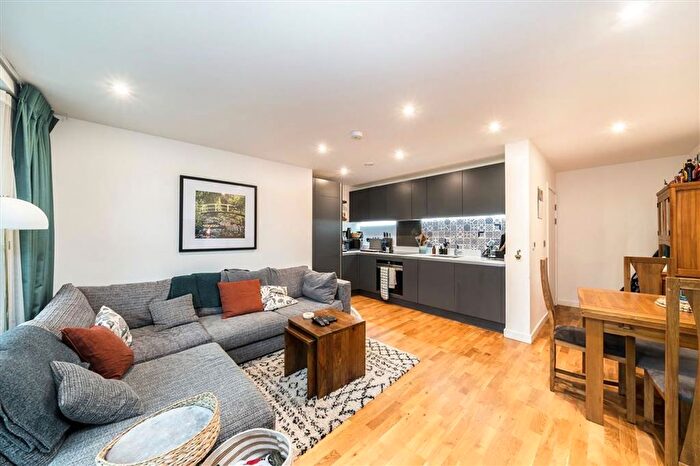
Properties for sale in Greenwich London Borough
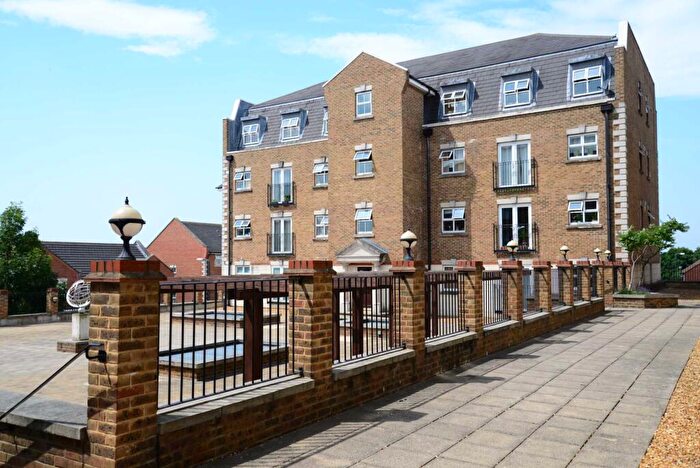
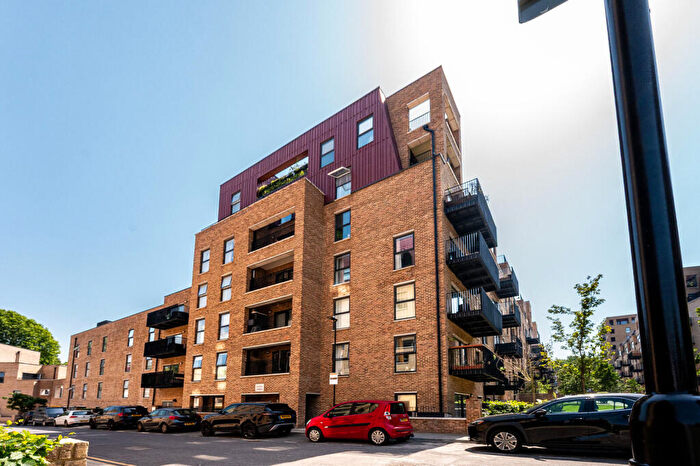
![]()
If you are looking to sell your house, let it out, or receive a property valuation, an expert can help you.
Click the button below to get started.


Towns in Greenwich London Borough
Navigate through our locations to find the location of your next house in Greenwich, England for sale or to rent.
Property price trends in Greenwich London Borough
According to the latest Land Registry data, the average home in Greenwich London Borough sold for £495,607 in 2026. That figure comes from a substantial record of 115,312 sales logged over the past 31 years.
Prices have held fairly steady over the last three years. Compared with 2023, when the typical sale came in around £491,630, values are broadly unchanged.
Looking back five years, average prices are up about 0.4% since 2021, a gain of around £2,075 in cash terms.
Zoom out to the past decade for the fuller picture. Back in 2016, homes here averaged £437,292, so the typical sold price has climbed about 13.3% since then, roughly 1.3% a year. Stretch the view to fifteen years and that annual pace edges up closer to 3.5%.
Frequently asked questions about Greenwich London Borough
What is the average price for a property for sale in Greenwich London Borough?
The average price for a property for sale in Greenwich London Borough is £498,891. This amount is 39% higher than the average price in England. There are more than 10,000 property listings for sale in Greenwich London Borough.
What locations have the most expensive properties for sale in Greenwich London Borough?
The locations with the most expensive properties for sale in Greenwich London Borough are London at an average of £498,955 and Sidcup at an average of £480,384.
What locations have the most affordable properties for sale in Greenwich London Borough?
The location with the most affordable properties for sale in Greenwich London Borough is Chislehurst at an average of £476,031.
Which train stations are available in or near Greenwich London Borough?
Some of the train stations available in or near Greenwich London Borough are Woolwich Dockyard, Charlton and Woolwich Arsenal.
Property Price Paid in Greenwich London Borough by Year
The average sold property price by year was:
| Year | Average Sold Price | Price Change |
Sold Properties
|
|---|---|---|---|
| 2026 | £495,607 | -1% |
483 Properties |
| 2025 | £500,316 | -1% |
2,671 Properties |
| 2024 | £504,590 | 3% |
2,804 Properties |
| 2023 | £491,630 | -3% |
2,506 Properties |
| 2022 | £505,414 | 2% |
3,089 Properties |
| 2021 | £493,532 | -2% |
3,788 Properties |
| 2020 | £503,562 | 3% |
3,088 Properties |
| 2019 | £486,204 | 5% |
3,778 Properties |
| 2018 | £464,187 | 2% |
3,867 Properties |
| 2017 | £455,012 | 4% |
3,861 Properties |
Property Price per Property Type in Greenwich London Borough
Here you can find historic sold price data in order to help with your property search.
The average Property Paid Price for specific property types in the last three years are:
| Property Type | Average Sold Price | Sold Properties |
|---|---|---|
| Semi Detached House | £640,925.00 | 1,139 Semi Detached Houses |
| Terraced House | £552,567.00 | 3,108 Terraced Houses |
| Detached House | £1,010,759.00 | 208 Detached Houses |
| Flat | £390,369.00 | 4,009 Flats |
Transport in Greenwich London Borough
Please see below transportation links in this area:


