
Houses for sale in Newham London Borough, England
House Prices in Newham London Borough
Properties in Newham London Borough have
an average house price of
£430k
and had 6,252 Property Transactions
within the last 3 years.¹
Newham London Borough is a location in
England with
115,771 households², where the most expensive property was sold for £2.63M.
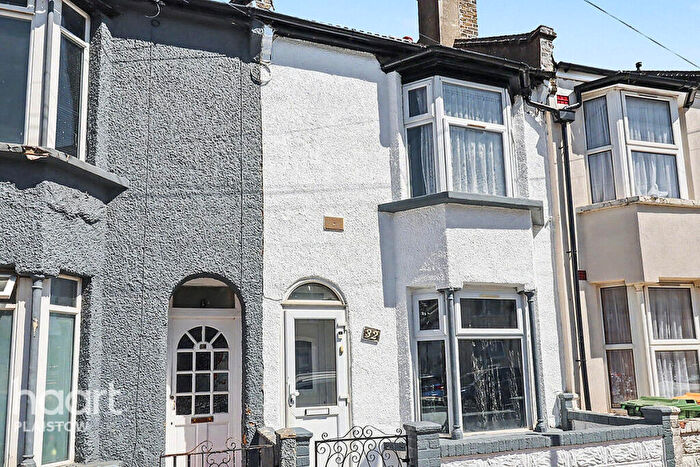
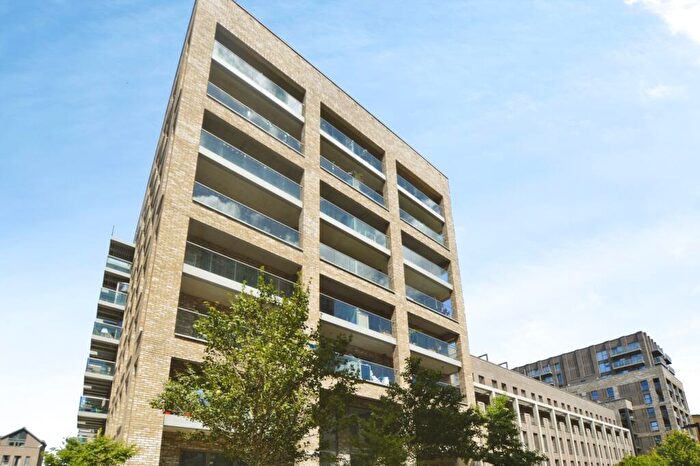
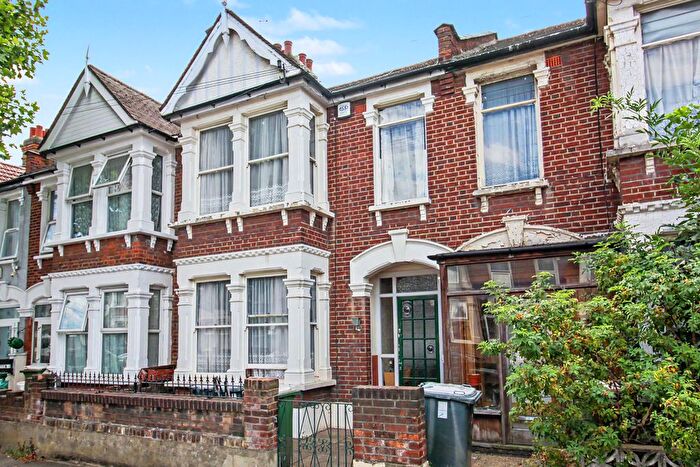
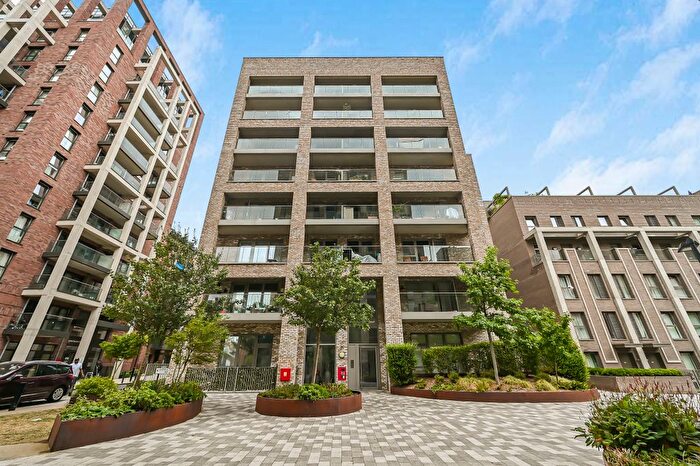
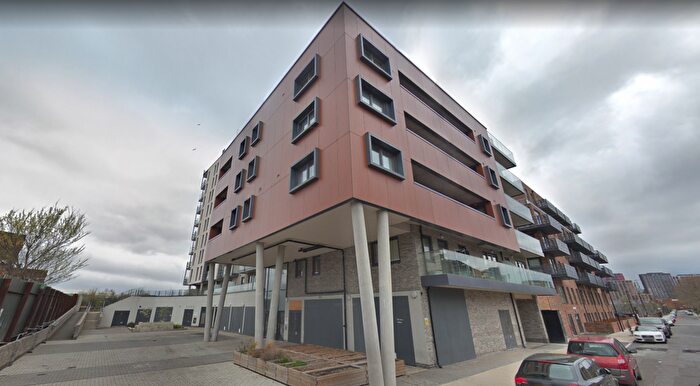
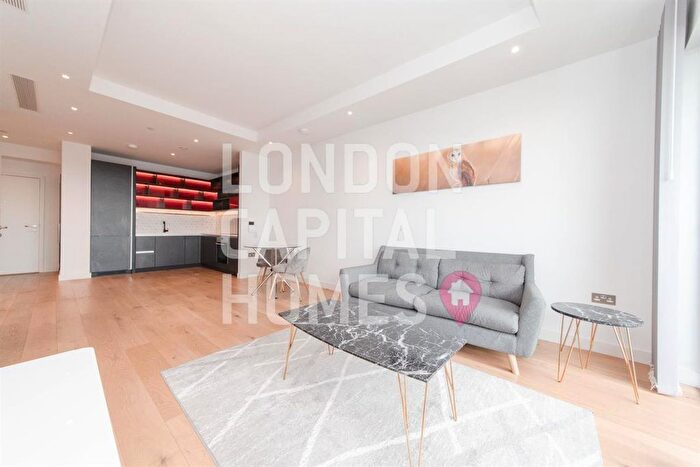
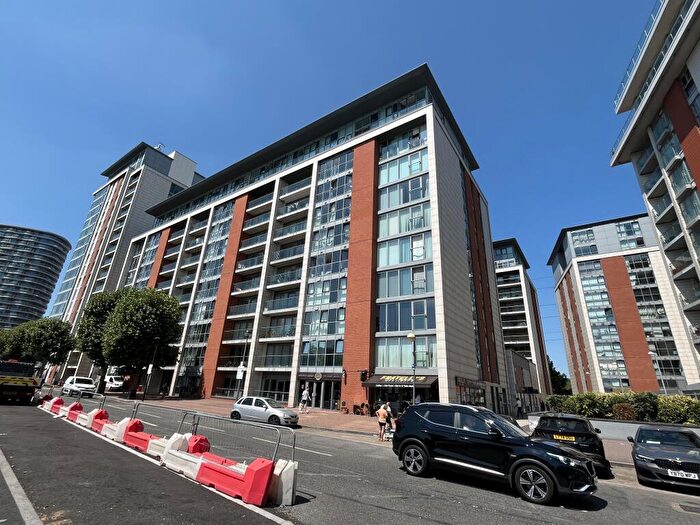
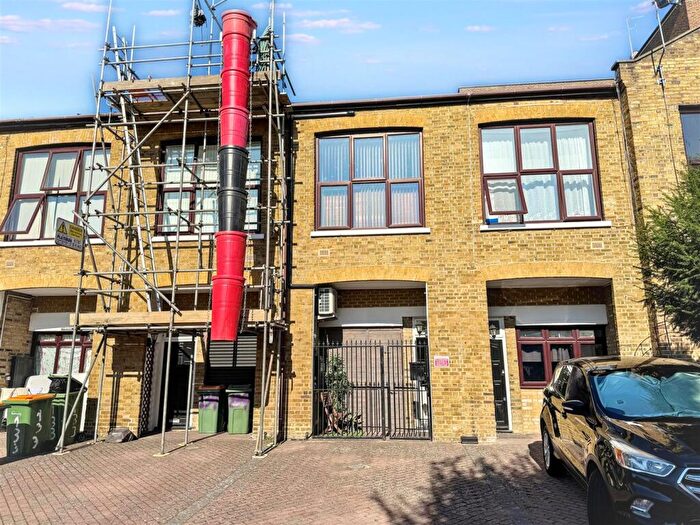
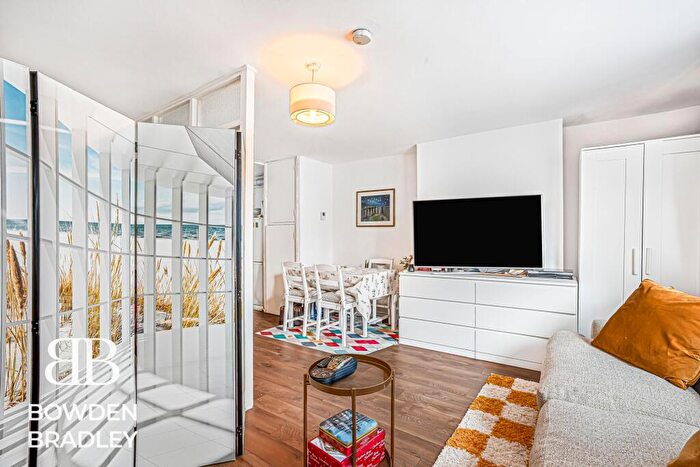
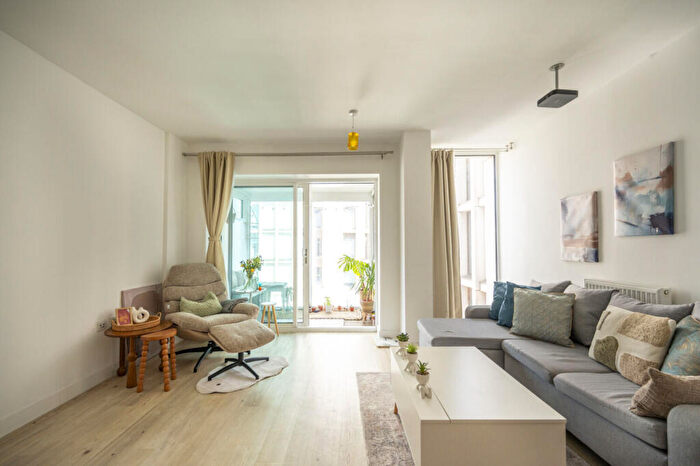
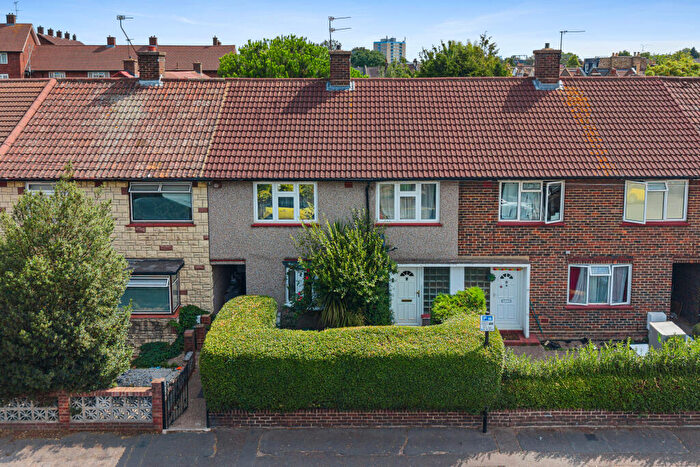
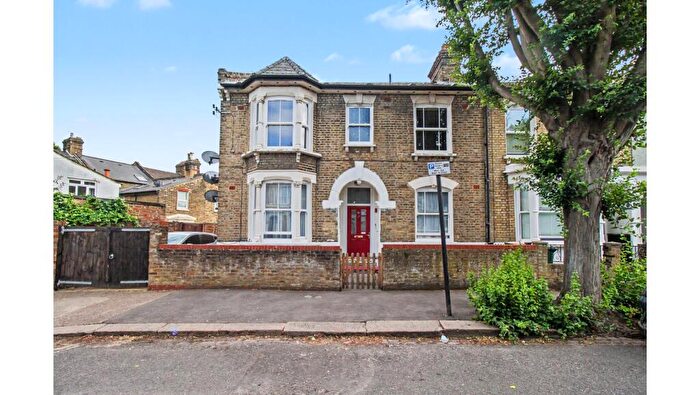
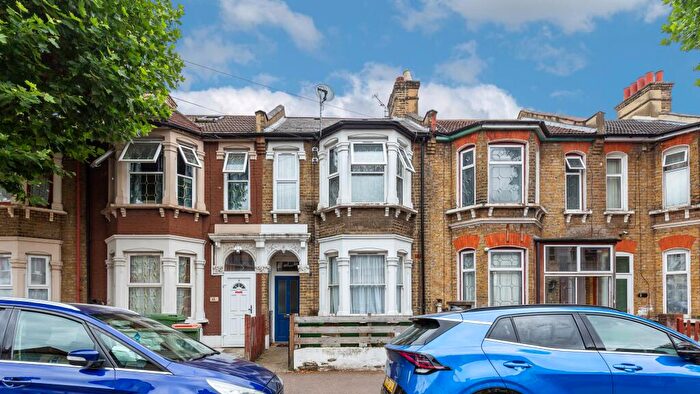
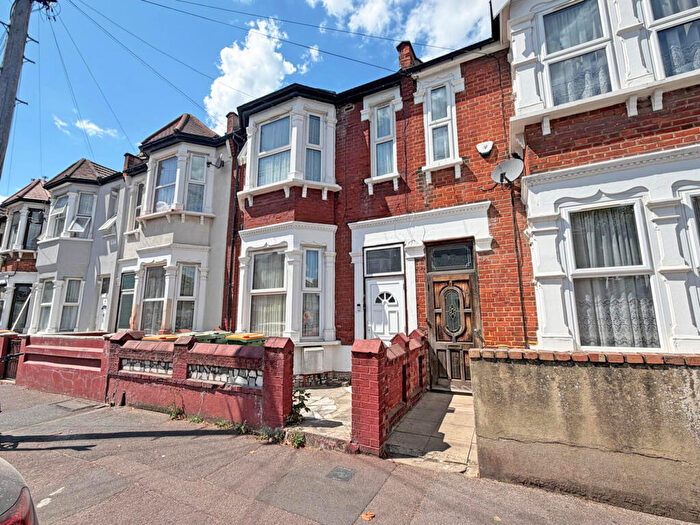
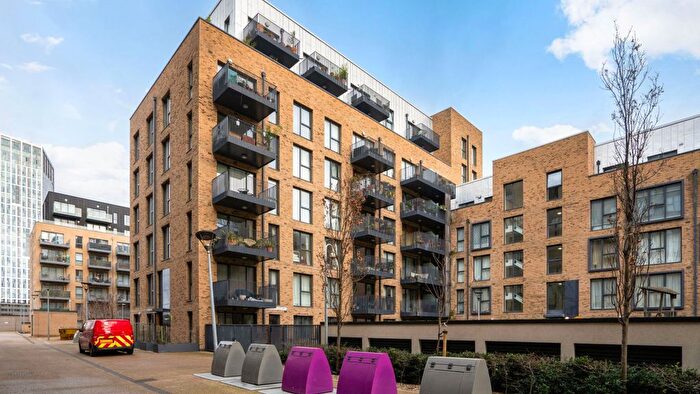
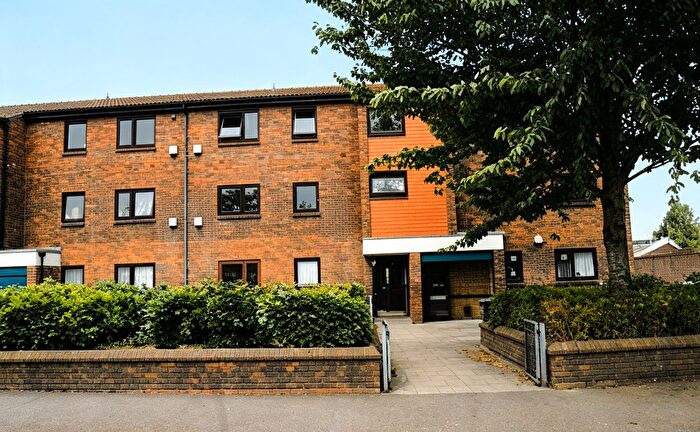
Properties for sale in Newham London Borough
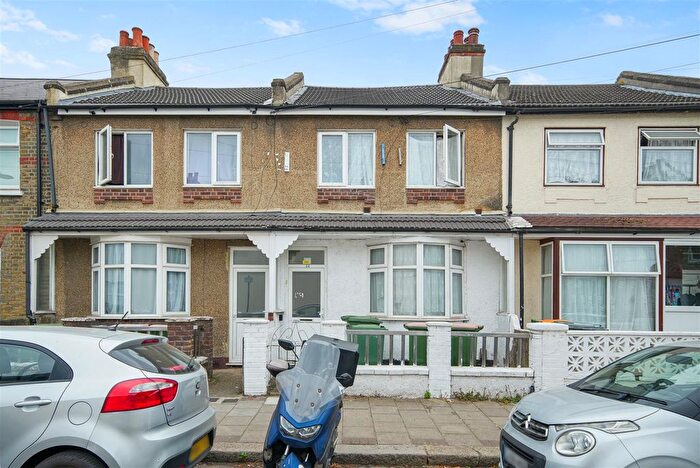
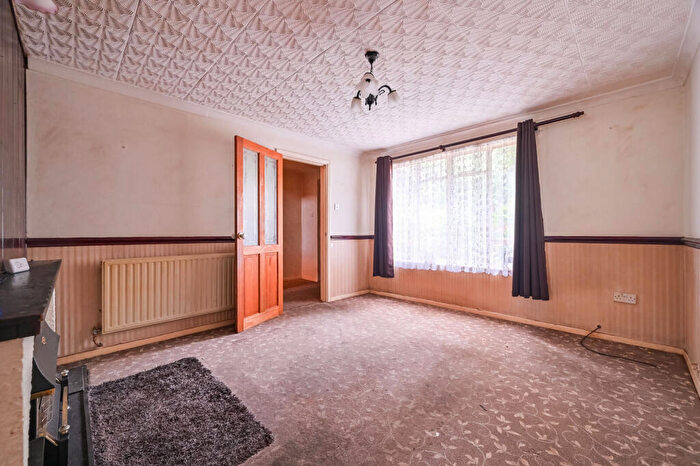
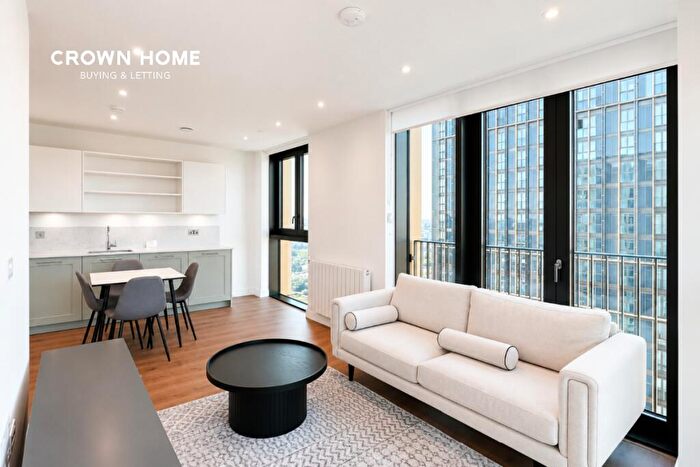
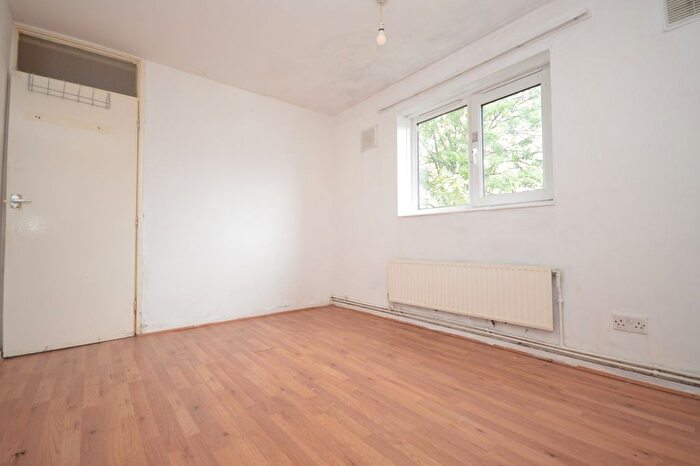
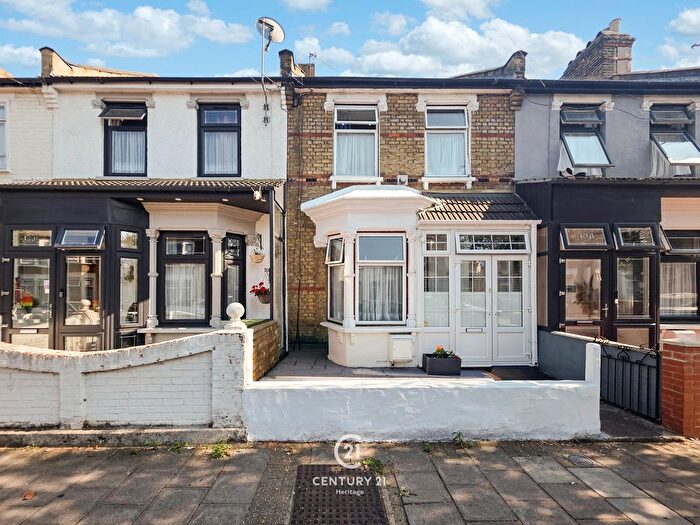
![]()
If you are looking to sell your house, let it out, or receive a property valuation, an expert can help you.
Click the button below to get started.
Towns in Newham London Borough
Navigate through our locations to find the location of your next house in Newham, England for sale or to rent.
Property price trends in Newham London Borough
According to the latest Land Registry data, the average home in Newham London Borough sold for £424,164 in 2026. That figure comes from a substantial record of 103,596 sales logged over the past 31 years.
Prices have held fairly steady over the last three years. Compared with 2023, when the typical sale came in around £427,469, values are broadly unchanged.
Looking back five years, average prices are up about 1.2% since 2021, a gain of around £4,841 in cash terms.
Zoom out to the past decade for the fuller picture. Back in 2016, homes here averaged £368,306, so the typical sold price has climbed about 15.2% since then, roughly 1.4% a year. Stretch the view to fifteen years and that annual pace edges up closer to 4.6%.
Frequently asked questions about Newham London Borough
What is the average price for a property for sale in Newham London Borough?
The average price for a property for sale in Newham London Borough is £430,496. This amount is 20% higher than the average price in England. There are more than 10,000 property listings for sale in Newham London Borough.
Which train stations are available in or near Newham London Borough?
Some of the train stations available in or near Newham London Borough are West Ham, Forest Gate and Woodgrange Park.
Which tube stations are available in or near Newham London Borough?
Some of the tube stations available in or near Newham London Borough are Upton Park, Plaistow and West Ham.
Property Price Paid in Newham London Borough by Year
The average sold property price by year was:
| Year | Average Sold Price | Price Change |
Sold Properties
|
|---|---|---|---|
| 2026 | £424,164 | -2% |
359 Properties |
| 2025 | £433,783 | 1% |
2,008 Properties |
| 2024 | £431,081 | 1% |
2,057 Properties |
| 2023 | £427,469 | -3% |
1,828 Properties |
| 2022 | £440,207 | 5% |
2,264 Properties |
| 2021 | £419,323 | 3% |
2,691 Properties |
| 2020 | £406,158 | -10% |
1,950 Properties |
| 2019 | £448,698 | 4% |
3,302 Properties |
| 2018 | £431,381 | 8% |
3,878 Properties |
| 2017 | £398,190 | 8% |
4,561 Properties |
Property Price per Property Type in Newham London Borough
Here you can find historic sold price data in order to help with your property search.
The average Property Paid Price for specific property types in the last three years are:
| Property Type | Average Sold Price | Sold Properties |
|---|---|---|
| Semi Detached House | £537,493.00 | 187 Semi Detached Houses |
| Terraced House | £481,925.00 | 3,112 Terraced Houses |
| Detached House | £687,888.00 | 27 Detached Houses |
| Flat | £366,584.00 | 2,926 Flats |
Transport in Newham London Borough
Please see below transportation links in this area:


