
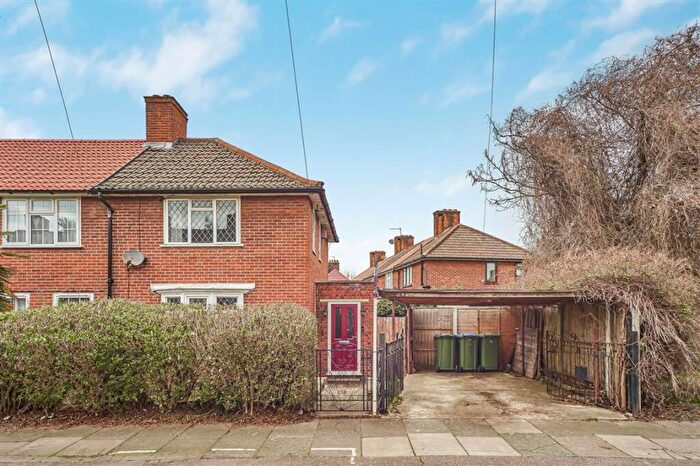
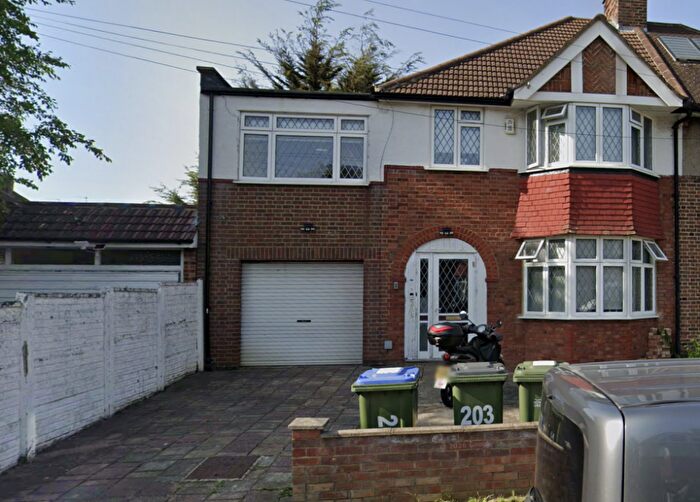
Houses for sale & to rent in London, Greenwich London Borough
House Prices in London, Greenwich London Borough
Properties in this part of London within the Greenwich London Borough have an average house price of £500k and had 7,444 Property Transactions within the last 3 years.¹ This area has 100,164 households² , where the most expensive property was sold for £4.6M.
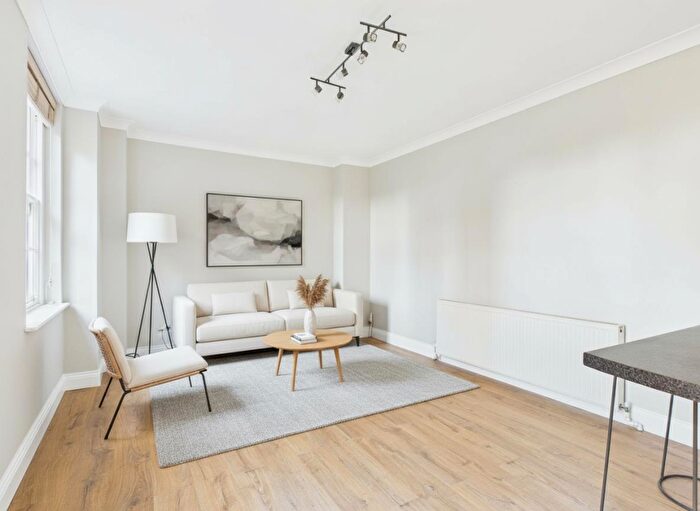
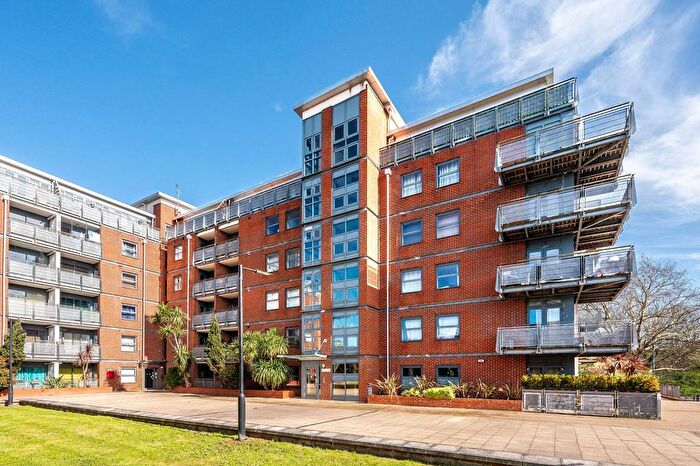
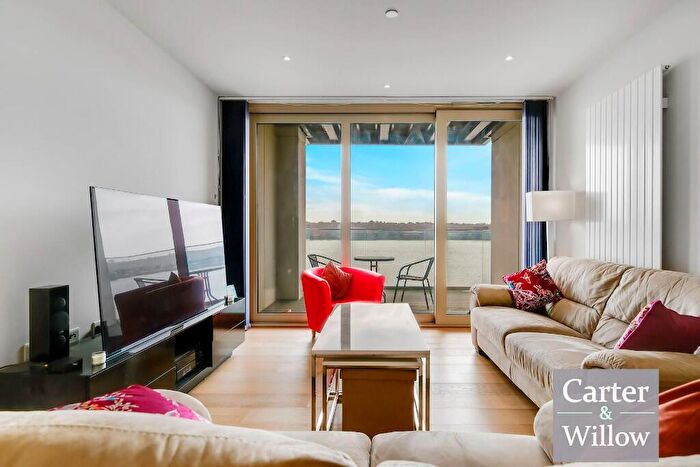
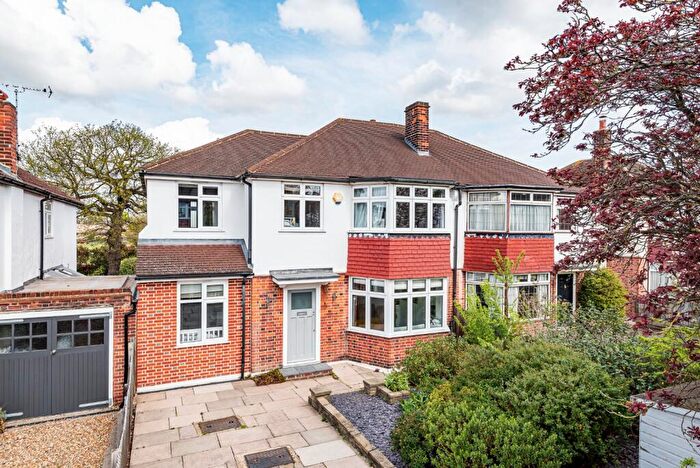
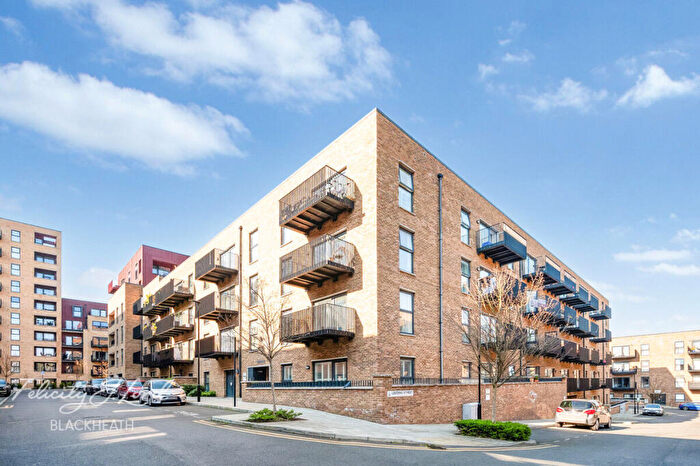
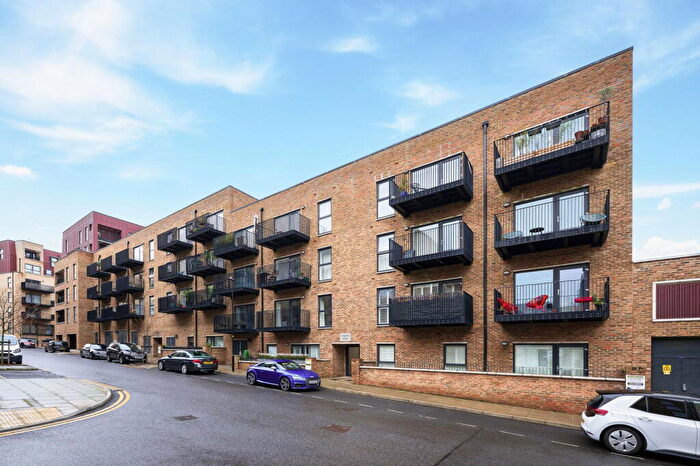
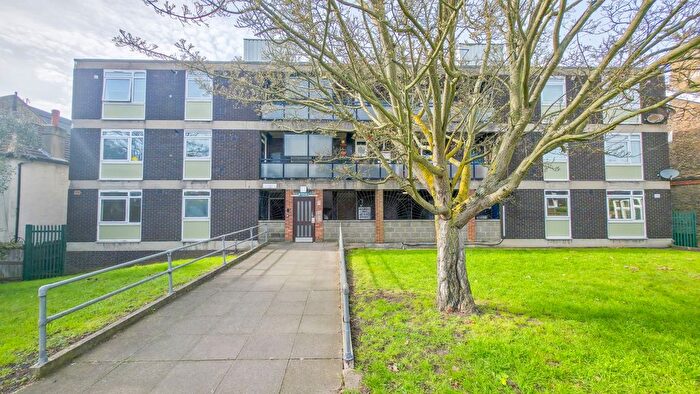
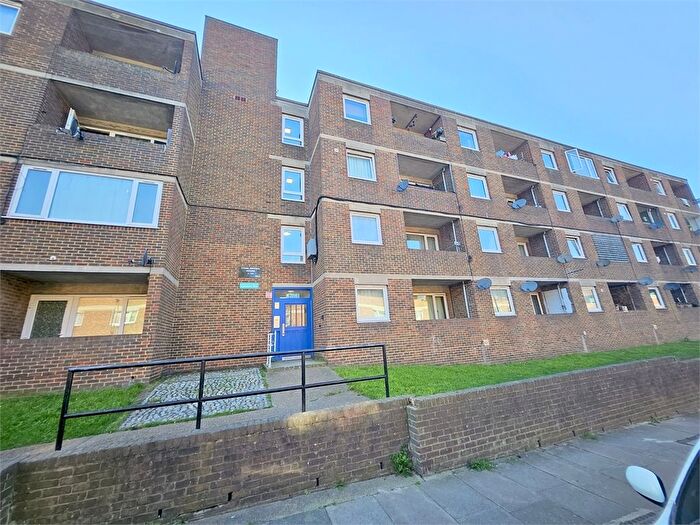
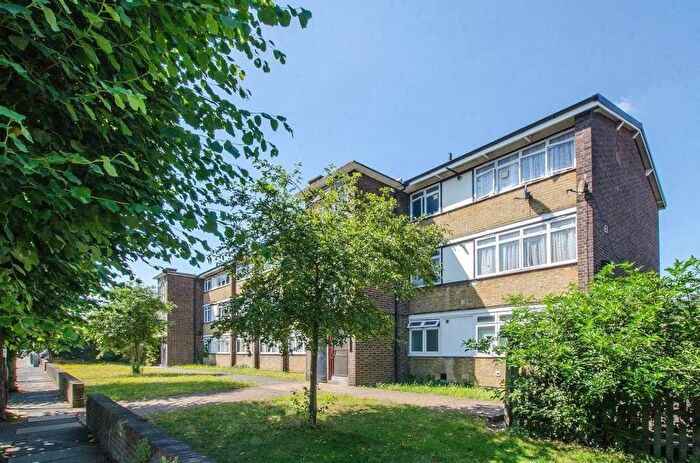
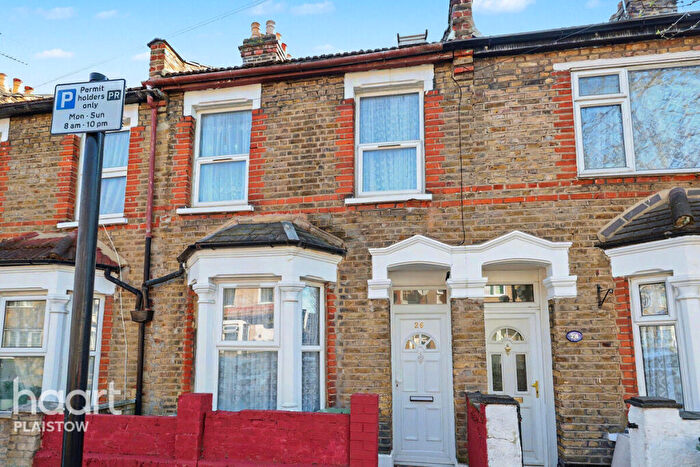
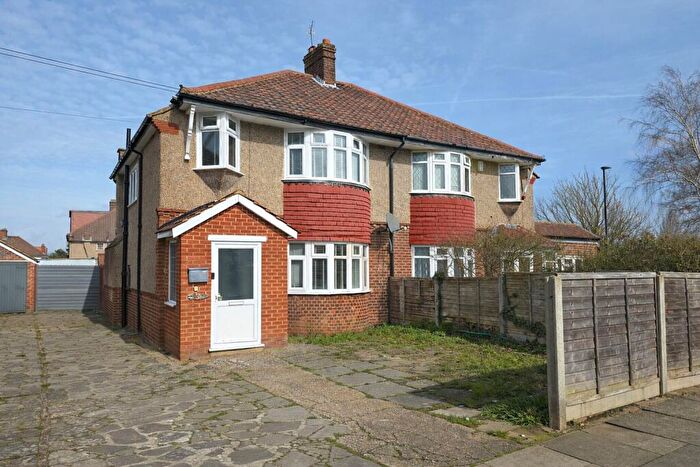
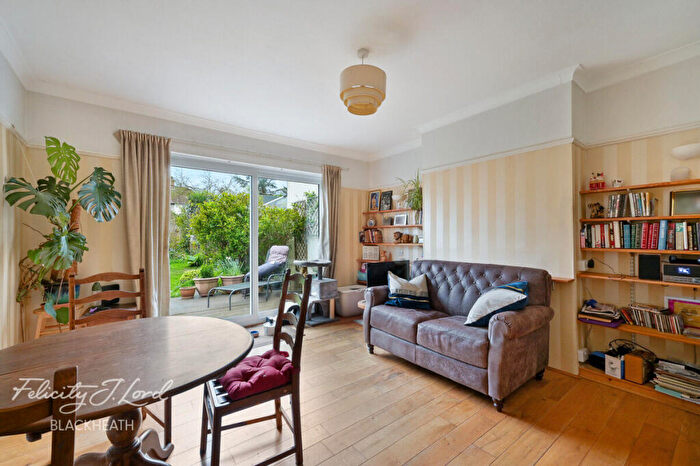
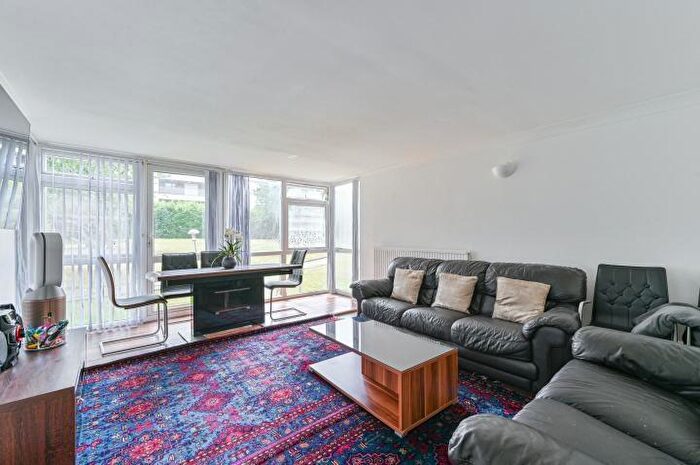
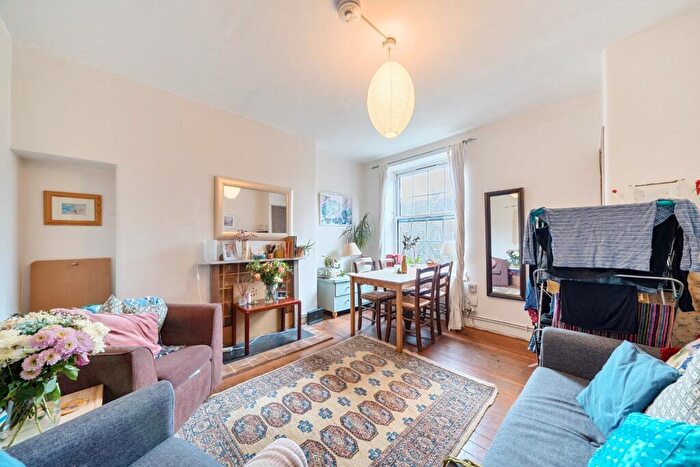
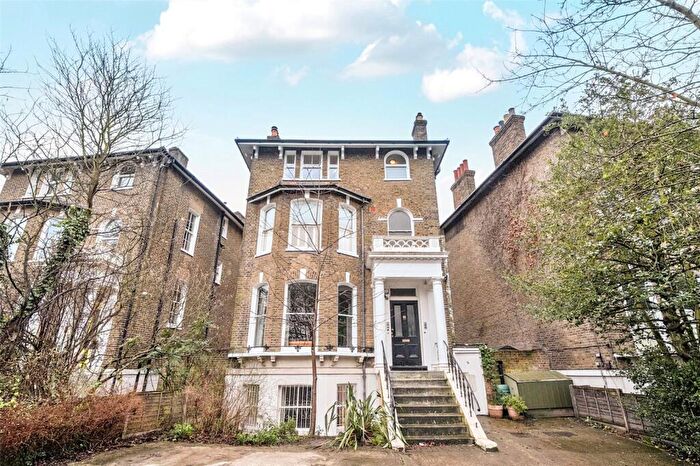
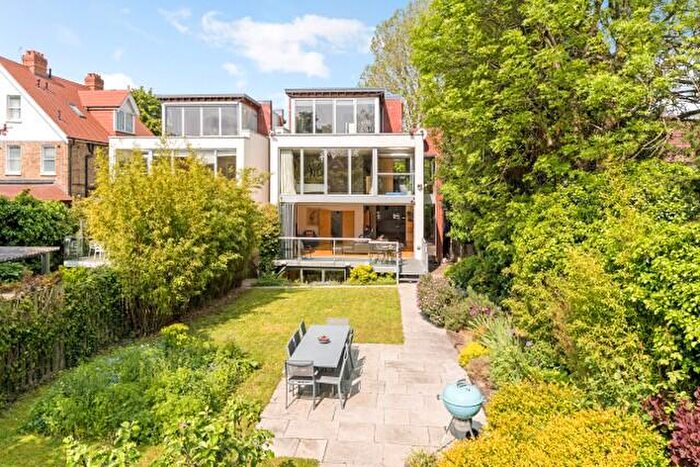
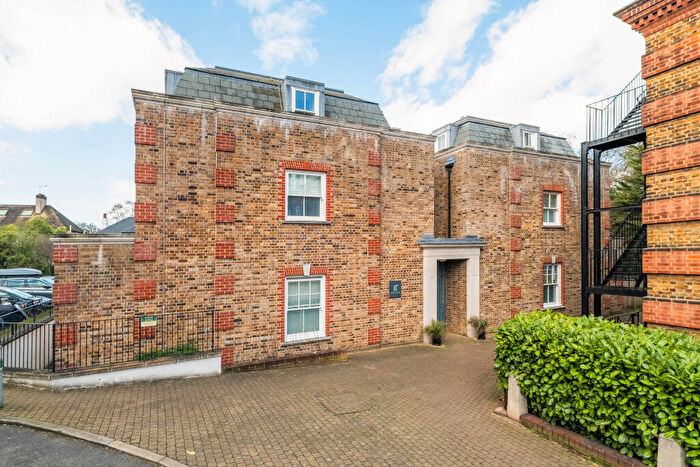
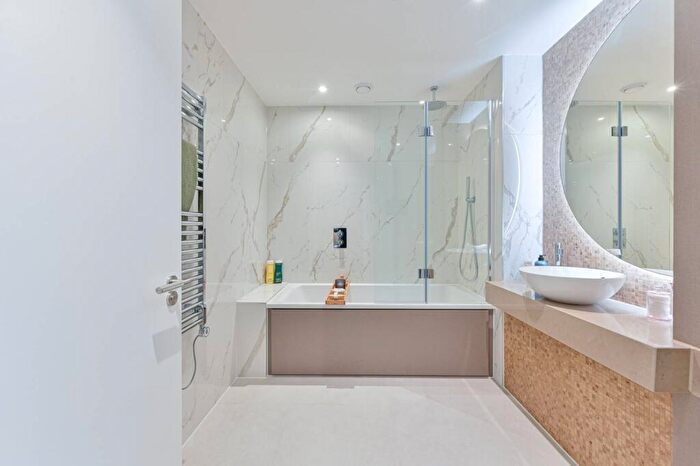
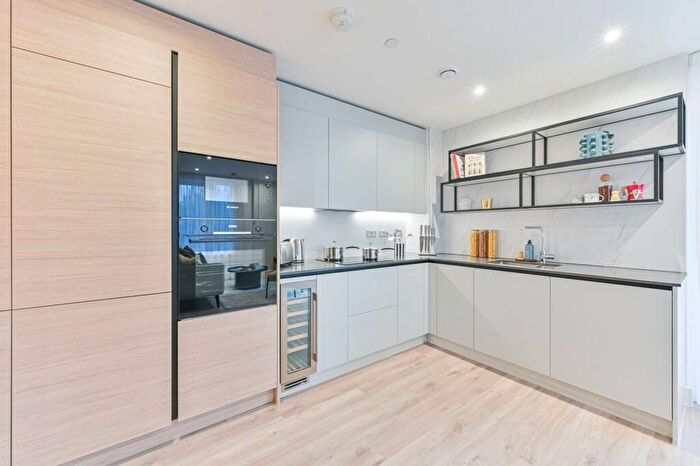
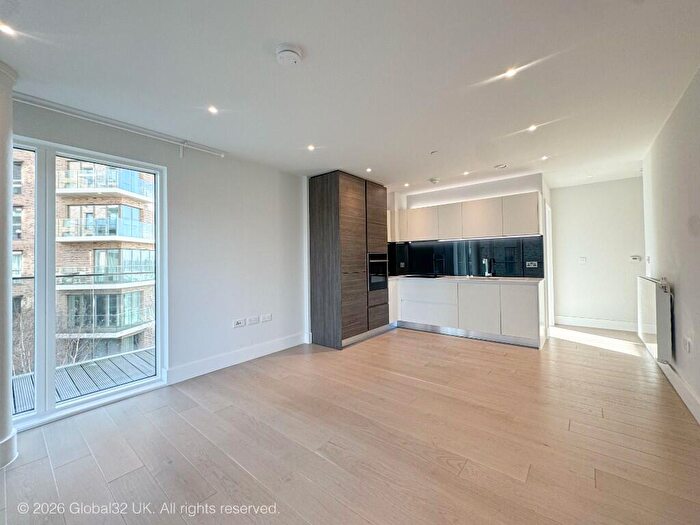
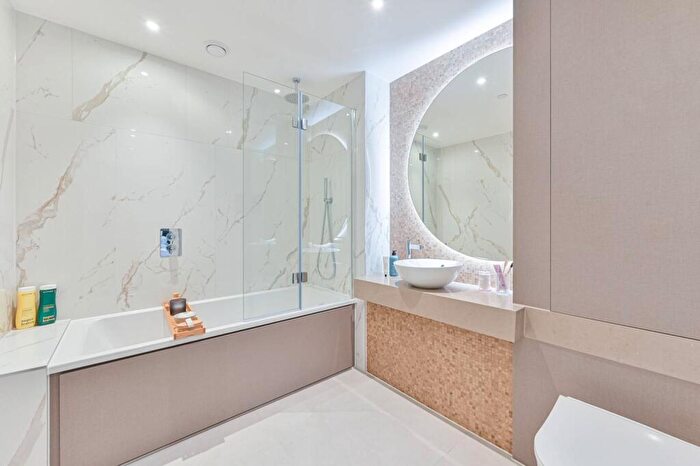
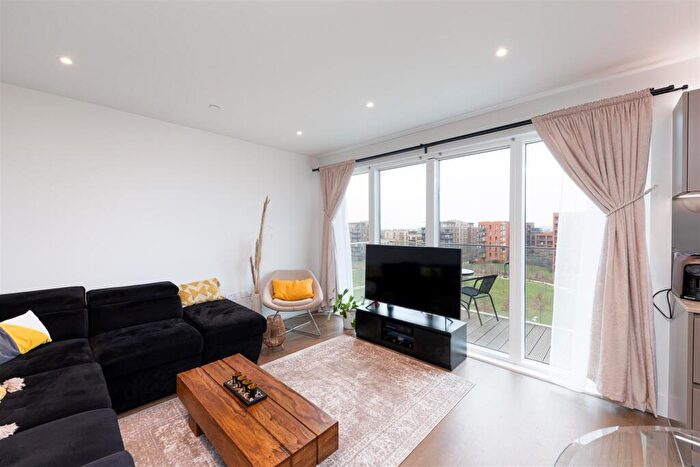
Properties for sale in London, Greenwich London Borough
![]()
If you are looking to sell your house, let it out, or receive a property valuation, an expert can help you.
Click the button below to get started.
Neighbourhoods in London, Greenwich London Borough
Navigate through our locations to find the location of your next house in London, Greenwich London Borough for sale or to rent.
- Abbey Wood
- Blackheath Westcombe
- Charlton
- Coldharbour And New Eltham
- Eltham North
- Eltham South
- Eltham West
- Glyndon
- Greenwich West
- Kidbrooke With Hornfair
- Middle Park And Sutcliffe
- Peninsula
- Plumstead
- Shooters Hill
- Thamesmead Moorings
- Woolwich Common
- Woolwich Riverside
- Greenwich Peninsula
- East Greenwich
- Plumstead & Glyndon
- Kidbrooke Village & Sutcliffe
- Charlton Village & Riverside
- Greenwich Park
- Greenwich Creekside
- Eltham Town & Avery Hill
- Middle Park & Horn Park
- Plumstead Common
- Woolwich Dockyard
- Woolwich Arsenal
- West Thamesmead
- Mottingham, Coldharbour & New Eltham
Transport in London, Greenwich London Borough
Please see below transportation links in this area:
-
 Woolwich Dockyard Station
 -
Charlton Station
-
 Woolwich Arsenal Station
 -
Kidbrooke Station
-
 Woolwich Station
 -
Eltham Station
-
Westcombe Park Station
-
Falconwood Station
-
Plumstead Station
-
King George V Station
- FAQ
- Price Paid By Year
- Property Type Price
Frequently asked questions about London, Greenwich London Borough
What is the average price for a property for sale in London, Greenwich London Borough?
The average price for a property for sale in London, Greenwich London Borough is £499,852. There are more than 10,000 property listings for sale in London, Greenwich London Borough.
What locations have the most expensive properties for sale in London, Greenwich London Borough?
The locations with the most expensive properties for sale in London, Greenwich London Borough are Blackheath Westcombe at an average of £706,019, Greenwich West at an average of £622,254 and Eltham North at an average of £583,835.
What locations have the most affordable properties for sale in London, Greenwich London Borough?
The locations with the most affordable properties for sale in London, Greenwich London Borough are Thamesmead Moorings at an average of £317,533, Woolwich Common at an average of £371,200 and Glyndon at an average of £372,900.
Which train stations are available in or near London, Greenwich London Borough?
Some of the train stations available in or near London, Greenwich London Borough are Woolwich Dockyard, Charlton and Woolwich Arsenal.
Property Price Paid in London, Greenwich London Borough by Year
The average sold property price by year was:
| Year | Average Sold Price | Price Change |
Sold Properties
|
|---|---|---|---|
| 2025 | £502,575 | -0,5% |
2,173 Properties |
| 2024 | £505,057 | 3% |
2,780 Properties |
| 2023 | £491,666 | -3% |
2,491 Properties |
| 2022 | £505,864 | 2% |
3,073 Properties |
| 2021 | £493,660 | -2% |
3,768 Properties |
| 2020 | £503,943 | 3% |
3,072 Properties |
| 2019 | £486,375 | 5% |
3,769 Properties |
| 2018 | £464,295 | 2% |
3,849 Properties |
| 2017 | £455,122 | 4% |
3,854 Properties |
| 2016 | £437,351 | 10% |
4,211 Properties |
| 2015 | £393,090 | 9% |
4,414 Properties |
| 2014 | £359,299 | 8% |
4,790 Properties |
| 2013 | £329,070 | 10% |
3,584 Properties |
| 2012 | £295,611 | -0,4% |
2,759 Properties |
| 2011 | £296,803 | -0,1% |
2,562 Properties |
| 2010 | £297,008 | 11% |
2,226 Properties |
| 2009 | £265,586 | -1% |
1,950 Properties |
| 2008 | £267,837 | 3% |
2,414 Properties |
| 2007 | £260,321 | 9% |
5,203 Properties |
| 2006 | £237,622 | 5% |
5,278 Properties |
| 2005 | £225,579 | 7% |
4,663 Properties |
| 2004 | £209,162 | 7% |
5,358 Properties |
| 2003 | £194,491 | 9% |
4,842 Properties |
| 2002 | £176,624 | 16% |
5,441 Properties |
| 2001 | £148,851 | 12% |
4,817 Properties |
| 2000 | £130,910 | 14% |
3,839 Properties |
| 1999 | £111,939 | 16% |
4,307 Properties |
| 1998 | £93,836 | 11% |
3,470 Properties |
| 1997 | £83,052 | 8% |
3,424 Properties |
| 1996 | £76,051 | 4% |
2,987 Properties |
| 1995 | £72,991 | - |
2,531 Properties |
Property Price per Property Type in London, Greenwich London Borough
Here you can find historic sold price data in order to help with your property search.
The average Property Paid Price for specific property types in the last three years are:
| Property Type | Average Sold Price | Sold Properties |
|---|---|---|
| Semi Detached House | £644,067.00 | 995 Semi Detached Houses |
| Terraced House | £553,296.00 | 2,738 Terraced Houses |
| Detached House | £1,009,755.00 | 178 Detached Houses |
| Flat | £392,128.00 | 3,533 Flats |