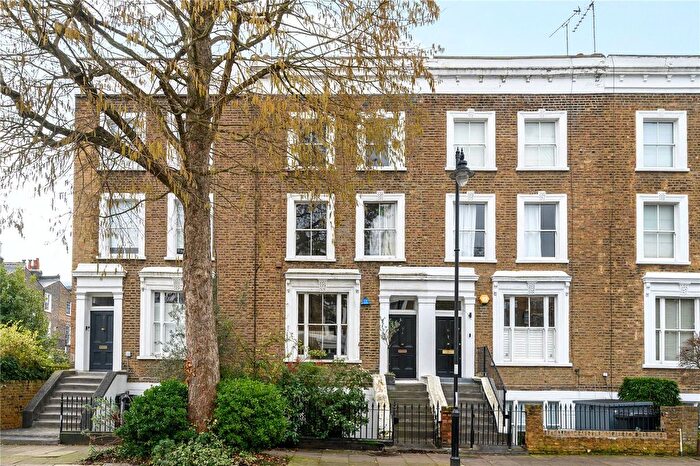
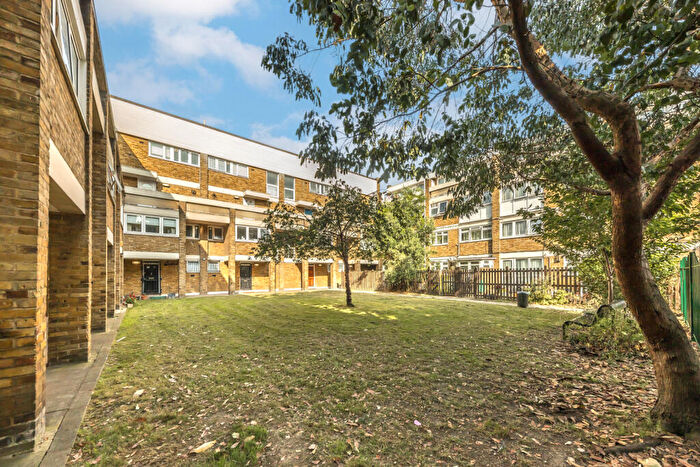
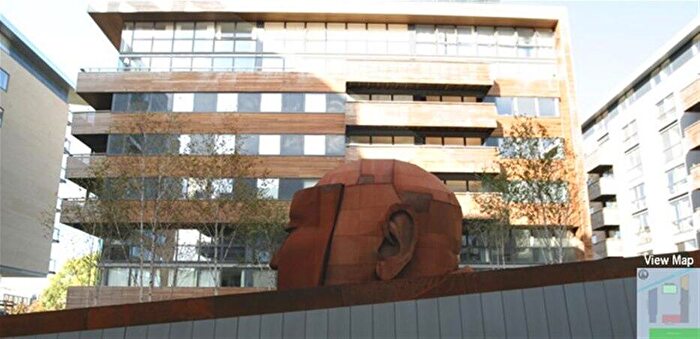
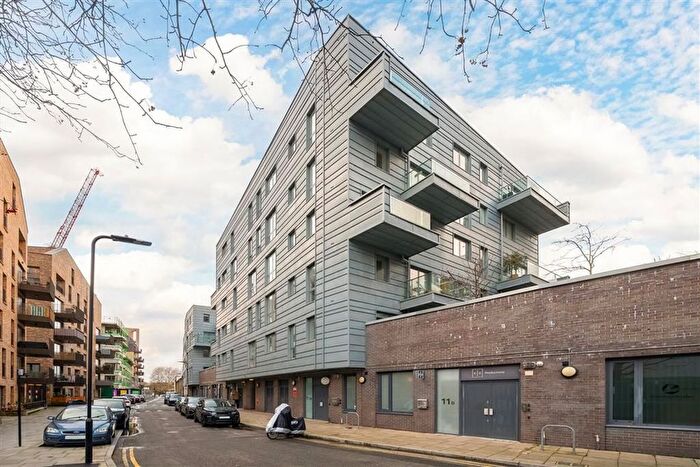
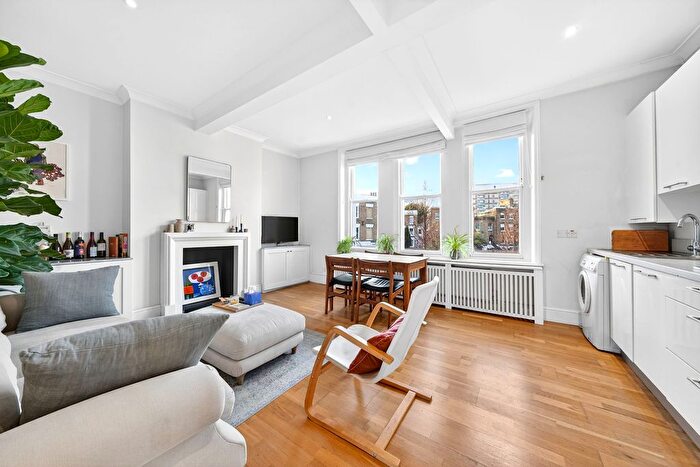
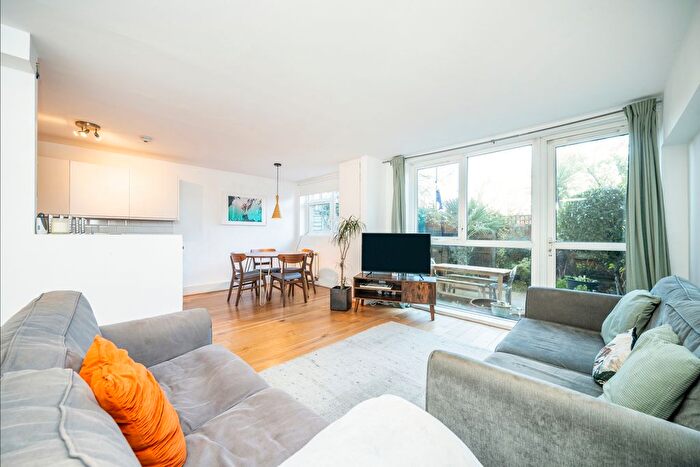
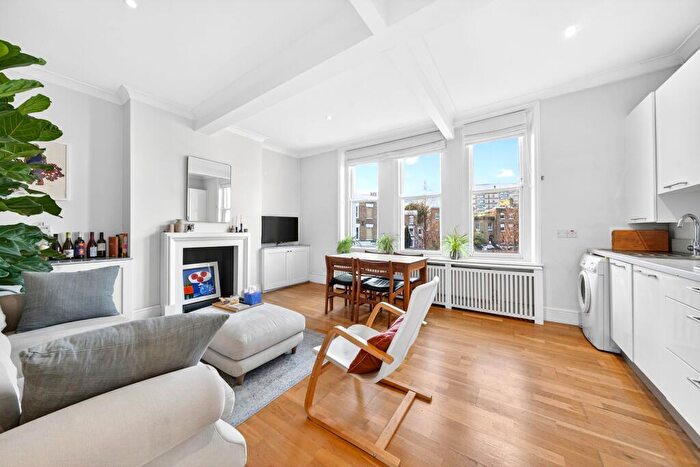
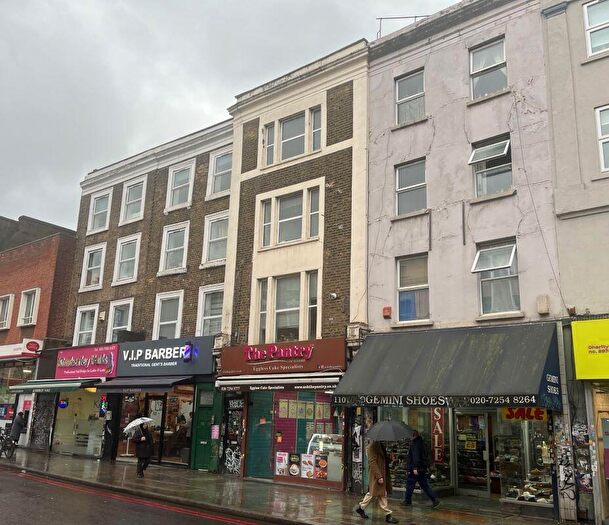
Houses for sale & to rent in De Beauvoir, London
House Prices in De Beauvoir
Properties in this part of De Beauvoir within London have an average house price of £917,458.00 and had 246 Property Transactions within the last 3 years¹. This area has 3,717 households² , where the most expensive property was sold for £5,600,000.00.
Properties for sale in De Beauvoir
Roads and Postcodes in De Beauvoir
Navigate through our locations to find the location of your next house in De Beauvoir, London for sale or to rent.
Transport near De Beauvoir
-
Haggerston Station
-
Dalston Junction Station
-
Dalston (Kingsland) Station
-
Essex Road Station
-
Canonbury Station
-
Hoxton Station
-
London Fields Station
-
Hackney Downs Station
-
Highbury and Islington Station
-
Old Street Station
- FAQ
- Price Paid By Year
- Property Type Price
Frequently asked questions about De Beauvoir
What is the average price for a property for sale in De Beauvoir?
The average price for a property for sale in De Beauvoir is £917,458. This amount is 32% higher than the average price in London. There are 6,584 property listings for sale in De Beauvoir.
What streets have the most expensive properties for sale in De Beauvoir?
The streets with the most expensive properties for sale in De Beauvoir are Northchurch Road at an average of £3,250,000, Northchurch Terrace at an average of £2,835,000 and Ufton Grove at an average of £2,350,000.
What streets have the most affordable properties for sale in De Beauvoir?
The streets with the most affordable properties for sale in De Beauvoir are De Beauvoir Estate at an average of £318,183, Balmes Road at an average of £399,666 and Bentley Road at an average of £482,350.
Which train stations are available in or near De Beauvoir?
Some of the train stations available in or near De Beauvoir are Haggerston, Dalston Junction and Dalston (Kingsland).
Which tube stations are available in or near De Beauvoir?
Some of the tube stations available in or near De Beauvoir are Highbury and Islington and Old Street.
Property Price Paid in De Beauvoir by Year
The average sold property price by year was:
| Year | Average Sold Price | Price Change |
Sold Properties
|
|---|---|---|---|
| 2025 | £838,201 | -12% |
73 Properties |
| 2024 | £937,708 | -4% |
111 Properties |
| 2023 | £974,524 | 13% |
62 Properties |
| 2022 | £845,007 | -3% |
137 Properties |
| 2021 | £866,826 | 6% |
113 Properties |
| 2020 | £816,178 | 24% |
76 Properties |
| 2019 | £616,599 | -27% |
83 Properties |
| 2018 | £783,807 | 5% |
92 Properties |
| 2017 | £745,723 | -5% |
81 Properties |
| 2016 | £785,822 | 11% |
90 Properties |
| 2015 | £698,306 | 13% |
108 Properties |
| 2014 | £608,992 | 20% |
102 Properties |
| 2013 | £484,788 | 7% |
230 Properties |
| 2012 | £453,201 | -12% |
158 Properties |
| 2011 | £509,351 | 4% |
91 Properties |
| 2010 | £487,422 | 17% |
109 Properties |
| 2009 | £404,044 | 3% |
78 Properties |
| 2008 | £393,301 | -7% |
62 Properties |
| 2007 | £419,855 | 14% |
200 Properties |
| 2006 | £362,028 | 13% |
226 Properties |
| 2005 | £313,654 | 1% |
169 Properties |
| 2004 | £311,891 | 5% |
100 Properties |
| 2003 | £296,371 | 21% |
91 Properties |
| 2002 | £233,410 | -11% |
145 Properties |
| 2001 | £259,133 | 18% |
140 Properties |
| 2000 | £213,099 | 16% |
93 Properties |
| 1999 | £179,692 | 16% |
119 Properties |
| 1998 | £151,377 | 16% |
107 Properties |
| 1997 | £126,587 | 12% |
135 Properties |
| 1996 | £111,047 | -8% |
116 Properties |
| 1995 | £120,354 | - |
81 Properties |
Property Price per Property Type in De Beauvoir
Here you can find historic sold price data in order to help with your property search.
The average Property Paid Price for specific property types in the last three years are:
| Property Type | Average Sold Price | Sold Properties |
|---|---|---|
| Flat | £567,696.00 | 175 Flats |
| Semi Detached House | £2,171,221.00 | 20 Semi Detached Houses |
| Terraced House | £1,556,094.00 | 49 Terraced Houses |
| Detached House | £3,337,500.00 | 2 Detached Houses |

