
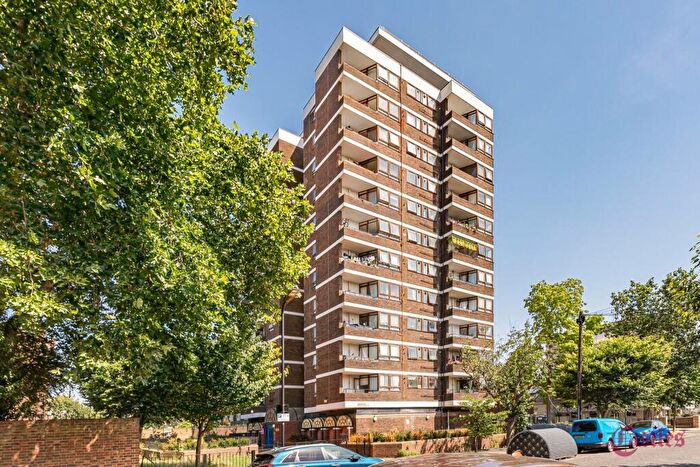
Houses for sale in London, Hackney London Borough
House Prices in London, Hackney London Borough
Properties in this part of London within the Hackney London Borough have an average house price of £697k and had 6,747 Property Transactions within the last 3 years.¹ This area has 107,488 households² , where the most expensive property was sold for £5.6M.
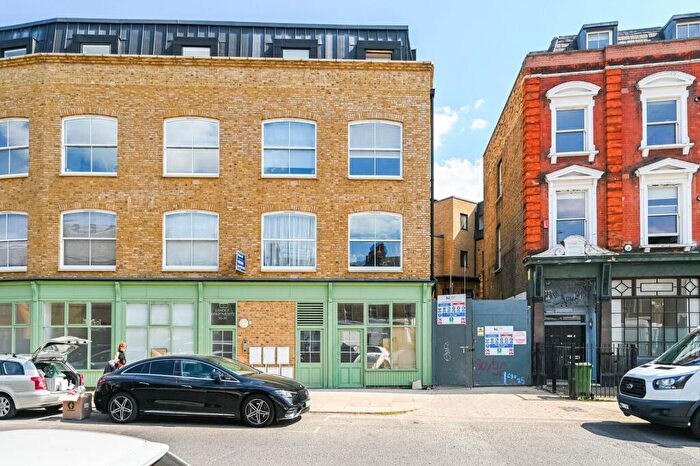
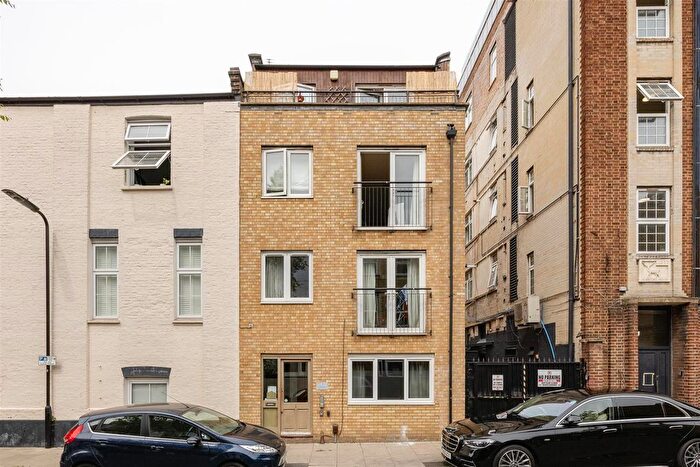
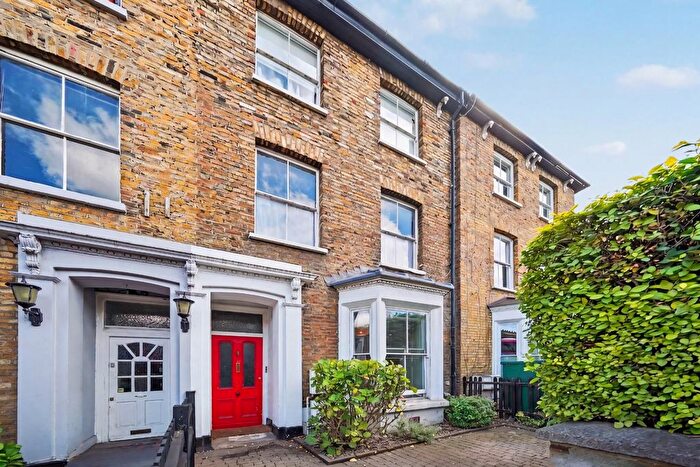
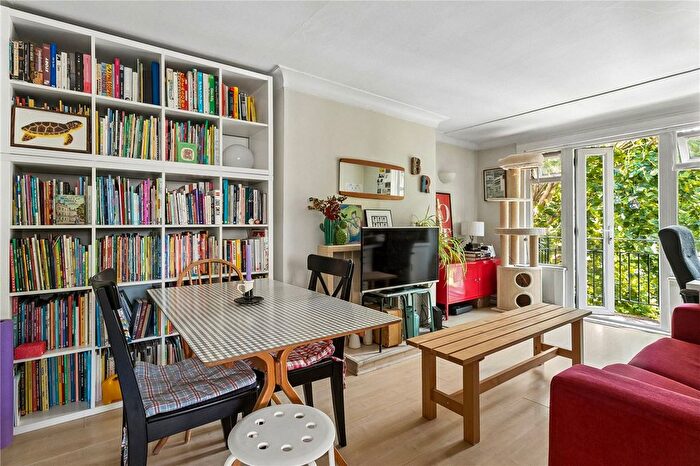
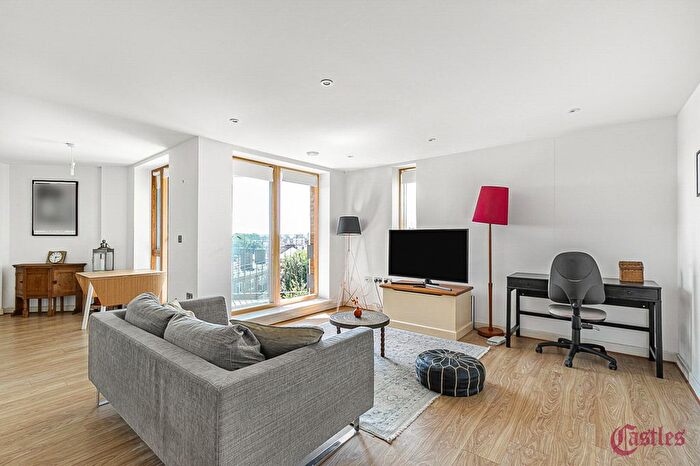
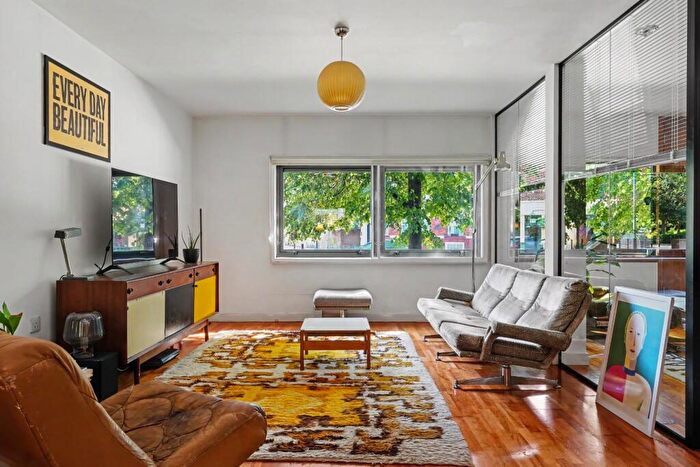
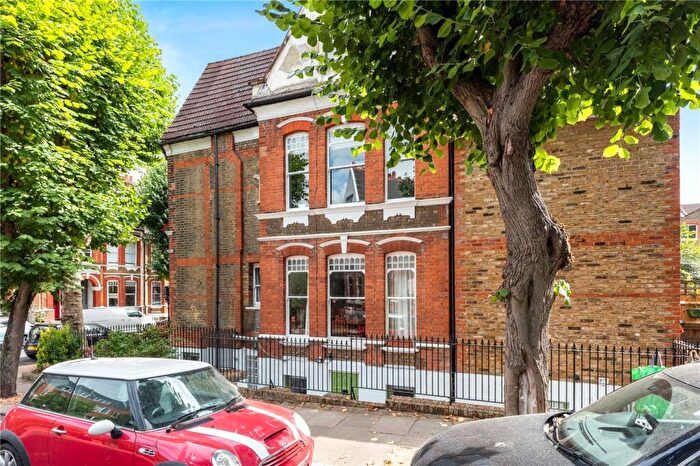
Properties for sale in London, Hackney London Borough
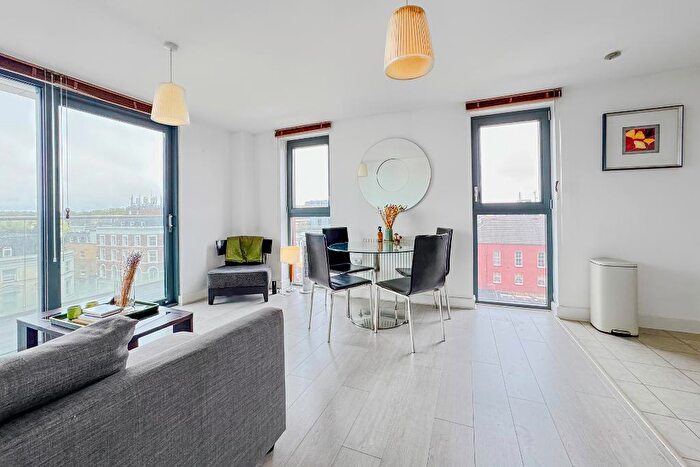
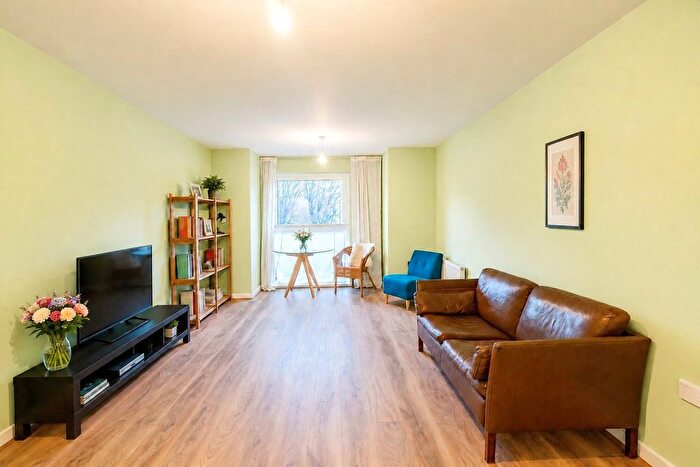
![]()
If you are looking to sell your house, let it out, or receive a property valuation, an expert can help you.
Click the button below to get started.
Neighbourhoods in London, Hackney London Borough
Navigate through our locations to find the location of your next house in London, Hackney London Borough for sale or to rent.
- St Mary's
- St Peter's
- Brownswood
- Cazenove
- Clissold
- Dalston
- De Beauvoir
- Hackney Central
- Hackney Downs
- Hackney Wick
- Haggerston
- Homerton
- Hoxton East And Shoreditch
- Hoxton West
- Kings Park
- Lea Bridge
- London Fields
- Shacklewell
- Springfield
- Stamford Hill West
- Stoke Newington
- Victoria
- Woodberry Down
- Hoxton East & Shoreditch
Property price trends in London, Hackney London Borough
According to the latest Land Registry data, the average home in London, Hackney London Borough sold for £634,440 in 2026. That figure comes from a substantial record of 83,725 sales logged over the past 31 years.
Prices have fallen back over the last three years. Compared with 2023, when the typical sale came in around £701,196, that's a fall of roughly 9.5%.
Looking back five years, average prices are down about 4.6% since 2021, a drop of around £30,633 in cash terms.
Zoom out to the past decade for the fuller picture. Back in 2016, homes here averaged £604,021, so the typical sold price has climbed about 5% since then, roughly 0.5% a year. Stretch the view to fifteen years and that annual pace edges up closer to 3.9%.
Frequently asked questions about London, Hackney London Borough
What is the average price for a property for sale in London, Hackney London Borough?
The average price for a property for sale in London, Hackney London Borough is £696,743. This amount is 0.13% lower than the average price in Hackney London Borough. There are more than 10,000 property listings for sale in London, Hackney London Borough.
What locations have the most expensive properties for sale in London, Hackney London Borough?
The locations with the most expensive properties for sale in London, Hackney London Borough are Hoxton East & Shoreditch at an average of £988,861, De Beauvoir at an average of £937,472 and Stoke Newington at an average of £846,532.
What locations have the most affordable properties for sale in London, Hackney London Borough?
The locations with the most affordable properties for sale in London, Hackney London Borough are Homerton at an average of £503,381, Woodberry Down at an average of £561,466 and Haggerston at an average of £563,861.
Which train stations are available in or near London, Hackney London Borough?
Some of the train stations available in or near London, Hackney London Borough are Dalston (Kingsland), Dalston Junction and Hackney Downs.
Property Price Paid in London, Hackney London Borough by Year
The average sold property price by year was:
| Year | Average Sold Price | Price Change |
Sold Properties
|
|---|---|---|---|
| 2026 | £634,440 | -9% |
136 Properties |
| 2025 | £689,147 | -2% |
2,073 Properties |
| 2024 | £702,840 | 0,2% |
2,443 Properties |
| 2023 | £701,196 | -2% |
2,095 Properties |
| 2022 | £712,585 | 7% |
2,582 Properties |
| 2021 | £665,073 | -6% |
3,106 Properties |
| 2020 | £705,011 | 3% |
2,034 Properties |
| 2019 | £686,176 | 11% |
2,824 Properties |
| 2018 | £613,058 | 3% |
2,406 Properties |
| 2017 | £595,533 | -1% |
2,764 Properties |
Property Price per Property Type in London, Hackney London Borough
Here you can find historic sold price data in order to help with your property search.
The average Property Paid Price for specific property types in the last three years are:
| Property Type | Average Sold Price | Sold Properties |
|---|---|---|
| Semi Detached House | £1,581,117.00 | 122 Semi Detached Houses |
| Terraced House | £1,164,040.00 | 1,300 Terraced Houses |
| Detached House | £1,868,452.00 | 21 Detached Houses |
| Flat | £557,229.00 | 5,304 Flats |
Transport in London, Hackney London Borough
Please see below transportation links in this area:

