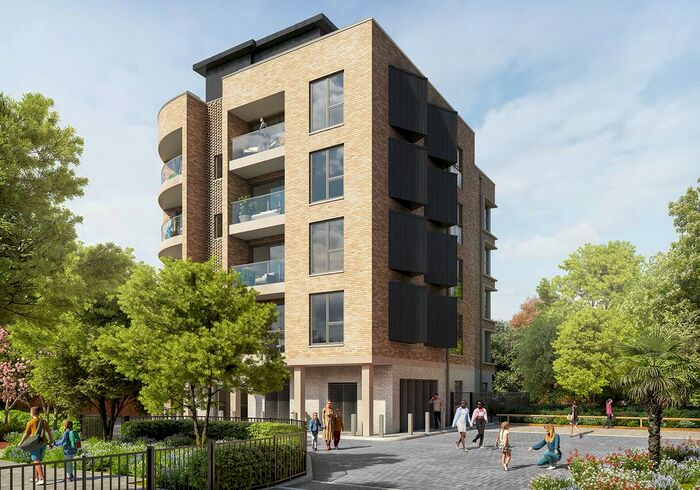
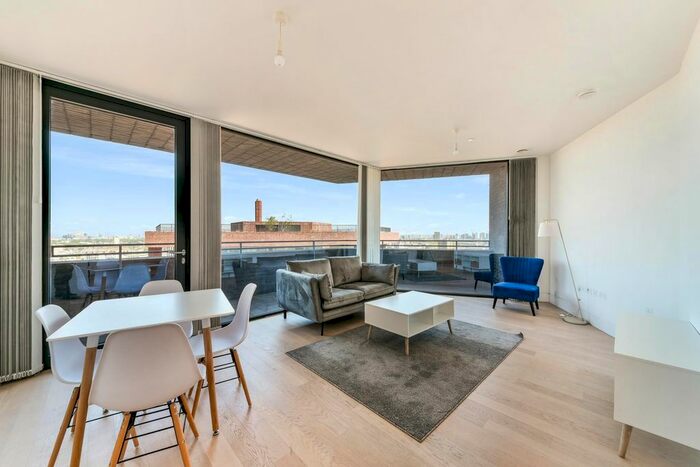
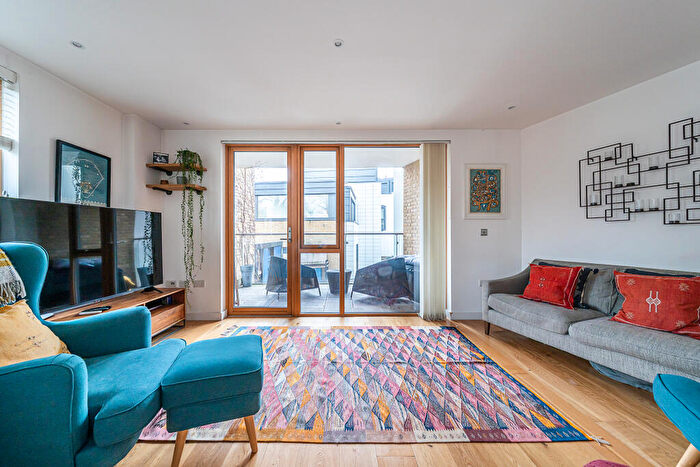
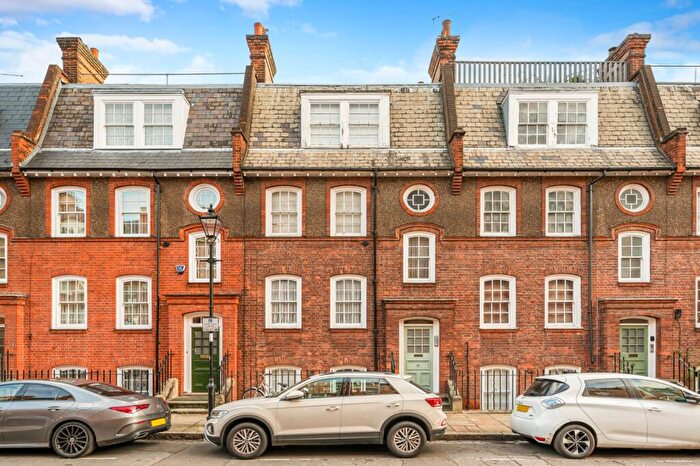
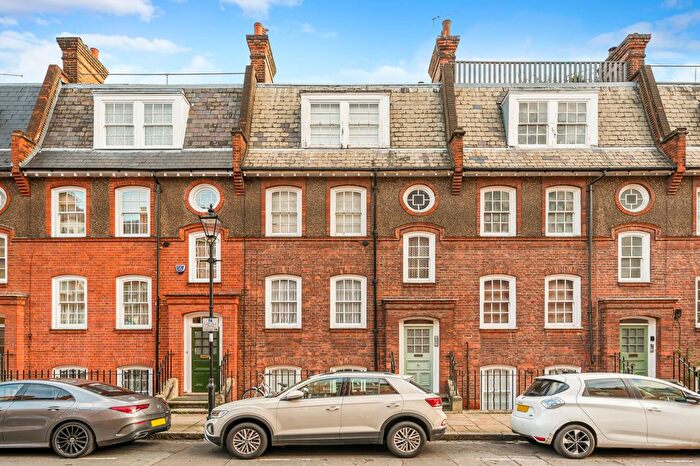
Houses for sale & to rent in Canonbury, London
House Prices in Canonbury
Properties in this part of Canonbury within London have an average house price of £901,252.00 and had 471 Property Transactions within the last 3 years¹. This area has 5,687 households² , where the most expensive property was sold for £6,400,000.00.
Properties for sale in Canonbury
Roads and Postcodes in Canonbury
Navigate through our locations to find the location of your next house in Canonbury, London for sale or to rent.
| Streets | Postcodes |
|---|---|
| Abbotts Close | N1 2HJ |
| Almorah Road | N1 3EN N1 3ER N1 3EU N1 3HW |
| Alwyne Place | N1 2NL |
| Alwyne Road | N1 2HH N1 2HN N1 2HW |
| Alwyne Square | N1 2JX N1 2JY |
| Alwyne Villas | N1 2HQ |
| Arran Walk | N1 2QB N1 2TL |
| Ashby Grove | N1 2GA N1 2AY N1 2AZ |
| Balls Pond Road | N1 4BE |
| Bardsey Walk | N1 2RW |
| Baxter Road | N1 3HS N1 3FT |
| Bute Walk | N1 2QX |
| Caldy Walk | N1 2FX N1 2QR |
| Callaby Terrace | N1 3QB |
| Canonbury Crescent | N1 2FB N1 2FD N1 2FE N1 2FF |
| Canonbury Grove | N1 2HP N1 2HR |
| Canonbury Park North | N1 2JT N1 2JU N1 2JZ |
| Canonbury Park South | N1 2FN N1 2JG N1 2JH N1 2JJ N1 2JL N1 2JN N1 2JQ N1 2JR N1 2JS N1 2JP N1 2JW |
| Canonbury Place | N1 2NN N1 2NQ N1 2NS N1 2NY |
| Canonbury Road | N1 2HS N1 2HT |
| Canonbury Street | N1 2TA N1 2TD N1 2US N1 2UY N1 2TB |
| Cardigan Walk | N1 2PE |
| Channel Islands Estate | N1 2PR N1 2TN |
| Church Road | N1 2FA N1 2BF N1 2EG N1 2EX |
| Clare Lane | N1 3DB |
| Clephane Road | N1 2FT N1 2TJ N1 2FZ N1 2QA N1 2TE N1 2TQ N1 2TT N1 2UB |
| Cleveland Road | N1 3ES N1 3ET |
| Clifton Road | N1 2JF N1 2TR |
| Compton Road | N1 2PA |
| Crowland Terrace | N1 3LP |
| Crowline Walk | N1 2RH |
| Douglas Road | N1 2LD |
| Dove Road | N1 3PL N1 3FS N1 3GB N1 3GD N1 3GE N1 3LU N1 3LZ N1 3NA |
| Dovercourt Estate | N1 3HN |
| Downham Road | N1 3GZ N1 3HG N1 3HH N1 3HJ N1 3HL N1 3HQ |
| Ecclesbourne Road | N1 3AE N1 3AF N1 3GG N1 3BF |
| Elizabeth Avenue | N1 3BH N1 3BJ N1 3BL N1 3BQ N1 3BW |
| Elmore Street | N1 3AH N1 3AJ N1 3AL N1 3AW N1 3FN N1 3AQ |
| Englefield Road | N1 3LG N1 3LH N1 3LJ N1 3LQ |
| Essex Road | N1 2EB N1 2EE N1 2YG N1 3AR N1 3AT N1 3GH N1 3PB N1 3PD N1 3PF N1 3PH N1 3PJ N1 3PP N1 3PR N1 3PT N1 2BD N1 3AU N1 3AX N1 3QP |
| Grange Grove | N1 2LU N1 2LX N1 2NP N1 2NW |
| Greenhills Terrace | N1 3QD |
| Gulland Walk | N1 2RL |
| Halliford Street | N1 3EJ N1 3EL N1 3EQ N1 3HB N1 3HD N1 3HE N1 3FP N1 3FX N1 3HF |
| Handa Walk | N1 2RF |
| Henshall Street | N1 3LX N1 3GA |
| Hopping Lane | N1 2NU |
| Hullbridge Mews | N1 3QU |
| Irving Mews | N1 2FP |
| Islay Walk | N1 2QL |
| John Spencer Square | N1 2LZ |
| Kelvedon Mews | N1 3FW |
| Lindsey Mews | N1 3EG |
| Lismore Walk | N1 2XY |
| Lundy Walk | N1 2QU |
| Marquess Road | N1 2PX N1 2PY N1 2PT |
| Mitchison Road | N1 3NG N1 3NH N1 3NJ N1 3FU |
| Morton Road | N1 3BB N1 3BD N1 3BE N1 3BG N1 3GF |
| Mull Walk | N1 2RN |
| Nightingale Road | N1 2PS N1 2TW N1 2DR N1 2GB |
| Northampton Street | N1 2HU N1 2HX N1 2UX N1 2HY |
| Northchurch Road | N1 3FL N1 3NT N1 3NU N1 3NX N1 3NY N1 3PA |
| Oakley Road | N1 3LL N1 3LN N1 3LR N1 3LS N1 3LW |
| Ockendon Mews | N1 3JL |
| Ockendon Road | N1 3NL N1 3NN N1 3NP N1 3NW |
| Oransay Road | N1 2SB N1 2SG |
| Orchard Close | N1 3AS |
| Park Place | N1 3JU |
| Prior Bolton Street | N1 2NX |
| Ramsey Walk | N1 2NH N1 2NJ N1 2PD N1 2RE N1 2SQ N1 2ND N1 2SX |
| Red House Square | N1 2WB |
| Rona Walk | N1 2NB N1 2RQ |
| Rosemary Street | N1 3DU |
| Rotherfield Street | N1 3BN N1 3BP N1 3BX N1 3BY N1 3DA N1 3DZ N1 3EA |
| Salters Row | N1 3QG |
| Scarba Walk | N1 2QZ |
| Shepperton Road | N1 3DT |
| Sherborne Street | N1 3EY N1 3FJ |
| Shuna Walk | N1 2RB |
| Southgate Road | N1 3JP N1 3JR N1 3JS N1 3JY N1 3JZ N1 3LD N1 3LE N1 3LF N1 3LT N1 3GY |
| St Marys Grove | N1 2NT |
| St Pauls Road | N1 2LT N1 2TH N1 2SY N1 2LY N1 2QH |
| Taransay Walk | N1 2RA |
| The Croft | N1 3NB |
| Thorndike Road | N1 2LG N1 2LN N1 2LS |
| Tilney Gardens | N1 3QE N1 3QF |
| Upper Bardsey Walk | N1 2RZ |
| Upper Caldy Walk | N1 2QS |
| Upper Gulland Walk | N1 2PF |
| Upper Handa Walk | N1 2RG |
| Upper Lismore Walk | N1 2XZ |
| Upper Ramsey Walk | N1 2RP |
| Wakeham Street | N1 3HP |
| Wall Street | N1 3ND |
| Walney Walk | N1 2PU |
| Willow Bridge Road | N1 2LA N1 2LB |
| Woodford Mews | N1 3FQ |
| Yeate Street | N1 3EP N1 3EW |
Transport near Canonbury
-
Essex Road Station
-
Canonbury Station
-
Highbury and Islington Station
-
Dalston Junction Station
-
Dalston Kingsland Station
-
Haggerston Station
-
Drayton Park Station
-
Angel Station
-
Hoxton Station
-
Caledonian Road and Barnsbury Station
- FAQ
- Price Paid By Year
- Property Type Price
Frequently asked questions about Canonbury
What is the average price for a property for sale in Canonbury?
The average price for a property for sale in Canonbury is £901,252. This amount is 7% higher than the average price in London. There are 7,186 property listings for sale in Canonbury.
What streets have the most expensive properties for sale in Canonbury?
The streets with the most expensive properties for sale in Canonbury are Alwyne Road at an average of £5,350,000, Canonbury Place at an average of £4,325,000 and Canonbury Park South at an average of £1,840,083.
What streets have the most affordable properties for sale in Canonbury?
The streets with the most affordable properties for sale in Canonbury are Upper Gulland Walk at an average of £349,500, Upper Handa Walk at an average of £350,000 and Sherborne Street at an average of £369,456.
Which train stations are available in or near Canonbury?
Some of the train stations available in or near Canonbury are Essex Road, Canonbury and Highbury and Islington.
Which tube stations are available in or near Canonbury?
Some of the tube stations available in or near Canonbury are Highbury and Islington and Angel.
Property Price Paid in Canonbury by Year
The average sold property price by year was:
| Year | Average Sold Price | Price Change |
Sold Properties
|
|---|---|---|---|
| 2025 | £846,487 | -9% |
89 Properties |
| 2024 | £922,737 | -1% |
131 Properties |
| 2023 | £935,667 | 5% |
103 Properties |
| 2022 | £891,218 | -13% |
148 Properties |
| 2021 | £1,010,628 | 13% |
161 Properties |
| 2020 | £875,671 | 5% |
85 Properties |
| 2019 | £828,041 | 3% |
134 Properties |
| 2018 | £806,158 | -15% |
102 Properties |
| 2017 | £929,820 | 17% |
116 Properties |
| 2016 | £770,744 | -5% |
109 Properties |
| 2015 | £810,553 | 8% |
135 Properties |
| 2014 | £747,128 | 4% |
138 Properties |
| 2013 | £717,506 | 14% |
150 Properties |
| 2012 | £619,320 | 10% |
139 Properties |
| 2011 | £559,054 | 9% |
175 Properties |
| 2010 | £507,052 | 11% |
143 Properties |
| 2009 | £451,193 | -4% |
200 Properties |
| 2008 | £468,736 | -5% |
125 Properties |
| 2007 | £490,231 | 18% |
218 Properties |
| 2006 | £401,378 | 10% |
264 Properties |
| 2005 | £361,175 | -18% |
183 Properties |
| 2004 | £426,760 | 28% |
184 Properties |
| 2003 | £305,269 | 9% |
142 Properties |
| 2002 | £278,058 | 3% |
168 Properties |
| 2001 | £270,863 | 7% |
215 Properties |
| 2000 | £250,912 | 22% |
153 Properties |
| 1999 | £196,355 | 14% |
227 Properties |
| 1998 | £169,553 | 8% |
187 Properties |
| 1997 | £156,649 | -1% |
170 Properties |
| 1996 | £157,560 | - |
149 Properties |
| 1995 | £157,508 | - |
80 Properties |
Property Price per Property Type in Canonbury
Here you can find historic sold price data in order to help with your property search.
The average Property Paid Price for specific property types in the last three years are:
| Property Type | Average Sold Price | Sold Properties |
|---|---|---|
| Flat | £667,245.00 | 391 Flats |
| Semi Detached House | £2,835,946.00 | 22 Semi Detached Houses |
| Terraced House | £1,678,707.00 | 53 Terraced Houses |
| Detached House | £2,447,000.00 | 5 Detached Houses |

