
Houses for sale & to rent in E5 8BB, Upper Clapton Road, Hackney Downs, London
House Prices in E5 8BB, Upper Clapton Road, Hackney Downs
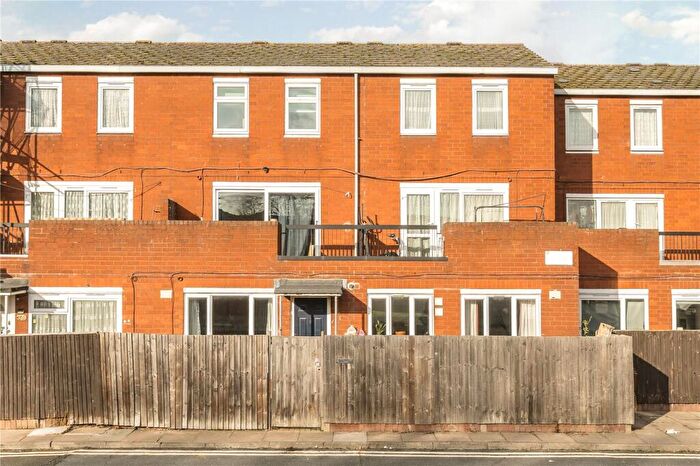
Properties in E5 8BB have an average house price of £430k and had 1 Property Transaction within the last 3 years.¹ E5 8BB is a postcode in Upper Clapton Road located in Hackney Downs, an area in London, Hackney London Borough, with 30 households², where the most expensive property was sold for £430k.
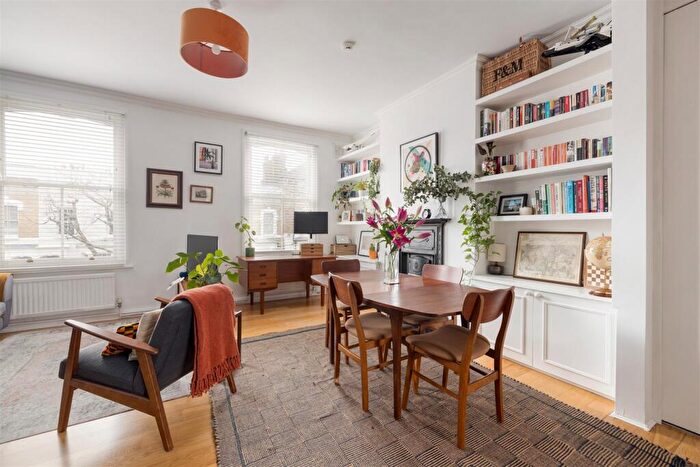
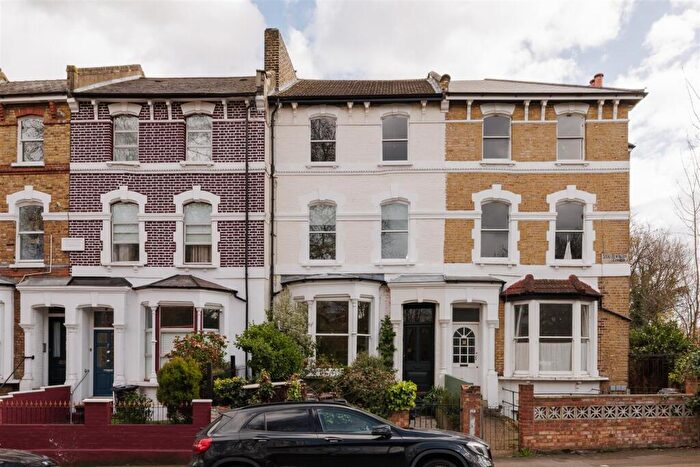
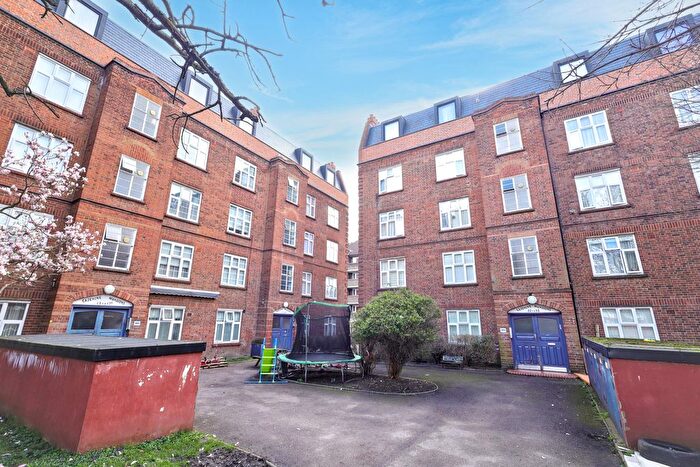
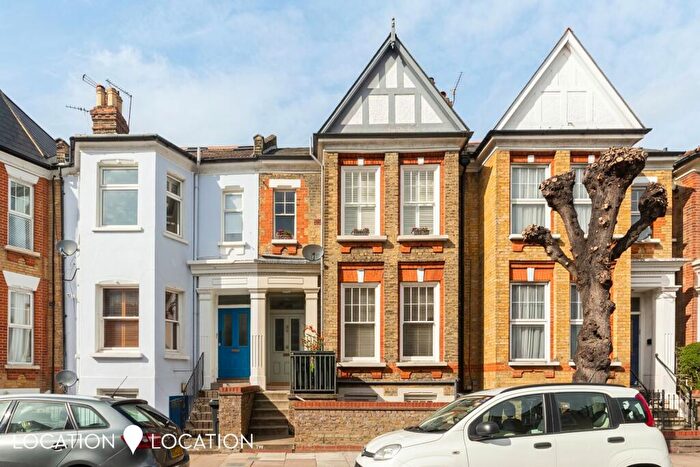
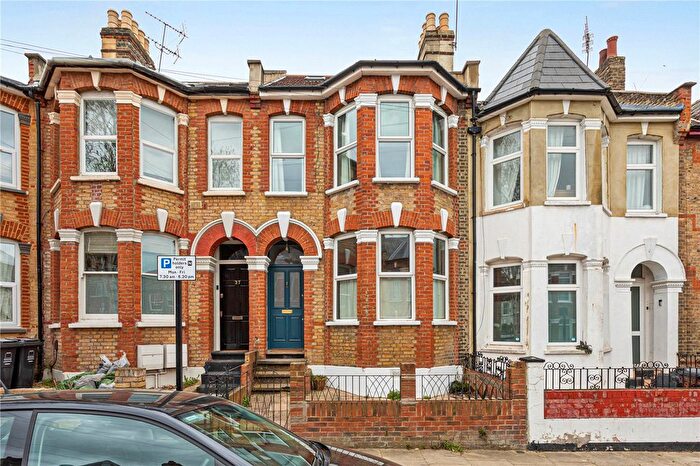
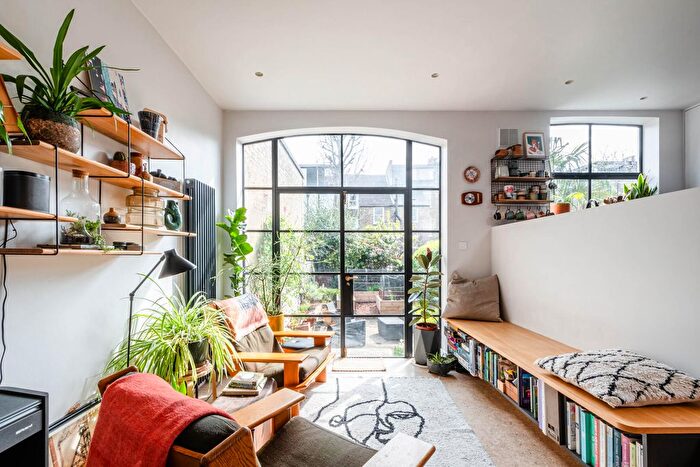
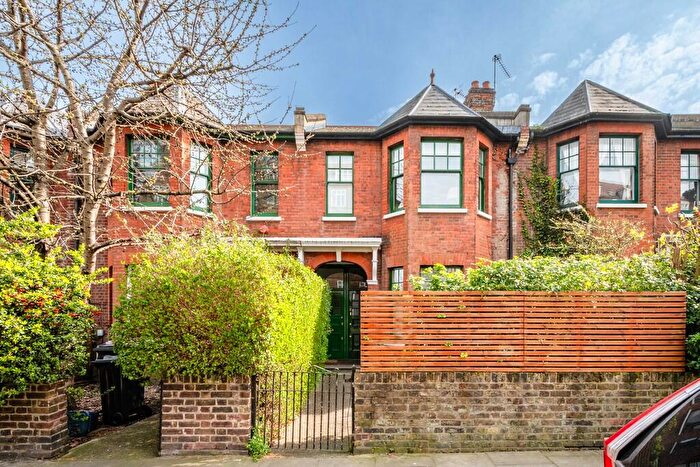
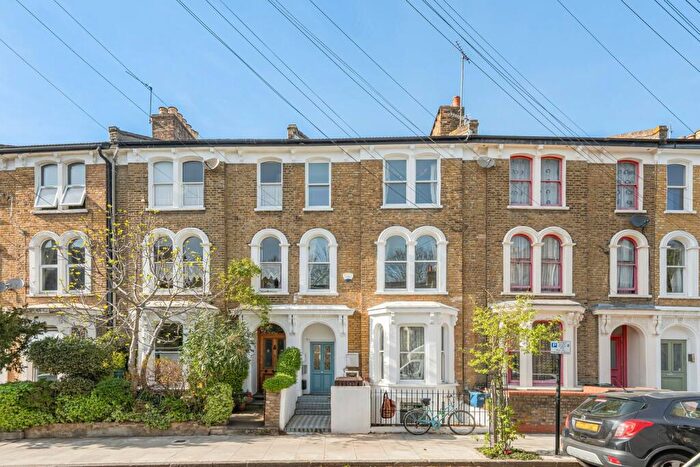
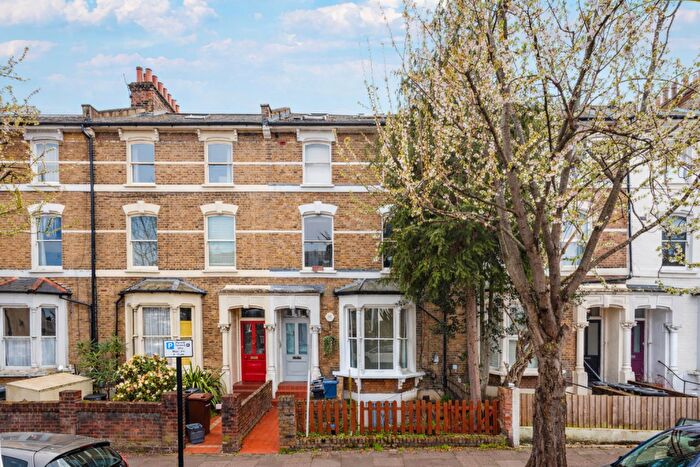
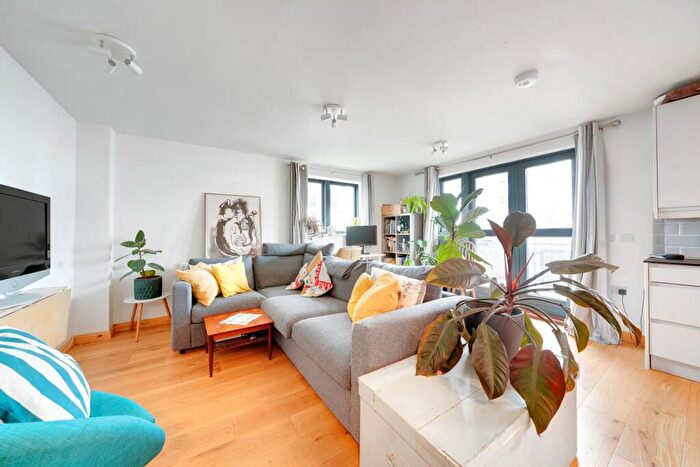
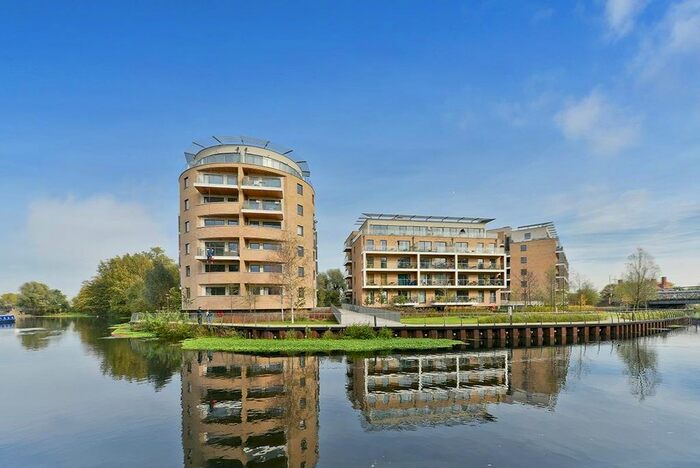
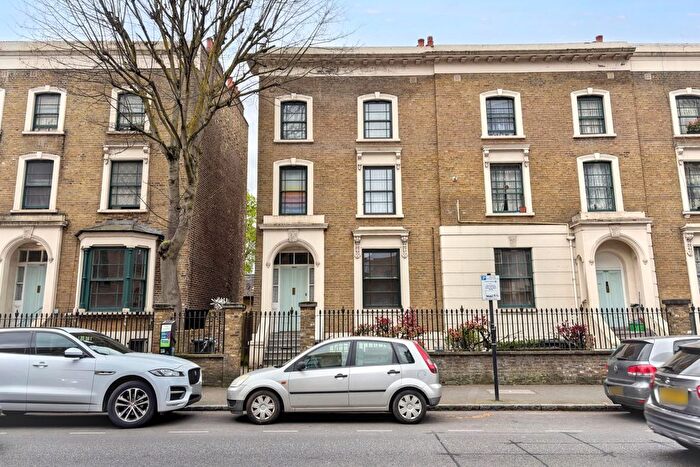
Properties for sale near E5 8BB, Upper Clapton Road
![]()
If you are looking to sell your house, let it out, or receive a property valuation, an expert can help you.
Click the button below to get started.

Price Paid in Upper Clapton Road, E5 8BB, Hackney Downs
HENDALE HOUSE FLAT 8 Upper Clapton Road, E5 8BB, Hackney Downs London
Property HENDALE HOUSE FLAT 8 has been sold 3 times. The last time it was sold was in 30/01/2025 and the sold price was £430,000.00.
This is a Flat which was sold as a leasehold in 30/01/2025
| Date | Price | Property Type | Tenure | Classification |
|---|---|---|---|---|
| 30/01/2025 | £430,000.00 | Flat | leasehold | Established Building |
| 08/10/2021 | £380,000.00 | Flat | leasehold | Established Building |
| 05/10/2015 | £341,500.00 | Flat | leasehold | Established Building |
HENDALE HOUSE FLAT 4 Upper Clapton Road, E5 8BB, Hackney Downs London
Property HENDALE HOUSE FLAT 4 has been sold 1 time. The last time it was sold was in 30/05/2013 and the sold price was £184,000.00.
This is a Flat which was sold as a leasehold in 30/05/2013
| Date | Price | Property Type | Tenure | Classification |
|---|---|---|---|---|
| 30/05/2013 | £184,000.00 | Flat | leasehold | Established Building |
Postcodes in Upper Clapton Road, Hackney Downs
Navigate through other locations in Upper Clapton Road, Hackney Downs, London to see more property listings for sale or to rent.
Transport near E5 8BB, Upper Clapton Road
-

 Clapton Station
 -
Rectory Road Station
-
Stoke Newington Station
-
Hackney Downs Station
-
Lea Bridge Station
-
Hackney Central Station
-
Stamford Hill Station
-
Dalston Kingsland Station
-
Homerton Station
-
Dalston Junction Station
House price paid reports for E5 8BB, Upper Clapton Road
Click on the buttons below to see price paid reports by year or property price:
- Price Paid By Year
- Property Type Price
Property Price Paid in E5 8BB, Upper Clapton Road by Year
The average sold property price by year was:
| Year | Average Sold Price | Price Change |
Sold Properties
|
|---|---|---|---|
| 2025 | £430,000 | 12% |
1 Property |
| 2021 | £380,000 | 10% |
1 Property |
| 2015 | £341,500 | 46% |
1 Property |
| 2013 | £184,000 | - |
1 Property |
Property Price per Property Type in E5 8BB, Upper Clapton Road
Here you can find historic sold price data in order to help with your property search.
The average Property Paid Price for specific property types in the last three years are:
| Property Type | Average Sold Price | Sold Properties |
|---|---|---|
| Flat | £430,000.00 | 1 Flat |