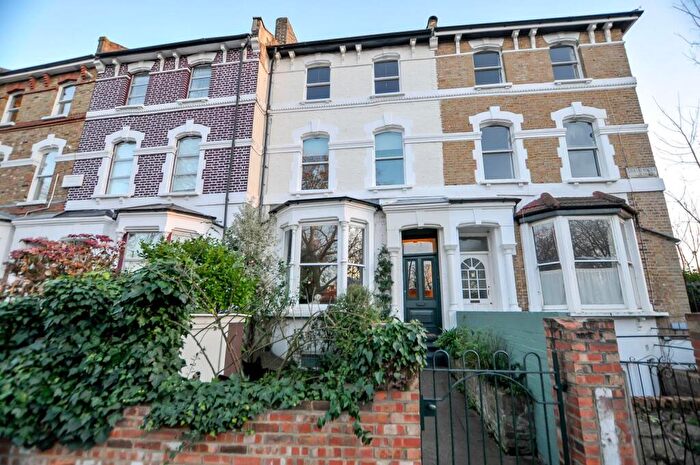
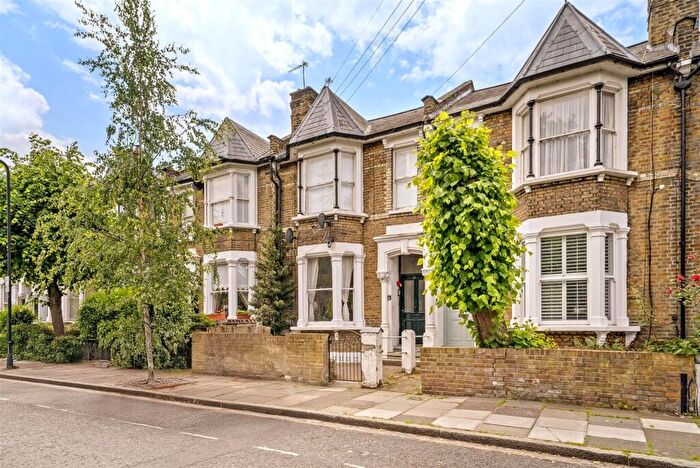
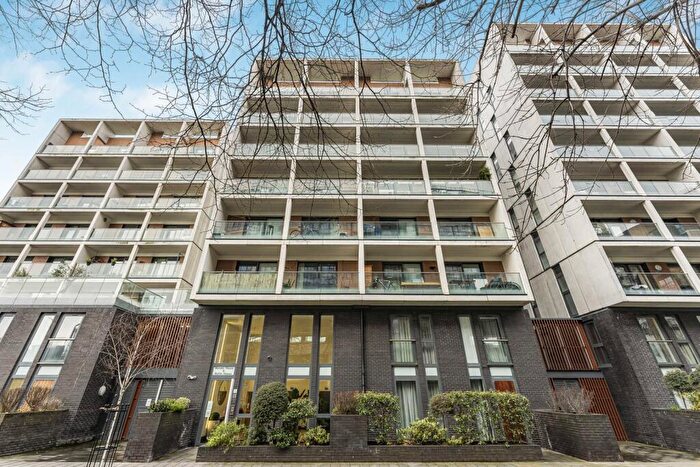
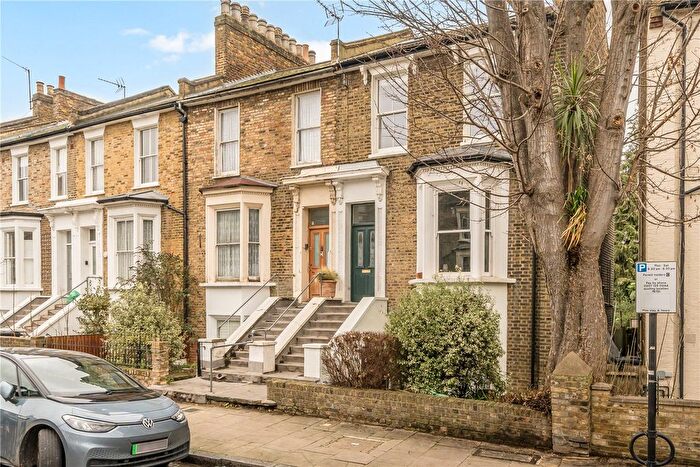
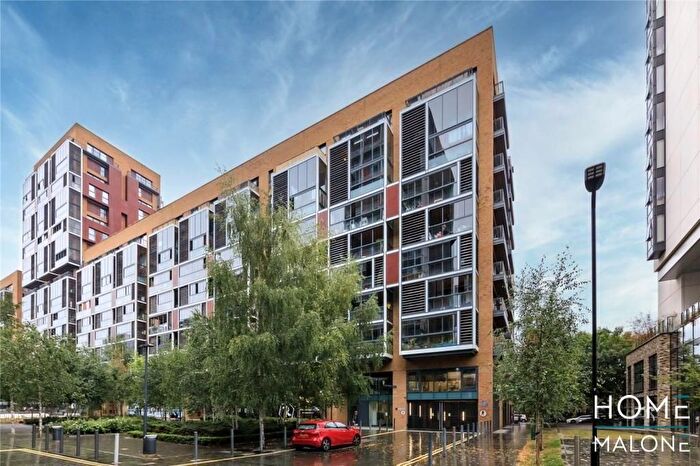
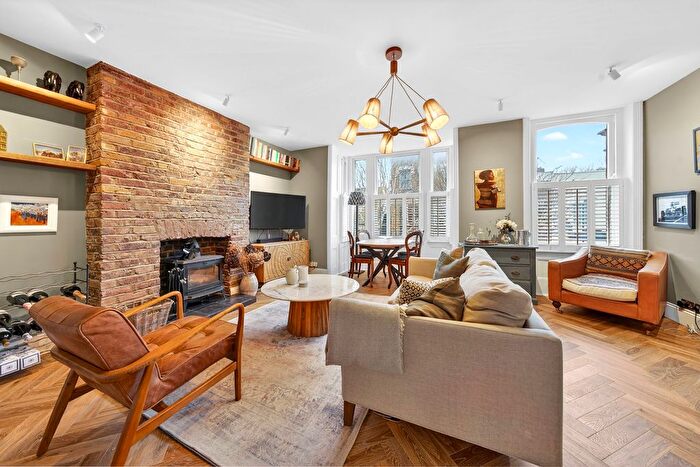
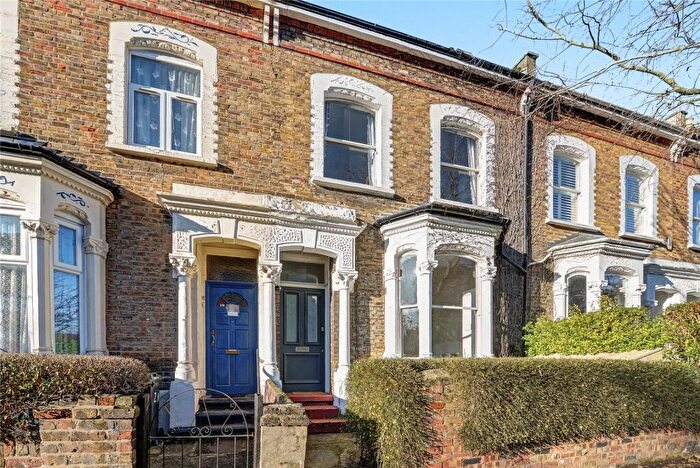
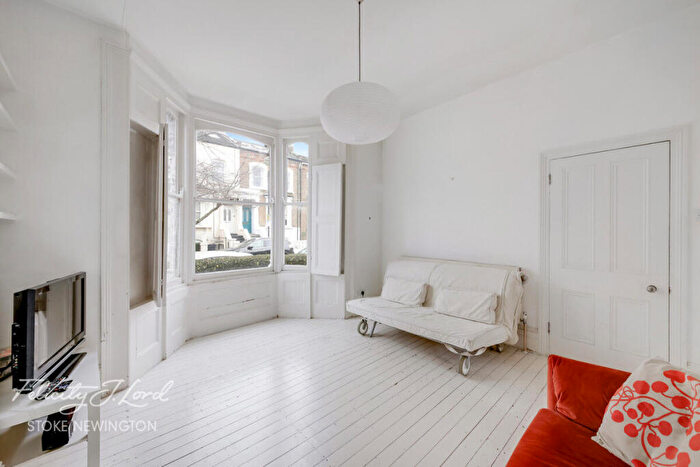
Houses for sale & to rent in Shacklewell, London
House Prices in Shacklewell
Properties in this part of Shacklewell within London have an average house price of £631,690.00 and had 194 Property Transactions within the last 3 years¹. This area has 3,616 households² , where the most expensive property was sold for £1,685,000.00.
Properties for sale in Shacklewell
Roads and Postcodes in Shacklewell
Navigate through our locations to find the location of your next house in Shacklewell, London for sale or to rent.
| Streets | Postcodes |
|---|---|
| Amhurst Road | E8 2AP E8 2AR E8 2AS E8 2AT E8 2AU E8 2BS E8 2RN E8 2RP E8 2RW N16 7UL E8 2BD E8 2BE E8 2BG E8 2BH E8 2BJ E8 2BL E8 2BN E8 2BP E8 2BQ E8 2BW E8 2BX E8 2RH E8 2RJ E8 2RL E8 2JB E8 2JJ |
| Amhurst Terrace | E8 2BT |
| April Street | E8 2EF |
| Arcola Street | E8 2DJ E8 2DU E8 2DX E8 2DY E8 2DZ E8 2DN |
| Barretts Grove | N16 8AJ N16 8AP N16 8AR |
| Belgrade Road | N16 8DH N16 8DJ N16 8DQ N16 8AF |
| Blundell Close | E8 2RS |
| Boleyn Road | N16 8AS N16 8BN |
| Cecilia Road | E8 2ET E8 2EX |
| Charterhouse Road | E8 2RA E8 2RB E8 2RD E8 2RE E8 2RF |
| Chow Square | E8 2DD |
| Courthouse Lane | N16 7YA |
| Cressington Close | N16 8AN |
| Crossway | N16 8HX |
| Downs Park Road | E8 2HY E8 2FP |
| Drysdale Dwellings | E8 2DH |
| Dunn Street | E8 2DB E8 2DG E8 2FF |
| Farleigh Road | N16 7TF N16 7TG |
| Foskett Mews | E8 2BZ |
| Gateway Mews | E8 2DF |
| Hayling Close | N16 8UR |
| Independent Place | E8 2HE |
| King Henrys Yard | N16 8XB |
| Lydford Close | N16 8UT |
| Lyn Mews | N16 8SF |
| Millard Close | N16 8UU |
| Miller's Avenue | E8 2DS |
| Millers Terrace | E8 2DP E8 2DE |
| Palatine Avenue | N16 8XH |
| Palatine Road | N16 8ST N16 8SX N16 8SY N16 8SU |
| Pellerin Road | N16 8AT N16 8AY |
| Perch Street | E8 2EG |
| Prince George Road | N16 8BY N16 8DL |
| Princess May Road | N16 8DF N16 8DG |
| Rectory Road | N16 7QR N16 7QS |
| Rusbridge Close | E8 2RR |
| Salcombe Road | N16 8AU N16 8AX |
| Seal Street | E8 2EE E8 2FB |
| Selsea Place | N16 8HY N16 8BE |
| Shacklewell Lane | E8 2BY E8 2DA E8 2EB E8 2EH E8 2EQ E8 2EY E8 2FG E8 2EJ N16 7RW |
| Shacklewell Road | N16 7RL N16 7TP N16 7TU N16 7TW |
| Shacklewell Row | E8 2EA |
| Somerford Grove | N16 7TX N16 7RZ N16 7TT N16 7TY N16 7UA |
| Somerford Grove Estate | N16 7TJ N16 7TL N16 7TN |
| Stoke Newington Road | N16 7XB N16 7XJ N16 7XN N16 8AD N16 8BH N16 8BJ N16 8BX N16 8AA N16 8AG N16 8AH |
| Tavistock Close | N16 8UZ |
| Templeton Close | N16 8UY |
| Thornbury Close | N16 8UX |
| Trumans Road | N16 8BD |
| Wordsworth Road | N16 8BZ |
Transport near Shacklewell
-
Dalston Kingsland Station
-
Rectory Road Station
-
Dalston Junction Station
-
Hackney Downs Station
-
Hackney Central Station
-
Stoke Newington Station
-
Clapton Station
-
Canonbury Station
-
Haggerston Station
-
London Fields Station
- FAQ
- Price Paid By Year
- Property Type Price
Frequently asked questions about Shacklewell
What is the average price for a property for sale in Shacklewell?
The average price for a property for sale in Shacklewell is £631,690. This amount is 9% lower than the average price in London. There are 5,250 property listings for sale in Shacklewell.
What streets have the most expensive properties for sale in Shacklewell?
The streets with the most expensive properties for sale in Shacklewell are Prince George Road at an average of £1,030,100, Palatine Road at an average of £973,927 and Palatine Avenue at an average of £943,750.
What streets have the most affordable properties for sale in Shacklewell?
The streets with the most affordable properties for sale in Shacklewell are Cressington Close at an average of £330,000, Boleyn Road at an average of £350,000 and Millers Terrace at an average of £415,538.
Which train stations are available in or near Shacklewell?
Some of the train stations available in or near Shacklewell are Dalston Kingsland, Rectory Road and Dalston Junction.
Property Price Paid in Shacklewell by Year
The average sold property price by year was:
| Year | Average Sold Price | Price Change |
Sold Properties
|
|---|---|---|---|
| 2025 | £635,207 | -8% |
62 Properties |
| 2024 | £687,916 | 19% |
72 Properties |
| 2023 | £560,583 | -34% |
60 Properties |
| 2022 | £749,148 | 19% |
78 Properties |
| 2021 | £606,352 | 3% |
79 Properties |
| 2020 | £591,121 | 10% |
49 Properties |
| 2019 | £534,675 | -12% |
54 Properties |
| 2018 | £597,541 | 15% |
91 Properties |
| 2017 | £507,401 | -15% |
75 Properties |
| 2016 | £585,197 | 12% |
90 Properties |
| 2015 | £513,438 | 5% |
78 Properties |
| 2014 | £487,413 | 16% |
72 Properties |
| 2013 | £406,998 | 16% |
96 Properties |
| 2012 | £339,850 | 8% |
76 Properties |
| 2011 | £311,044 | 8% |
66 Properties |
| 2010 | £286,183 | -4% |
83 Properties |
| 2009 | £298,705 | 2% |
34 Properties |
| 2008 | £291,930 | -5% |
53 Properties |
| 2007 | £306,553 | 12% |
113 Properties |
| 2006 | £268,400 | 19% |
122 Properties |
| 2005 | £217,016 | -3% |
69 Properties |
| 2004 | £222,540 | 4% |
80 Properties |
| 2003 | £214,596 | 14% |
76 Properties |
| 2002 | £184,699 | 11% |
99 Properties |
| 2001 | £164,012 | 15% |
120 Properties |
| 2000 | £140,046 | 14% |
102 Properties |
| 1999 | £119,824 | 31% |
105 Properties |
| 1998 | £82,283 | -10% |
88 Properties |
| 1997 | £90,407 | 26% |
106 Properties |
| 1996 | £67,083 | 8% |
80 Properties |
| 1995 | £61,816 | - |
68 Properties |
Property Price per Property Type in Shacklewell
Here you can find historic sold price data in order to help with your property search.
The average Property Paid Price for specific property types in the last three years are:
| Property Type | Average Sold Price | Sold Properties |
|---|---|---|
| Semi Detached House | £1,111,728.00 | 1 Semi Detached House |
| Terraced House | £987,549.00 | 51 Terraced Houses |
| Flat | £500,501.00 | 142 Flats |

