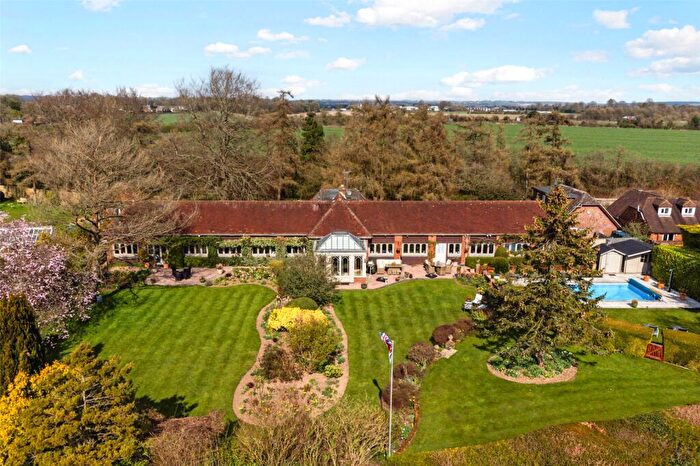
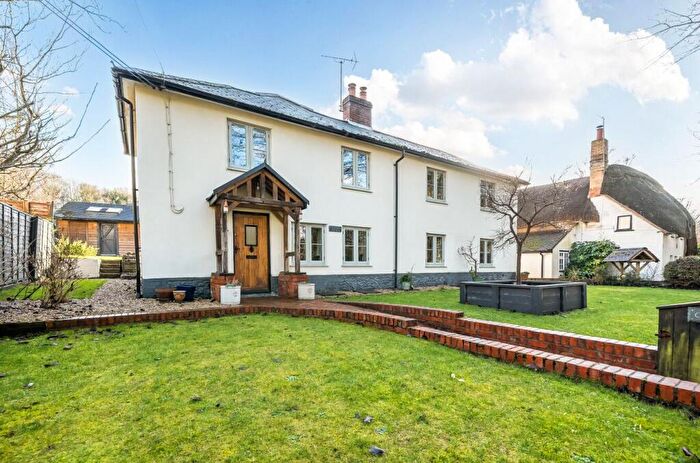
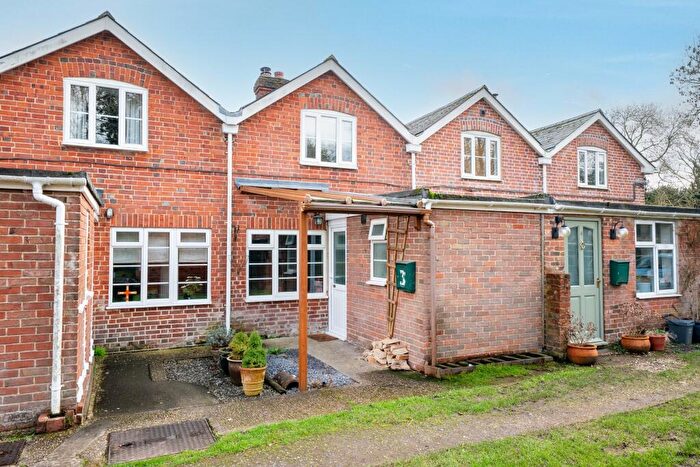
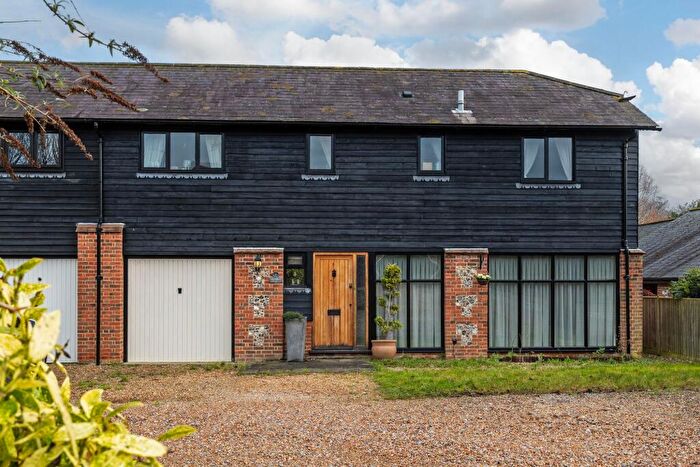
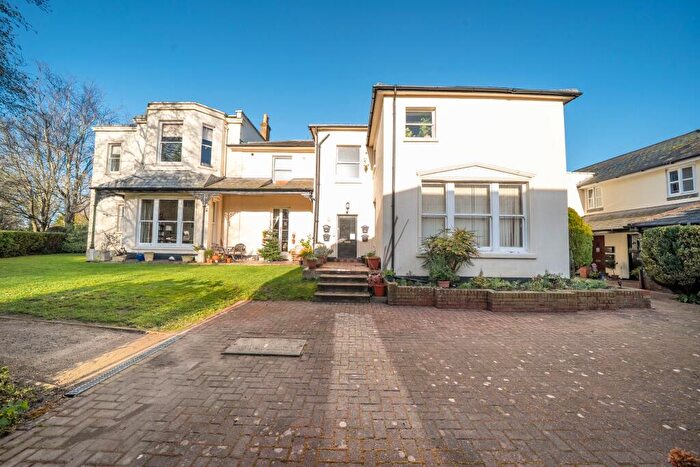
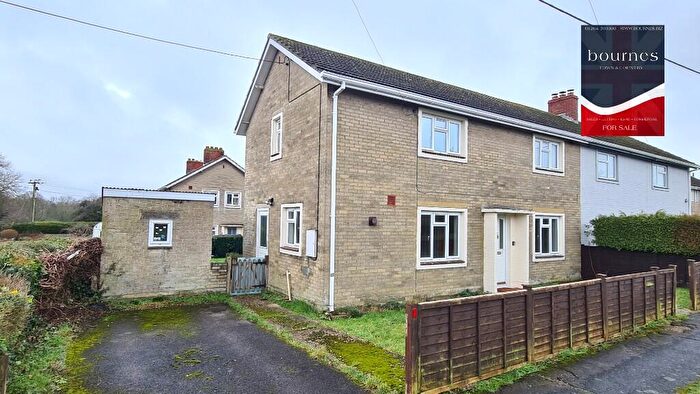
Houses for sale & to rent in Amport, Andover
House Prices in Amport
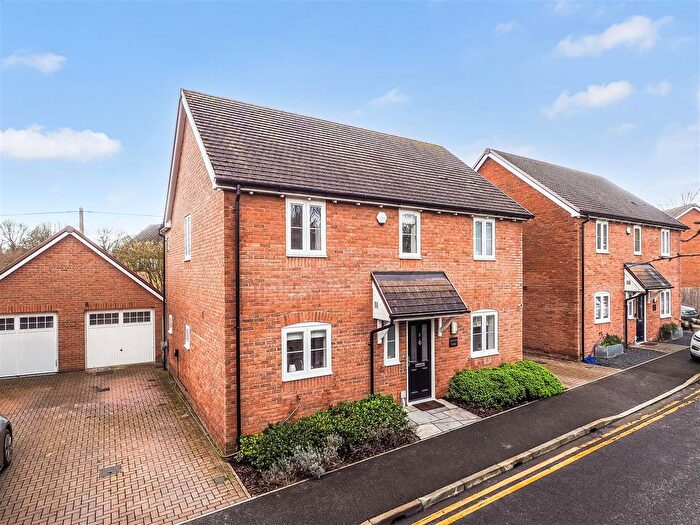
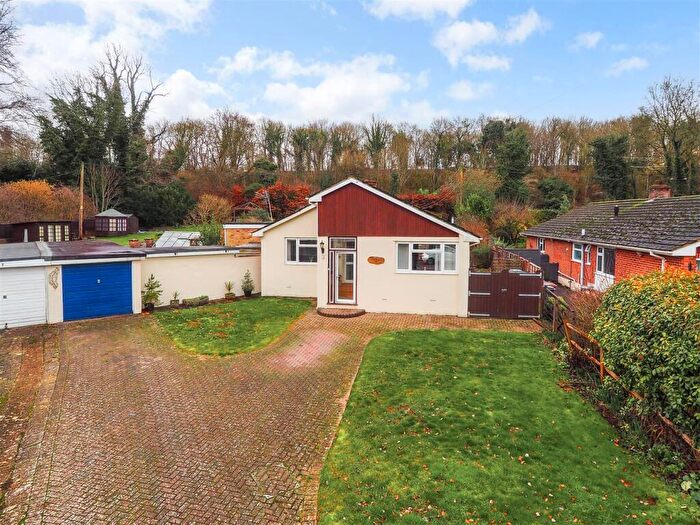
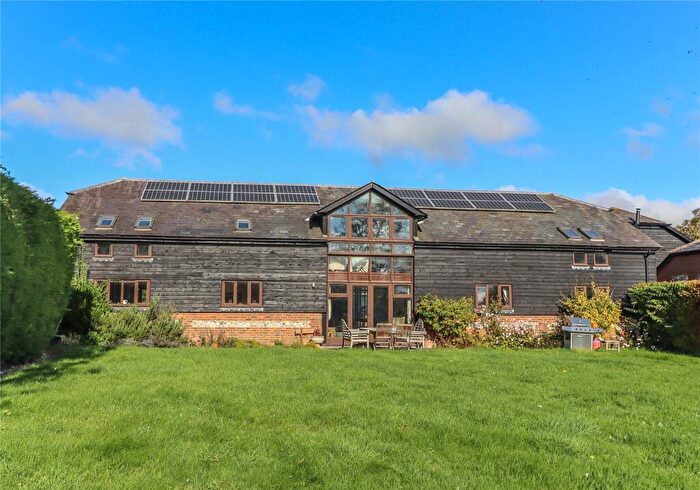
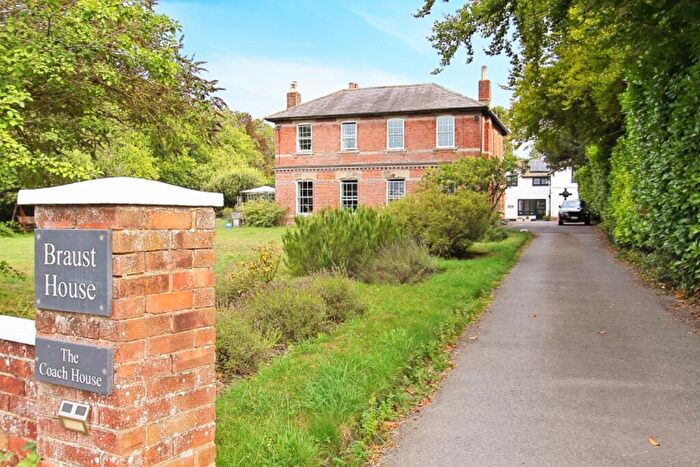
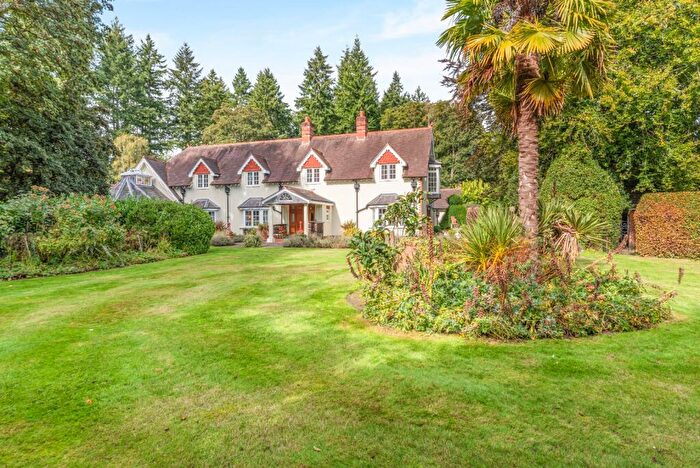
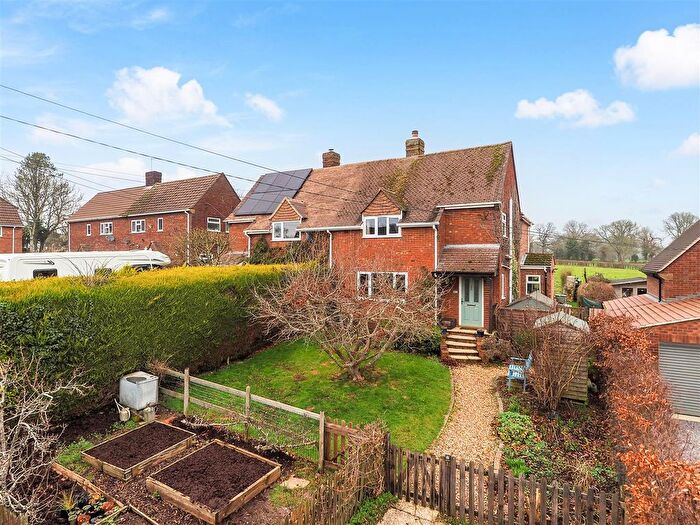
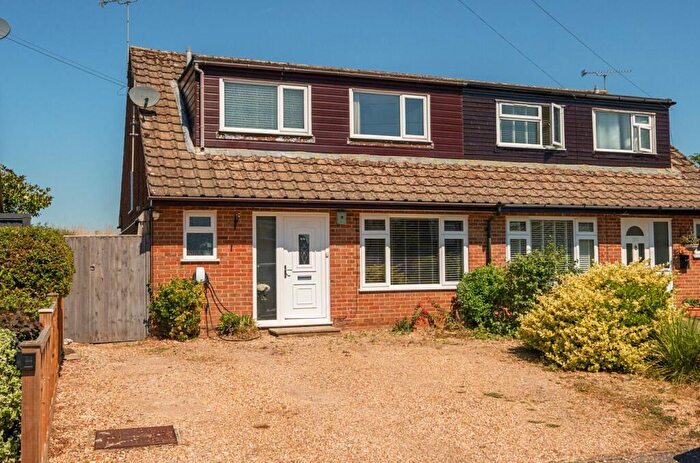
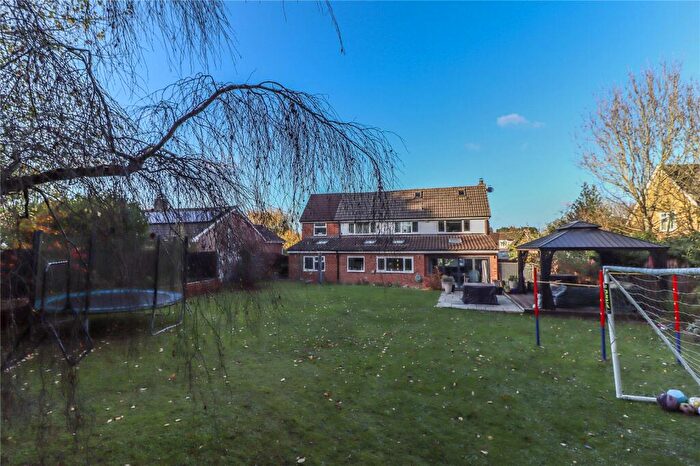
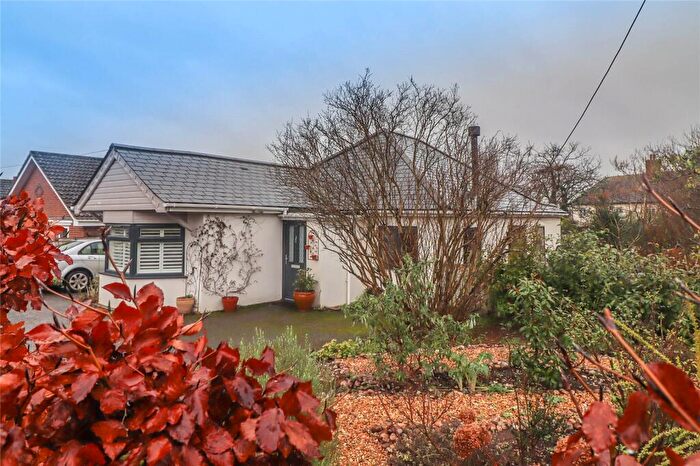
Properties in Amport have an average house price of £624,069.00 and had 65 Property Transactions within the last 3 years¹.
Amport is an area in Andover, Hampshire with 779 households², where the most expensive property was sold for £1,595,000.00.
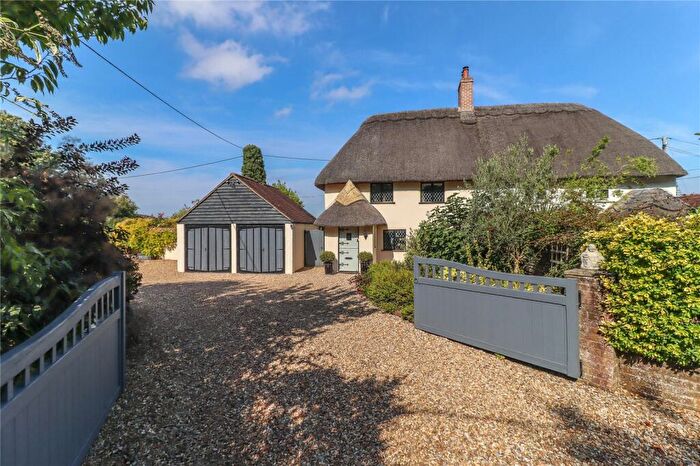
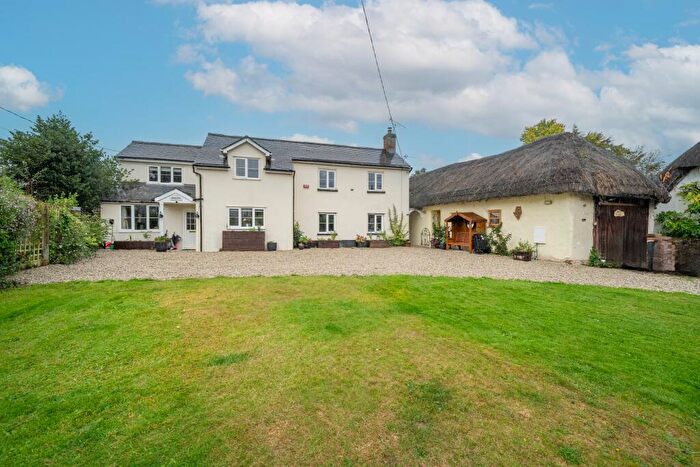
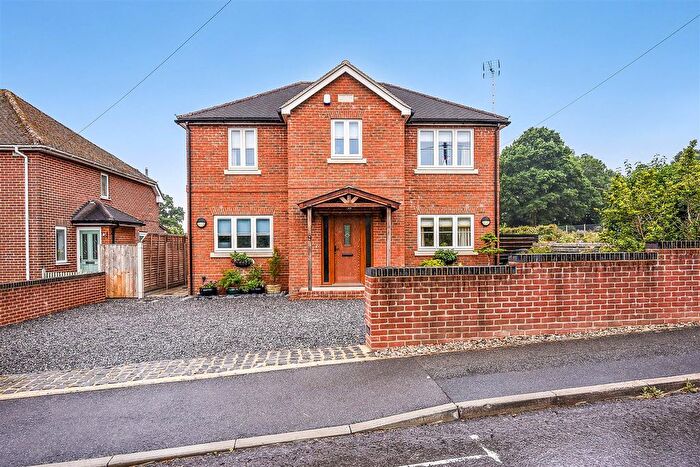
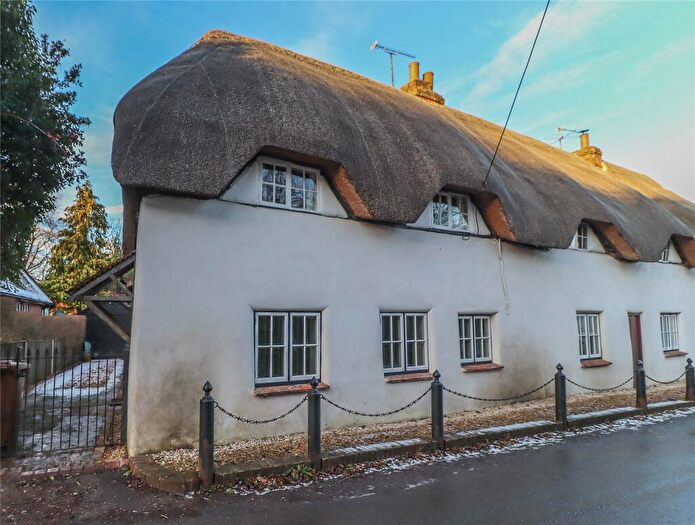
Properties for sale in Amport
Roads and Postcodes in Amport
Navigate through our locations to find the location of your next house in Amport, Andover for sale or to rent.
| Streets | Postcodes |
|---|---|
| Amesbury Road | SP11 8DU SP11 8EA |
| Amport Park Mews | SP11 8BS |
| Brewery Cottages | SP11 8DH |
| Broad Road | SP11 8AT |
| Campbell Close | SP11 7DY |
| Chalkpit Lane | SP11 8AR SP11 8AS |
| Chapel Lane | SP11 8JP |
| Cholderton Road | SP11 8LH SP11 8LQ |
| Christopher Court | SP11 8QE |
| Church Lane | SP11 8JS |
| Dauntsey Bridge | SP11 8EG |
| Elm Cottages | SP11 8JN |
| Etwall | SP11 8QA |
| Fairways | SP11 8DW |
| Fox Corner | SP11 8QP |
| Furzedown Lane | SP11 8BW |
| Fyfield Road | SP11 8DF SP11 8DJ |
| Gunville | SP11 8JQ |
| Hawthorne Close | SP11 8JL |
| Haydown Cottages | SP11 8LT |
| High Street | SP11 8AW SP11 8JT |
| Lawrence Houses | SP11 8JX |
| Locke Close | SP11 7EA |
| Manor Farm Cottages | SP11 8AJ SP11 8JZ |
| Michaelmas Drove | SP11 8DR |
| Middlecot | SP11 8PS |
| Monxton Road | SP11 8BY SP11 8JH |
| Mount Pleasant | SP11 8AG |
| Mullens Pond | SP11 8EE |
| Old Home Farm Barns | SP11 8QX |
| Old Stockbridge Road | SP11 7EF |
| Ordnance Lane | SP11 8TB |
| Park Lane | SP11 8QB |
| Pond Lane | SP11 8TA |
| Red Post Lane | SP11 8DB |
| Sarson | SP11 8AE |
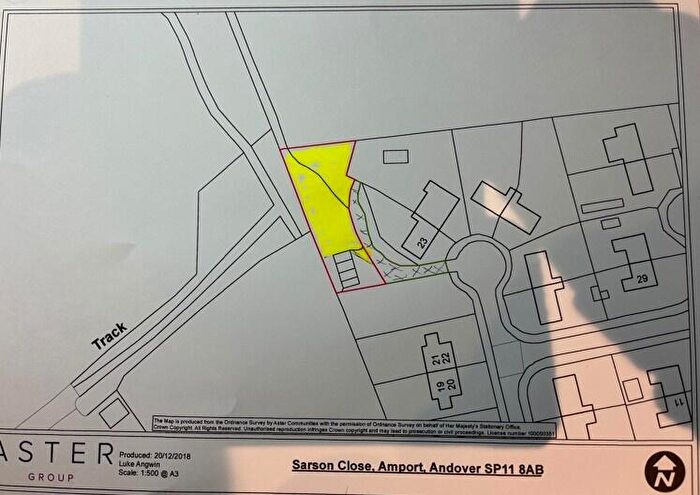
| Sarson Close | SP11 8AB |
| Sarson Lane | SP11 8AA SP11 8DY SP11 8HX |
| South View | SP11 8PY |
| Station Approach | SP11 7DX |
| Station Road | SP11 8LB SP11 8LG |
| Sunnybank | SP11 8BZ |
| The Dell | SP11 8JJ |
| The Eights | SP11 8AD |
| The Green | SP11 8BA |
| Wallop Road | SP11 7EB |
| West End Cottages | SP11 8JY |
| Weyhill | SP11 8DP SP11 8DT |
| White Houses | SP11 0QQ |
| Woodside Cottages | SP11 8BB |
| Yew Tree Cottages | SP11 8DZ |
| SP11 8AF SP11 8AH SP11 8AL SP11 8AN SP11 8AP SP11 8AQ SP11 8AX SP11 8AY SP11 8BE SP11 8BL SP11 8BN SP11 8BQ SP11 8HZ SP11 8JA SP11 8JB SP11 8JE SP11 8JR SP11 8LE SP11 8LL SP11 8LR SP11 8LX SP11 8NJ SP11 8PT SP11 8PX SP11 8PZ |
Transport near Amport
-
Grateley Station
-
Andover Station
-
Dean Station
-
Whitchurch (Hampshire) Station
-
Mottisfont and Dunbridge Station
-
Bedwyn Station
-
Salisbury Station
-
Pewsey Station
-
Micheldever Station
-
Winchester Station
- FAQ
- Price Paid By Year
- Property Type Price
Frequently asked questions about Amport
What is the average price for a property for sale in Amport?
The average price for a property for sale in Amport is £624,069. This amount is 73% higher than the average price in Andover. There are 915 property listings for sale in Amport.
What streets have the most expensive properties for sale in Amport?
The streets with the most expensive properties for sale in Amport are Gunville at an average of £1,275,000, High Street at an average of £721,500 and Wallop Road at an average of £685,000.
What streets have the most affordable properties for sale in Amport?
The streets with the most affordable properties for sale in Amport are Station Approach at an average of £210,000, The Eights at an average of £270,000 and Campbell Close at an average of £328,333.
Which train stations are available in or near Amport?
Some of the train stations available in or near Amport are Grateley, Andover and Dean.
Property Price Paid in Amport by Year
The average sold property price by year was:
| Year | Average Sold Price | Price Change |
Sold Properties
|
|---|---|---|---|
| 2025 | £556,523 | -15% |
21 Properties |
| 2024 | £642,166 | -4% |
21 Properties |
| 2023 | £669,217 | 1% |
23 Properties |
| 2022 | £659,648 | 0,1% |
31 Properties |
| 2021 | £659,040 | 20% |
40 Properties |
| 2020 | £528,560 | 12% |
25 Properties |
| 2019 | £465,041 | -20% |
24 Properties |
| 2018 | £558,625 | 13% |
20 Properties |
| 2017 | £487,314 | 7% |
22 Properties |
| 2016 | £455,588 | 7% |
34 Properties |
| 2015 | £424,565 | -16% |
33 Properties |
| 2014 | £492,262 | 15% |
30 Properties |
| 2013 | £418,183 | -14% |
27 Properties |
| 2012 | £478,311 | 5% |
13 Properties |
| 2011 | £456,750 | -3% |
26 Properties |
| 2010 | £468,604 | 9% |
23 Properties |
| 2009 | £427,514 | -27% |
23 Properties |
| 2008 | £544,552 | 42% |
17 Properties |
| 2007 | £315,773 | -32% |
41 Properties |
| 2006 | £416,557 | 20% |
34 Properties |
| 2005 | £331,458 | 1% |
36 Properties |
| 2004 | £328,690 | 11% |
36 Properties |
| 2003 | £292,084 | -6% |
25 Properties |
| 2002 | £310,765 | 11% |
39 Properties |
| 2001 | £278,129 | 18% |
44 Properties |
| 2000 | £228,312 | 26% |
39 Properties |
| 1999 | £169,250 | 3% |
33 Properties |
| 1998 | £164,401 | -9% |
39 Properties |
| 1997 | £179,288 | 27% |
25 Properties |
| 1996 | £131,149 | 16% |
26 Properties |
| 1995 | £109,977 | - |
29 Properties |
Property Price per Property Type in Amport
Here you can find historic sold price data in order to help with your property search.
The average Property Paid Price for specific property types in the last three years are:
| Property Type | Average Sold Price | Sold Properties |
|---|---|---|
| Semi Detached House | £430,972.00 | 18 Semi Detached Houses |
| Detached House | £821,242.00 | 35 Detached Houses |
| Terraced House | £348,954.00 | 11 Terraced Houses |
| Flat | £225,000.00 | 1 Flat |

