
Houses for sale in Andover, Hampshire
House Prices in Andover
Properties in Andover have an average house price of £357k and had 2,686 Property Transactions within the last 3 years.¹
Andover is an area in Hampshire with 28,433 households², where the most expensive property was sold for £3.3M.
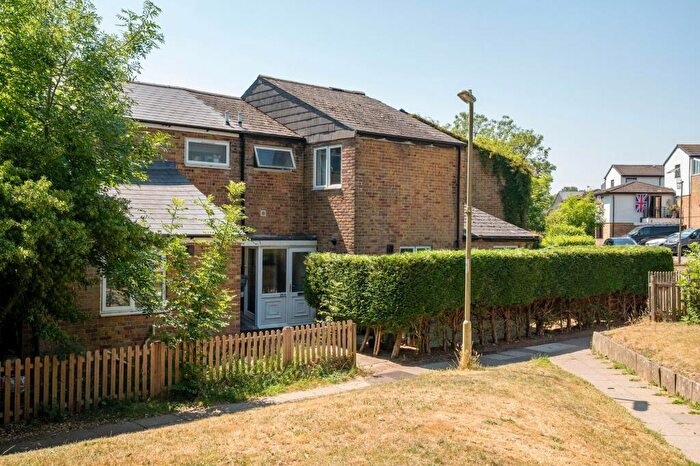
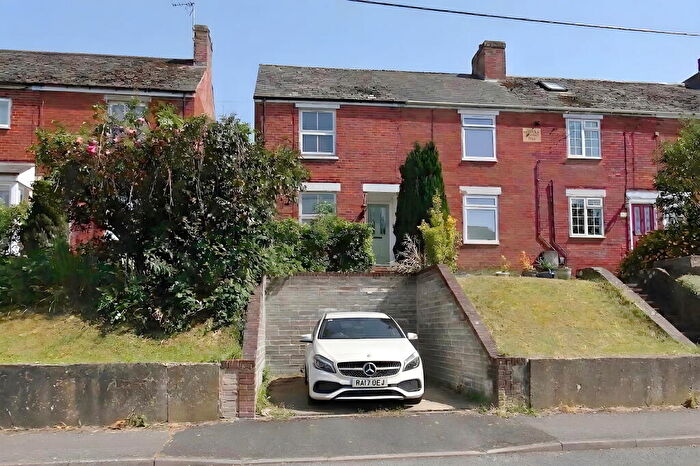
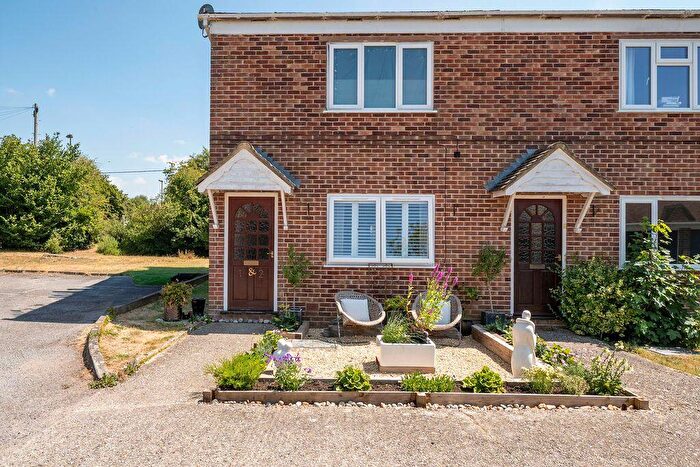
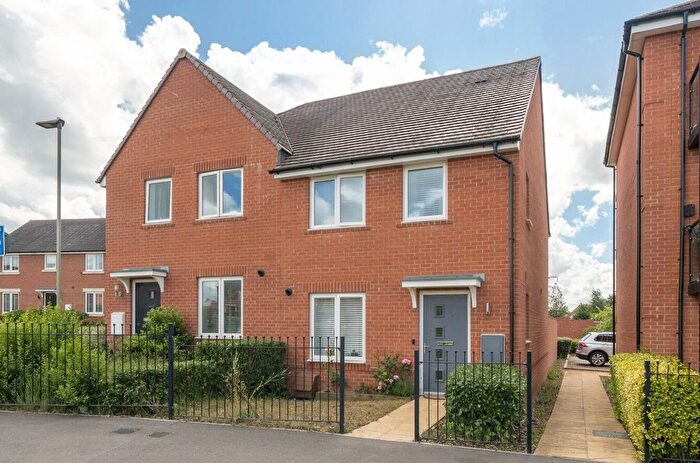
Properties for sale in Andover
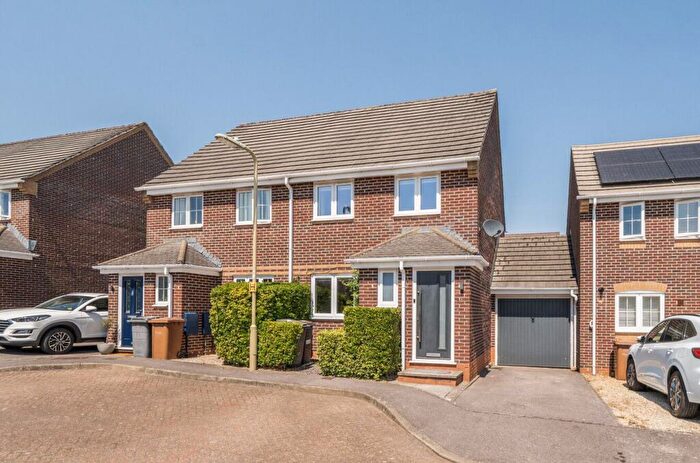

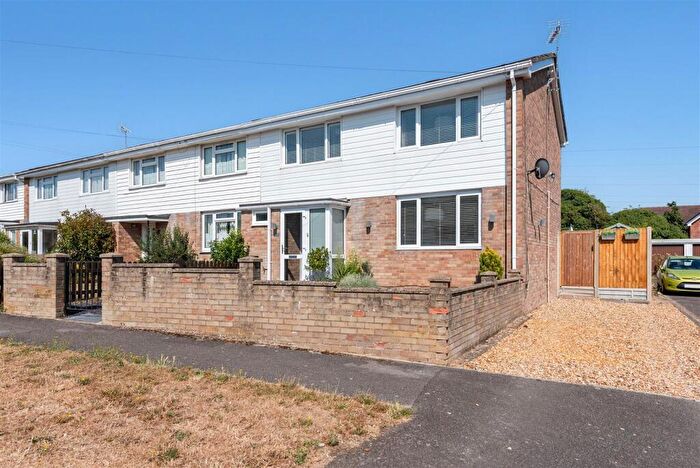
![]()
If you are looking to sell your house, let it out, or receive a property valuation, an expert can help you.
Click the button below to get started.

Neighbourhoods in Andover
Navigate through our locations to find the location of your next house in Andover, Hampshire for sale or to rent.
- Alamein
- Amport
- Anna
- Bourne Valley
- Burghclere, Highclere And St Mary Bourne
- Charlton
- Harewood
- Harroway
- Millway
- Over Wallop
- Penton Bellinger
- St Marys
- Whitchurch
- Winton
- Bellinger
- Andover St Mary's
- Andover Winton
- Andover Millway
- Andover Harroway
- Charlton & the Pentons
- Andover Downlands
- Andover Romans
- Evingar
Property price trends in Andover
According to the latest Land Registry data, the average home in Andover sold for £359,964 in 2026. That figure comes from a substantial record of 35,394 sales logged over the past 31 years.
Prices have softened over the last three years. Compared with 2023, when the typical sale came in around £370,168, that's a fall of roughly 2.8%.
Looking back five years, average prices are up about 3.8% since 2021, a gain of around £13,270 in cash terms.
Zoom out to the past decade for the fuller picture. Back in 2016, homes here averaged £281,068, so the typical sold price has climbed about 28.1% since then, roughly 2.5% a year. Stretch the view to fifteen years and that annual pace holds at about 2.5%.
Frequently asked questions about Andover
What is the average price for a property for sale in Andover?
The average price for a property for sale in Andover is £357,094. This amount is 15% lower than the average price in Hampshire. There are 9,350 property listings for sale in Andover.
What locations have the most expensive properties for sale in Andover?
The locations with the most expensive properties for sale in Andover are Over Wallop at an average of £890,500, Harewood at an average of £779,627 and Bourne Valley at an average of £722,348.
What locations have the most affordable properties for sale in Andover?
The locations with the most affordable properties for sale in Andover are Andover Millway at an average of £133,388, Andover St Mary's at an average of £248,344 and St Marys at an average of £257,918.
Which train stations are available in or near Andover?
Some of the train stations available in or near Andover are Andover, Grateley and Whitchurch (Hampshire).
Property Price Paid in Andover by Year
The average sold property price by year was:
| Year | Average Sold Price | Price Change |
Sold Properties
|
|---|---|---|---|
| 2026 | £359,964 | 3% |
65 Properties |
| 2025 | £350,133 | -0,3% |
880 Properties |
| 2024 | £351,246 | -5% |
889 Properties |
| 2023 | £370,168 | -5% |
852 Properties |
| 2022 | £386,938 | 10% |
1,043 Properties |
| 2021 | £346,694 | 7% |
1,404 Properties |
| 2020 | £323,032 | 8% |
1,096 Properties |
| 2019 | £296,256 | -2% |
1,273 Properties |
| 2018 | £303,431 | 2% |
1,239 Properties |
| 2017 | £298,401 | 6% |
1,311 Properties |
Property Price per Property Type in Andover
Here you can find historic sold price data in order to help with your property search.
The average Property Paid Price for specific property types in the last three years are:
| Property Type | Average Sold Price | Sold Properties |
|---|---|---|
| Semi Detached House | £339,672.00 | 711 Semi Detached Houses |
| Terraced House | £273,598.00 | 802 Terraced Houses |
| Detached House | £567,039.00 | 754 Detached Houses |
| Flat | £168,674.00 | 419 Flats |
Transport in Andover
Please see below transportation links in this area:
