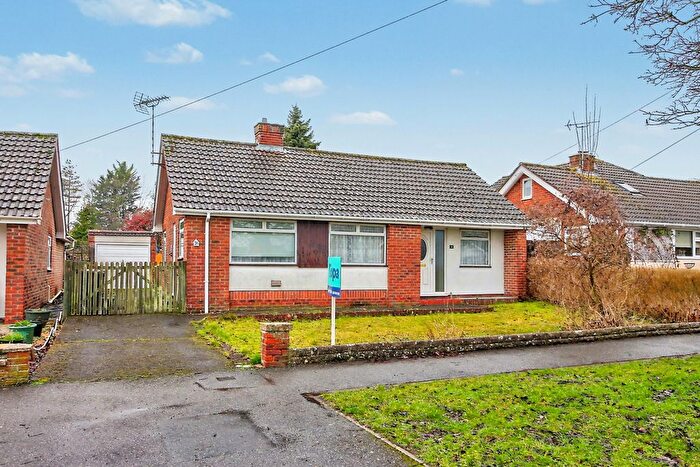
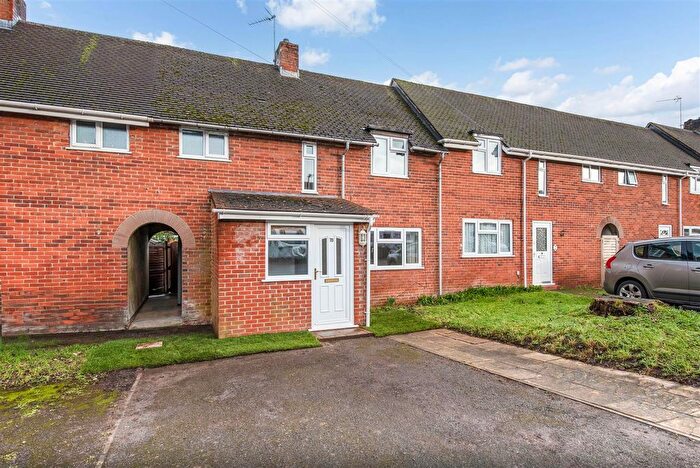
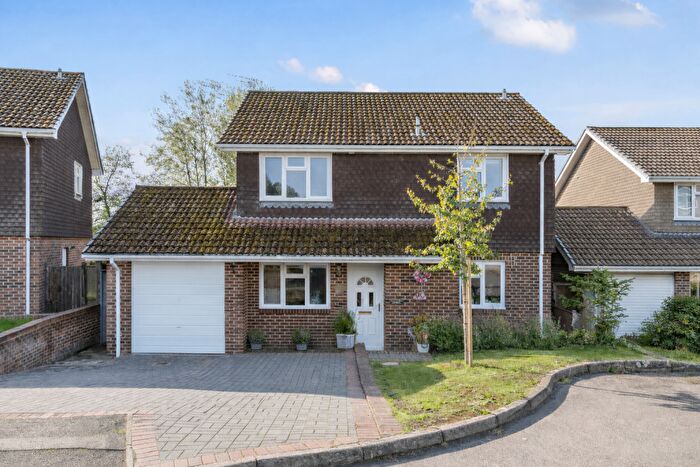
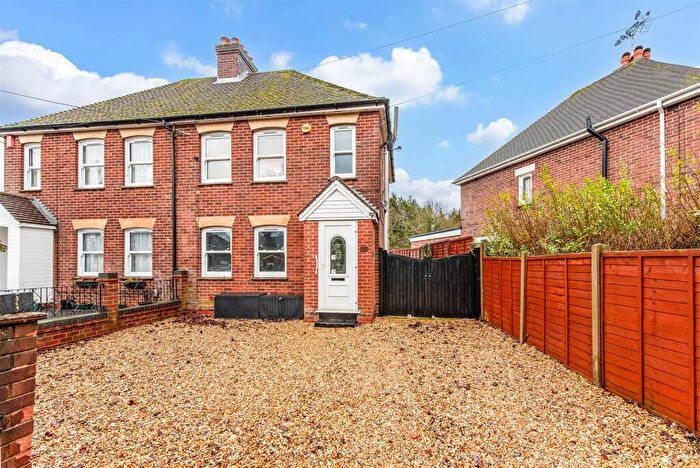
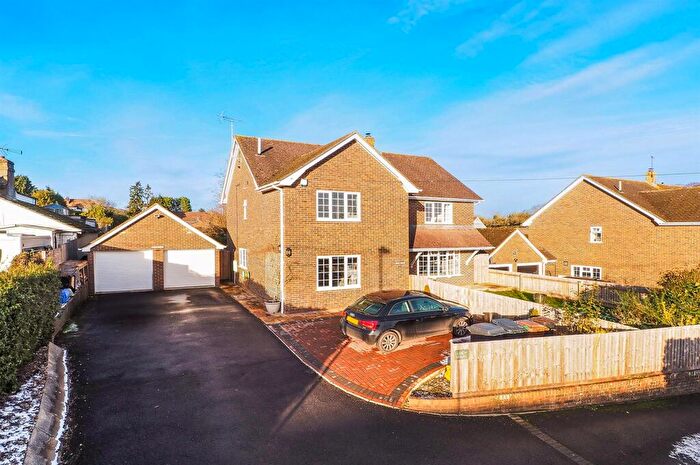
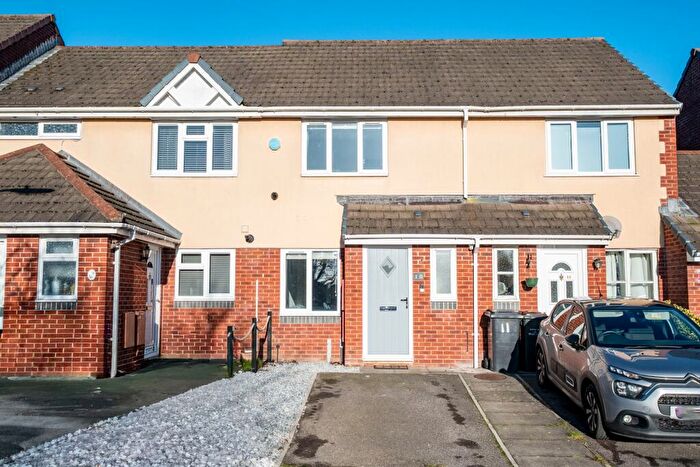
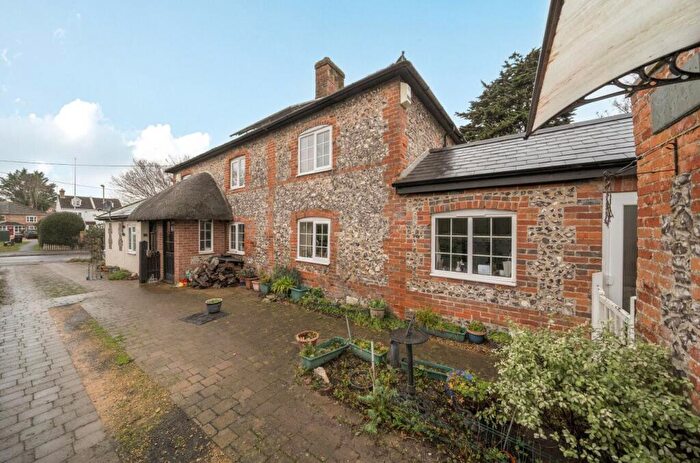
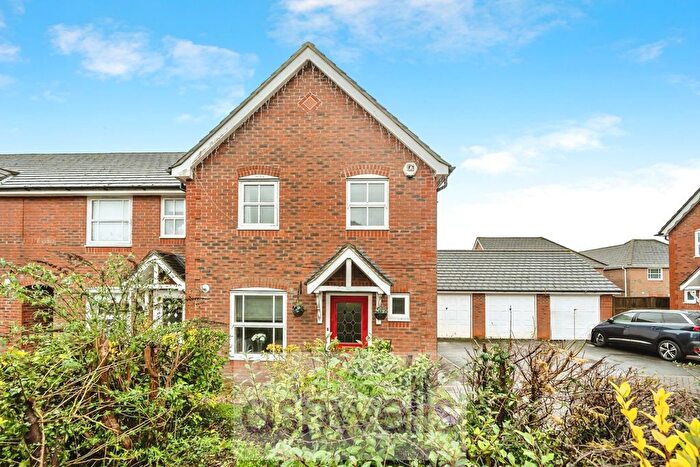
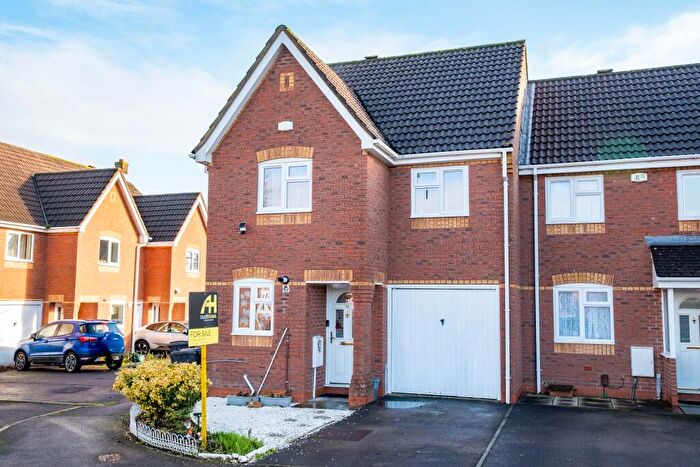
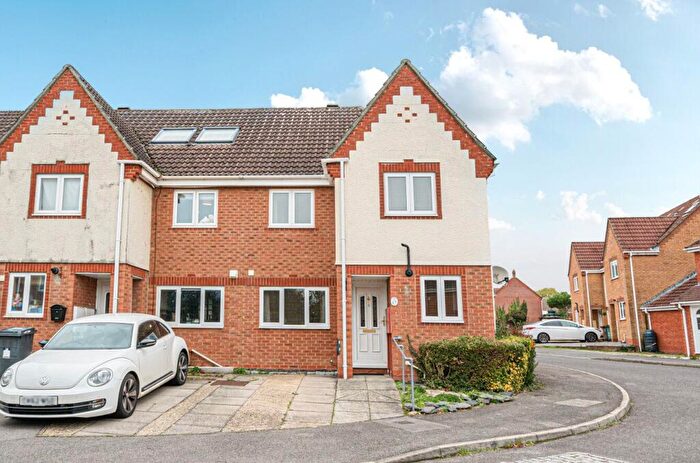
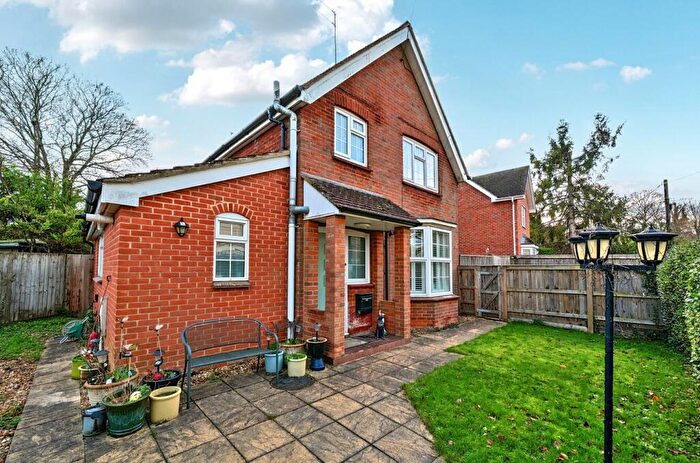
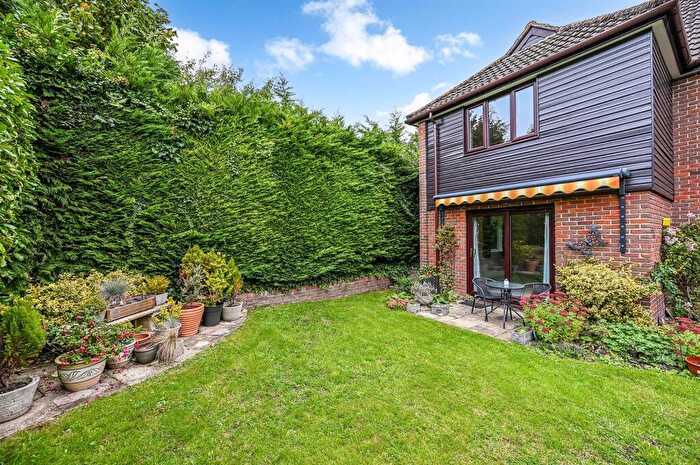
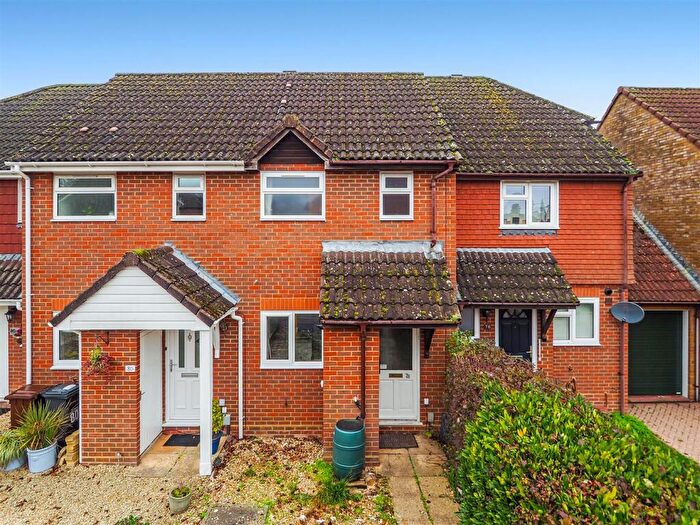
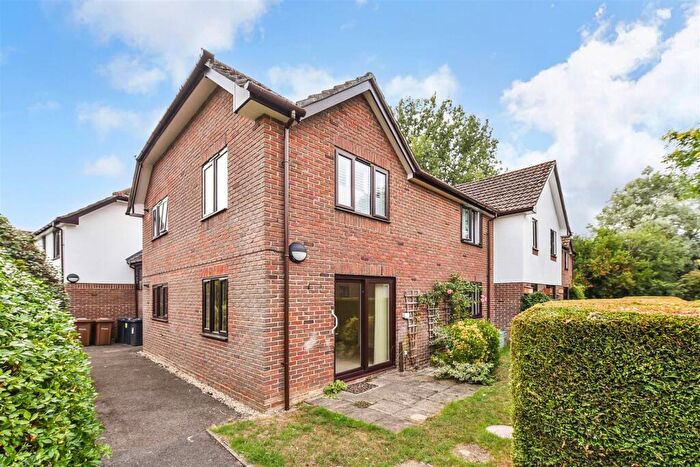
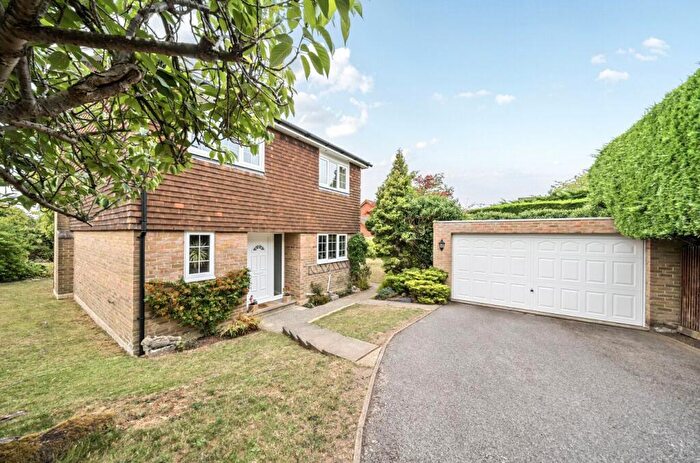
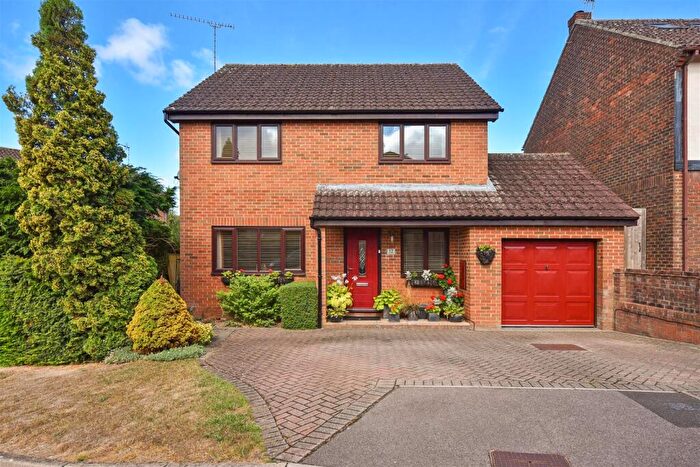
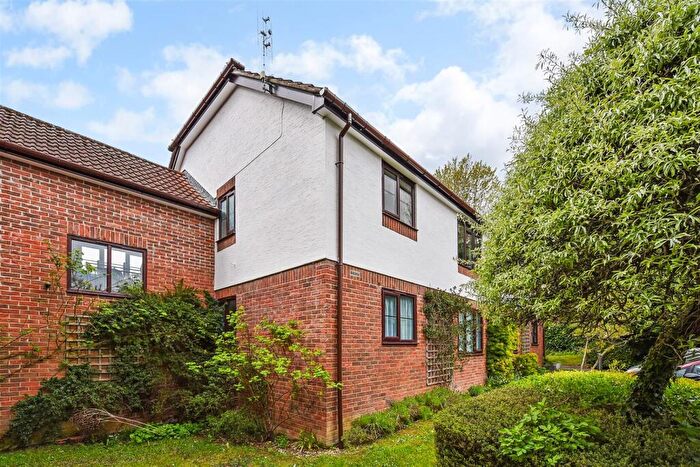
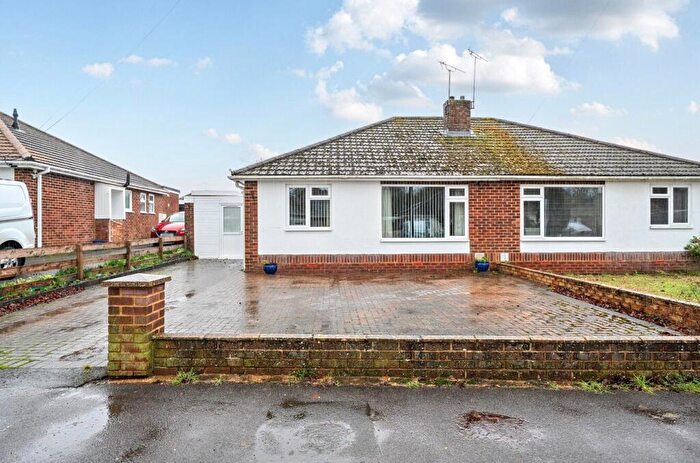
Houses for sale & to rent in Charlton, Andover
House Prices in Charlton
Properties in Charlton have an average house price of £334,432.00 and had 88 Property Transactions within the last 3 years¹.
Charlton is an area in Andover, Hampshire with 839 households², where the most expensive property was sold for £875,000.00.
Properties for sale in Charlton
Previously listed properties in Charlton
Roads and Postcodes in Charlton
Navigate through our locations to find the location of your next house in Charlton, Andover for sale or to rent.
| Streets | Postcodes |
|---|---|
| Aldrin Close | SP10 4DZ |
| Armstrong Rise | SP10 4EB SP10 4ED |
| Augustine Way | SP10 4EG |
| Barton Close | SP10 4RP |
| Bede Drive | SP10 4EQ |
| Bradwell Close | SP10 4EL |
| Brancaster Avenue | SP10 4EN |
| Carters Meadow | SP10 4AE SP10 4AF |
| Collins Close | SP10 4EA |
| Dacre Close | SP10 4HE |
| Enham Lane | SP10 4AN |
| Ethelbert Drive | SP10 4EP |
| Foxcotte Close | SP10 4AS |
| Foxcotte Road | SP10 4AR SP10 4AT |
| Hengest Close | SP10 4ET |
| Hillside Villas | SP10 4AQ |
| Home Farm Gardens | SP10 4AX |
| Kimberley Close | SP10 4HB |
| Lakeside Close | SP10 4AY |
| Litchfield Close | SP10 4RR |
| Mercia Avenue | SP10 4EJ SP10 4HA |
| New Cottages | SP10 4AD |
| Porchester Close | SP10 4ER |
| Reculver Way | SP10 4EH |
| Richborough Drive | SP10 4EZ |
| St Thomas Close | SP10 4DY |
| Sunnyside Close | SP10 4AL |
| The Green | SP10 4AZ |
| Tower Close | SP10 4RS |
| Wetherby Gardens | SP10 4DH |
| SP10 4AA SP10 4AB SP10 4AH SP10 4AJ SP10 4AP SP10 4AW SP11 0HF |
Transport near Charlton
- FAQ
- Price Paid By Year
- Property Type Price
Frequently asked questions about Charlton
What is the average price for a property for sale in Charlton?
The average price for a property for sale in Charlton is £334,432. This amount is 8% lower than the average price in Andover. There are 437 property listings for sale in Charlton.
What streets have the most expensive properties for sale in Charlton?
The streets with the most expensive properties for sale in Charlton are Bradwell Close at an average of £740,000, Lakeside Close at an average of £680,000 and Reculver Way at an average of £510,000.
What streets have the most affordable properties for sale in Charlton?
The streets with the most affordable properties for sale in Charlton are The Green at an average of £212,500, Carters Meadow at an average of £226,102 and Armstrong Rise at an average of £249,916.
Which train stations are available in or near Charlton?
Some of the train stations available in or near Charlton are Andover, Grateley and Whitchurch (Hampshire).
Property Price Paid in Charlton by Year
The average sold property price by year was:
| Year | Average Sold Price | Price Change |
Sold Properties
|
|---|---|---|---|
| 2025 | £284,062 | -22% |
28 Properties |
| 2024 | £347,798 | -6% |
30 Properties |
| 2023 | £368,078 | 9% |
30 Properties |
| 2022 | £333,138 | 6% |
36 Properties |
| 2021 | £314,417 | 16% |
32 Properties |
| 2020 | £263,391 | -27% |
28 Properties |
| 2019 | £334,713 | 11% |
29 Properties |
| 2018 | £297,444 | 4% |
27 Properties |
| 2017 | £286,181 | 14% |
35 Properties |
| 2016 | £247,468 | -3% |
40 Properties |
| 2015 | £254,032 | 1% |
41 Properties |
| 2014 | £250,454 | 7% |
24 Properties |
| 2013 | £233,157 | 13% |
35 Properties |
| 2012 | £202,212 | -30% |
28 Properties |
| 2011 | £263,640 | 14% |
19 Properties |
| 2010 | £226,437 | 17% |
29 Properties |
| 2009 | £187,952 | -18% |
21 Properties |
| 2008 | £221,910 | -9% |
24 Properties |
| 2007 | £241,471 | 11% |
49 Properties |
| 2006 | £215,068 | 12% |
49 Properties |
| 2005 | £188,518 | 2% |
43 Properties |
| 2004 | £184,079 | 4% |
39 Properties |
| 2003 | £176,680 | 11% |
41 Properties |
| 2002 | £157,054 | 9% |
46 Properties |
| 2001 | £142,710 | 10% |
51 Properties |
| 2000 | £128,238 | 17% |
44 Properties |
| 1999 | £105,959 | 16% |
77 Properties |
| 1998 | £88,921 | 10% |
46 Properties |
| 1997 | £80,452 | 0,1% |
55 Properties |
| 1996 | £80,352 | -5% |
49 Properties |
| 1995 | £84,000 | - |
40 Properties |
Property Price per Property Type in Charlton
Here you can find historic sold price data in order to help with your property search.
The average Property Paid Price for specific property types in the last three years are:
| Property Type | Average Sold Price | Sold Properties |
|---|---|---|
| Semi Detached House | £340,164.00 | 25 Semi Detached Houses |
| Detached House | £502,285.00 | 21 Detached Houses |
| Terraced House | £276,174.00 | 27 Terraced Houses |
| Flat | £194,750.00 | 15 Flats |

