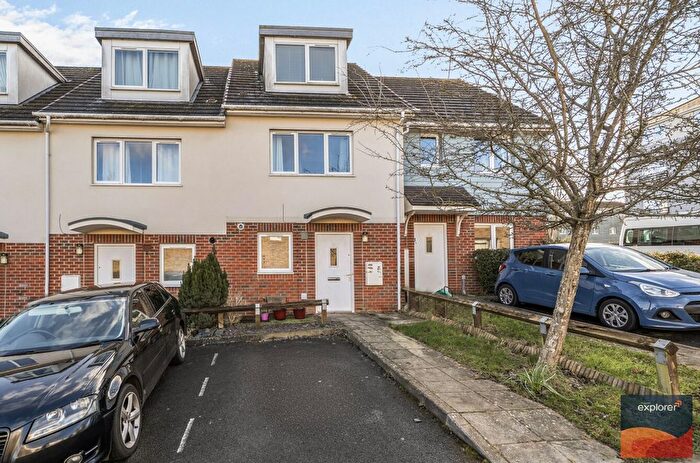
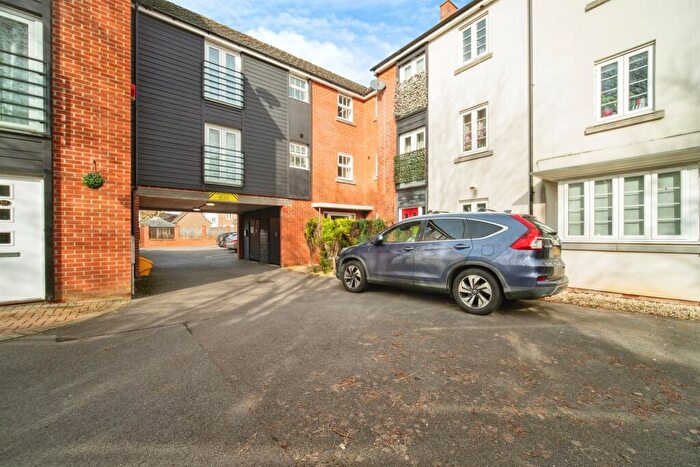
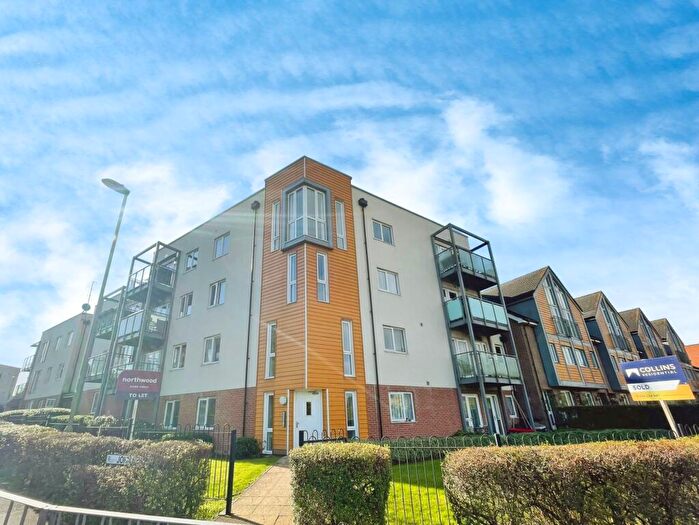
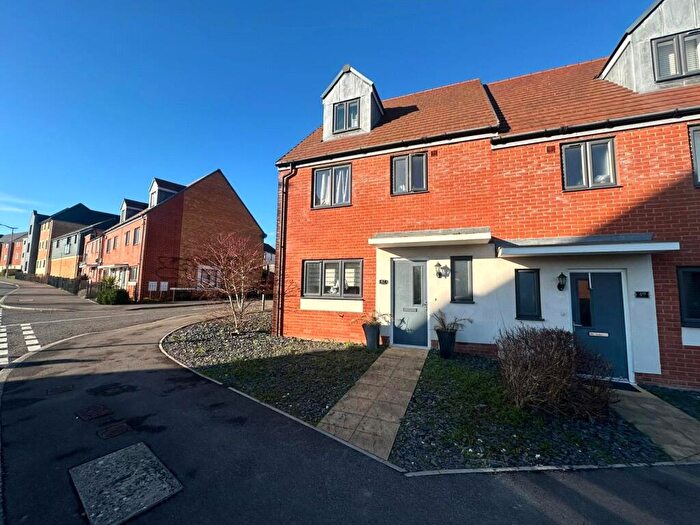
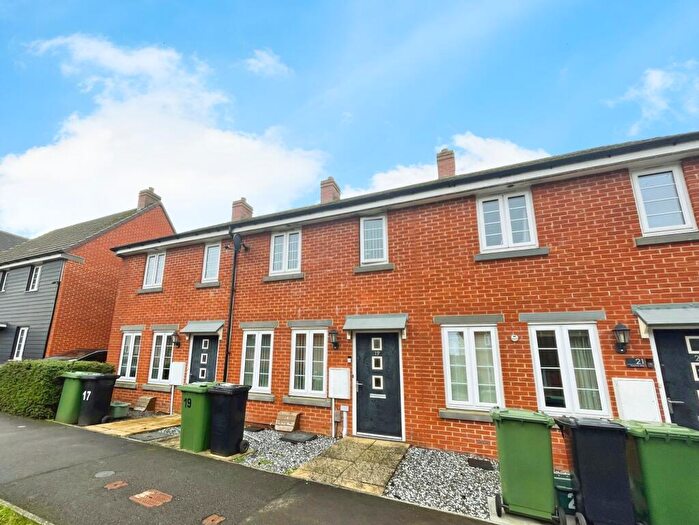
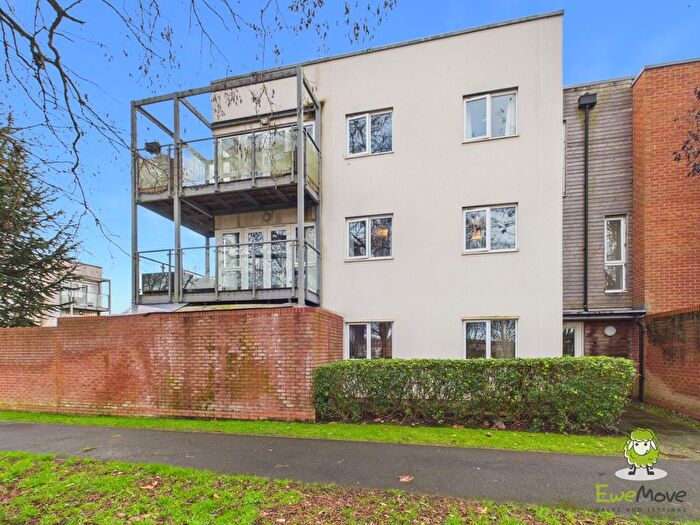
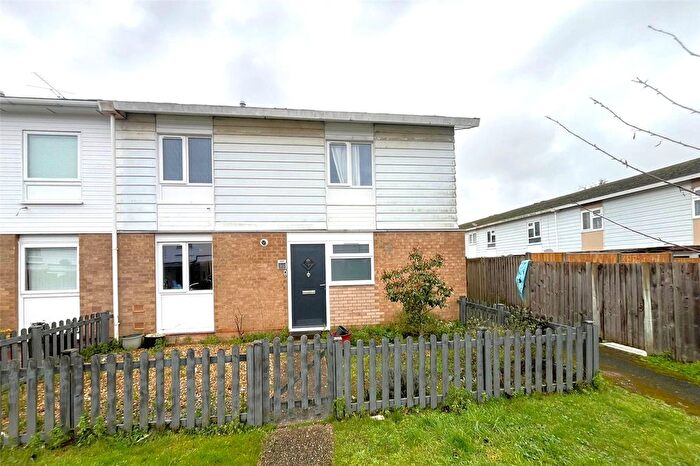
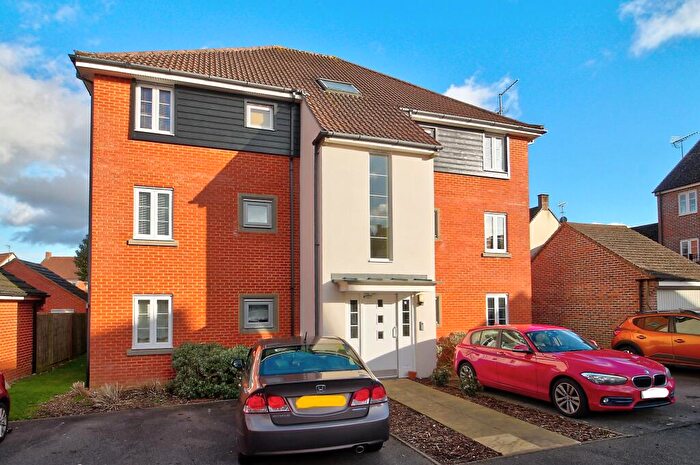
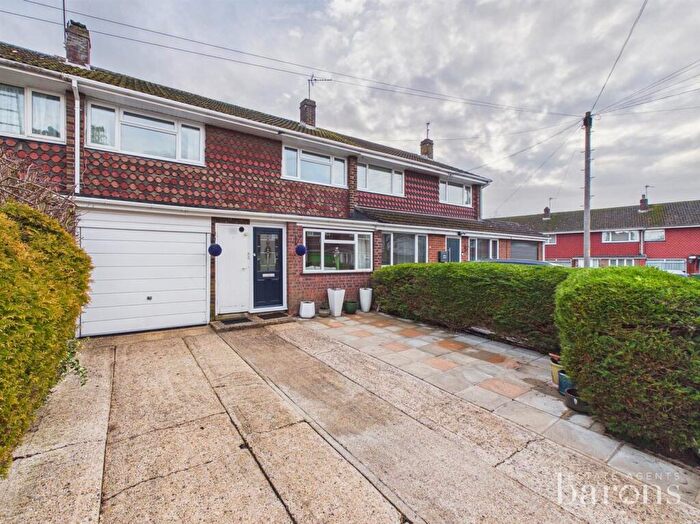
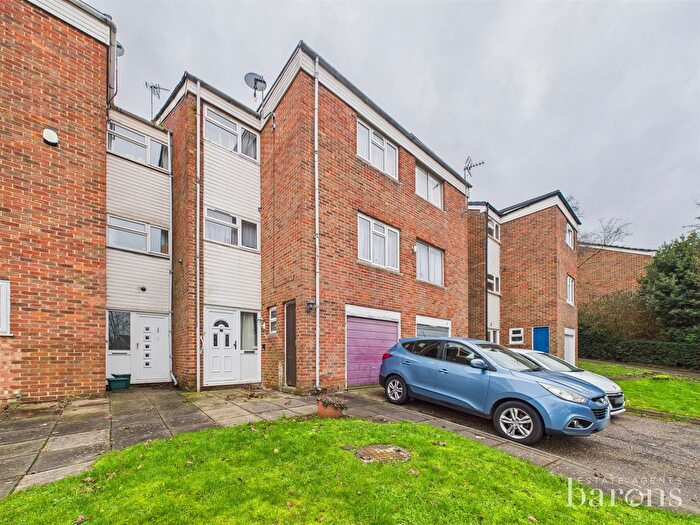
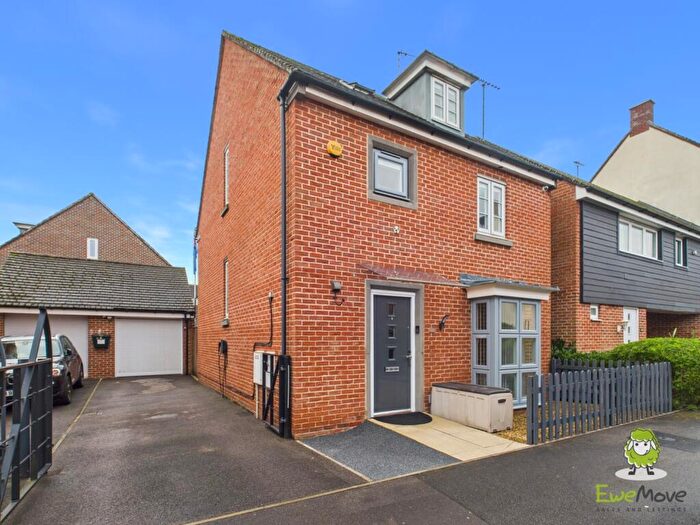
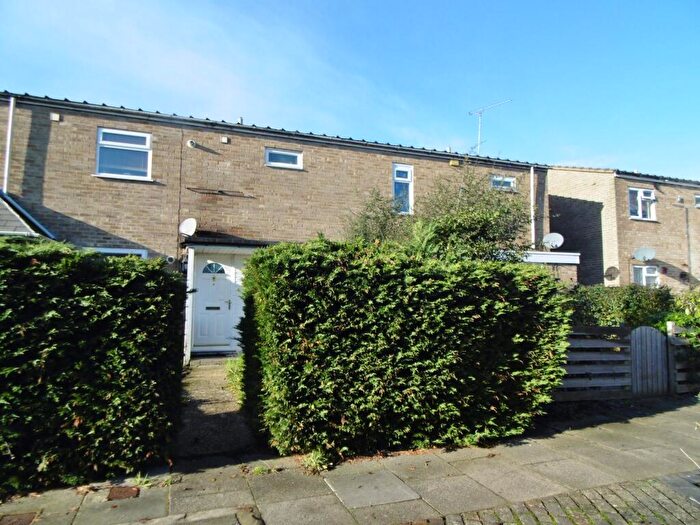
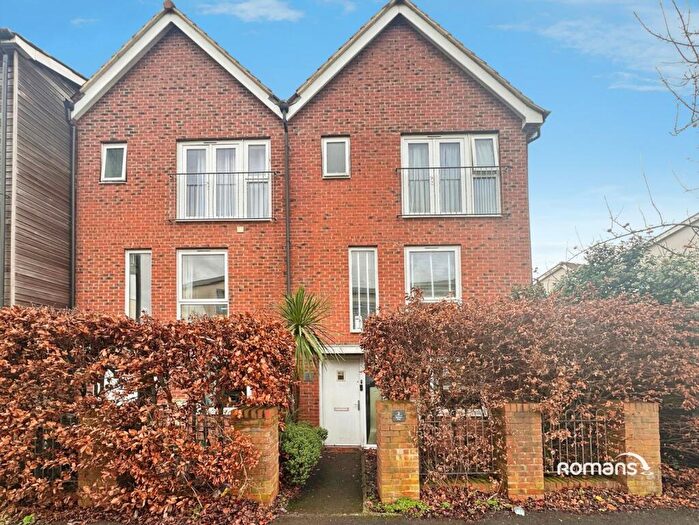
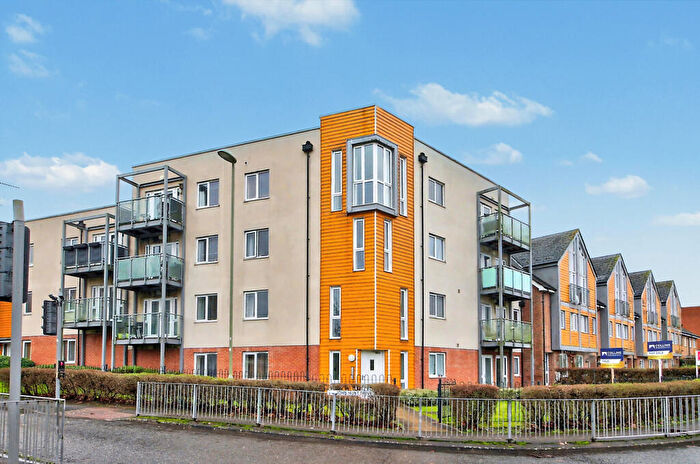
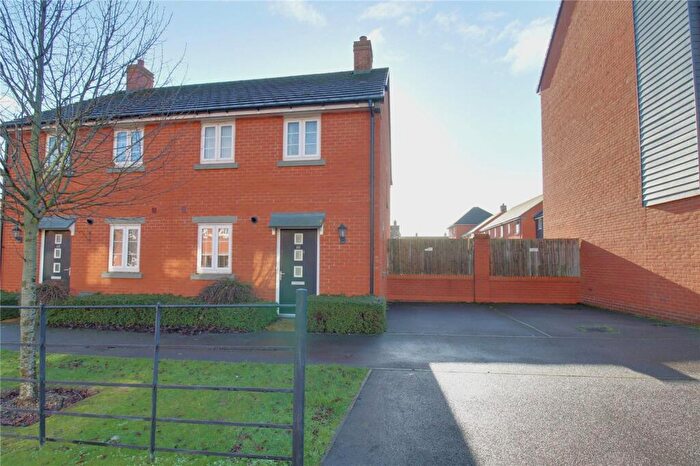
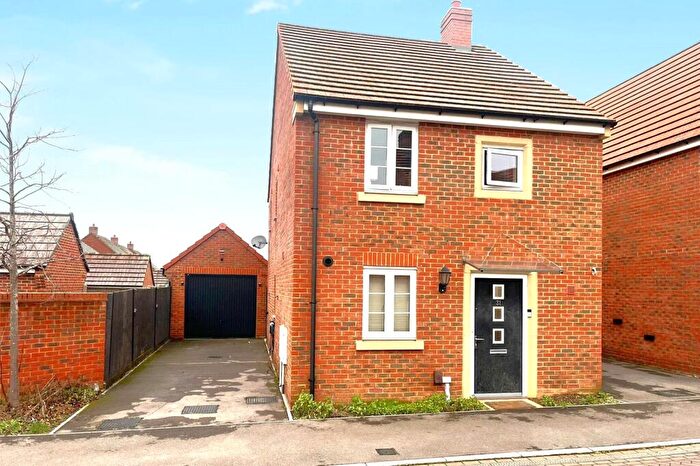
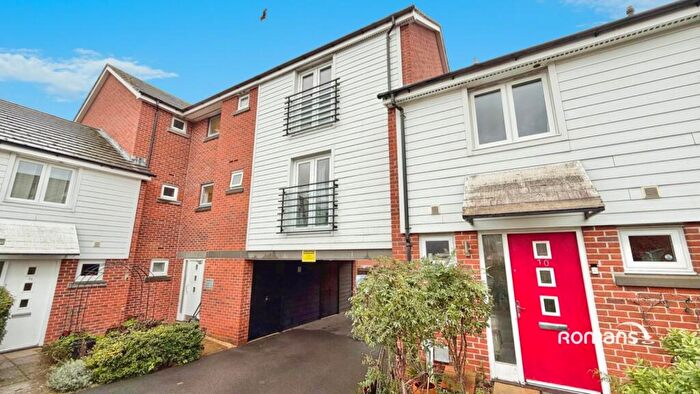
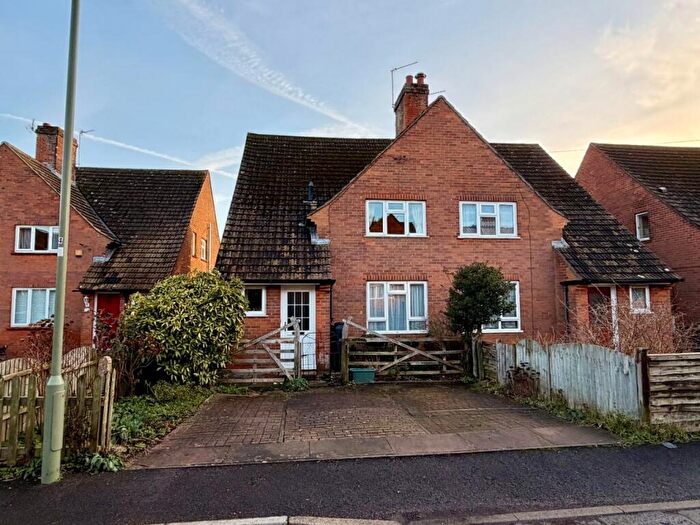
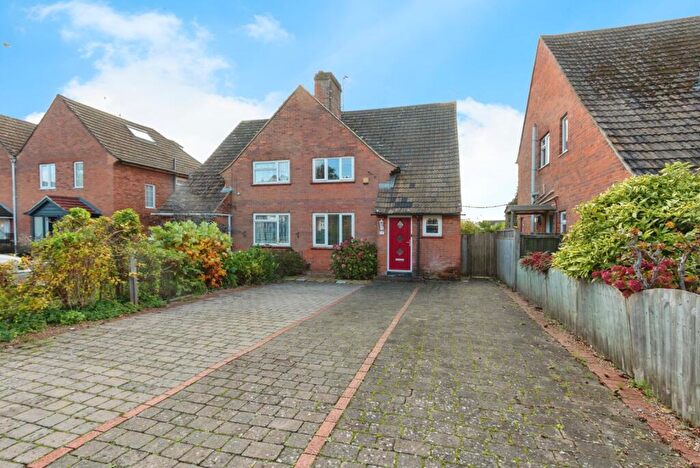
Houses for sale & to rent in Popley West, Basingstoke
House Prices in Popley West
Properties in Popley West have an average house price of £298,964.00 and had 226 Property Transactions within the last 3 years¹.
Popley West is an area in Basingstoke, Hampshire with 2,066 households², where the most expensive property was sold for £615,000.00.
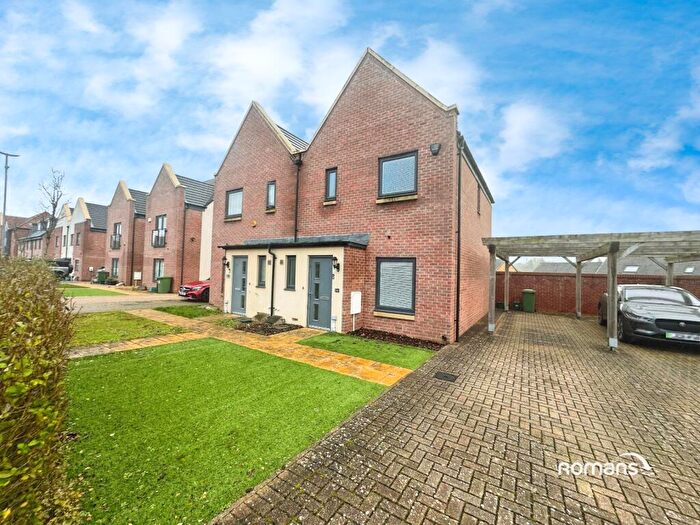
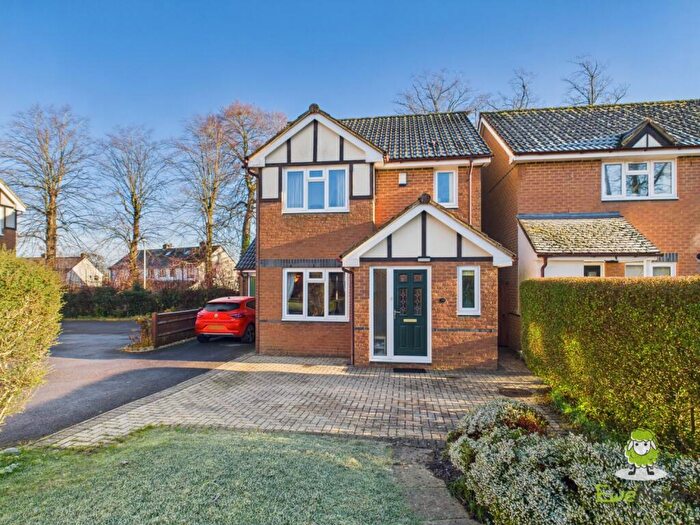
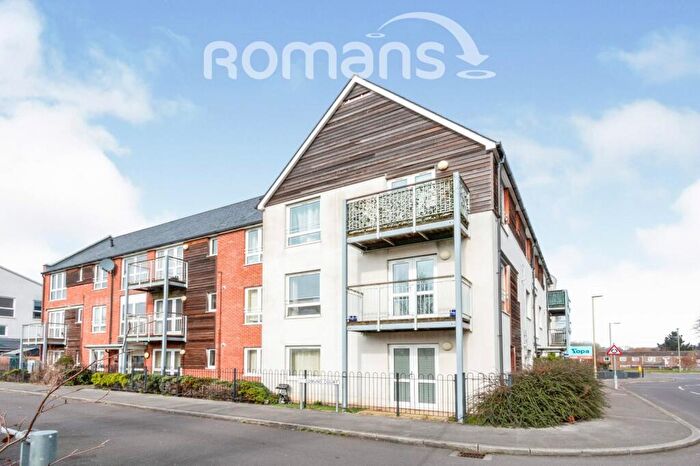
Properties for sale in Popley West
Roads and Postcodes in Popley West
Navigate through our locations to find the location of your next house in Popley West, Basingstoke for sale or to rent.
| Streets | Postcodes |
|---|---|
| Abbey Road | RG24 9DY RG24 9EA RG24 9EB RG24 9ED RG24 9EF RG24 9EG RG24 9EH RG24 9EJ RG24 9EL RG24 9EN RG24 9EP RG24 9EQ RG24 9ER RG24 9ET RG24 9EW |
| Appleton Drive | RG24 9RW RG24 9RX |
| Banbury Way | RG24 9FR |
| Barrington Drive | RG24 9RS |
| Benham Road | RG24 9TJ |
| Buckfast Close | RG24 9HD |
| Carter Drive | RG24 9UL |
| Charlbury Lane | RG24 9GF |
| Cleeve Road | RG24 9RZ |
| Egerton Drive | RG24 9FG |
| Englefield Way | RG24 9FJ RG24 9SF |
| Eynsham Walk | RG24 9GP |
| Faringdon Court | RG24 9FE |
| Fisher Close | RG24 9TL |
| Fountains Close | RG24 9EZ RG24 9HA |
| Gardiner Road | RG24 9FH |
| Gibbons Place | RG24 9UR |
| Glastonbury Close | RG24 9EY |
| Hewitt Road | RG24 9FL |
| Hutchins Way | RG24 9UN |
| Ilsley Road | RG24 9RU |
| Kew Close | RG24 9TP |
| Kidlington Road | RG24 9QG |
| Marston Walk | RG24 9FS |
| Melrose Walk | RG24 9HG RG24 9HH RG24 9HQ |
| Merryweather Way | RG24 9FN |
| Netherfield Place | RG24 9AF |
| Oxford Way | RG24 9FP |
| Pemberley Place | RG24 9FB |
| Penton Way | RG24 9RT |
| Risinghurst Mews | RG24 9FZ |
| Romsey Close | RG24 9HB |
| Selby Walk | RG24 9DZ RG24 9EE |
| Shrivenham Walk | RG24 9GR |
| Speckled Wood Road | RG24 9SR |
| Spire Close | RG24 9TN |
| Taplin Close | RG24 9FQ |
| Tintern Close | RG24 9HE RG24 9HF |
| Warner Close | RG24 9RY |
| Wheeler Way | RG24 9TQ |
Transport near Popley West
-
Basingstoke Station
-
Bramley (Hampshire) Station
-
Hook Station
-
Mortimer Station
-
Overton Station
-
Winchfield Station
-
Aldermaston Station
-
Midgham Station
- FAQ
- Price Paid By Year
- Property Type Price
Frequently asked questions about Popley West
What is the average price for a property for sale in Popley West?
The average price for a property for sale in Popley West is £298,964. This amount is 19% lower than the average price in Basingstoke. There are 880 property listings for sale in Popley West.
What streets have the most expensive properties for sale in Popley West?
The streets with the most expensive properties for sale in Popley West are Cleeve Road at an average of £468,571, Marston Walk at an average of £450,000 and Gardiner Road at an average of £434,833.
What streets have the most affordable properties for sale in Popley West?
The streets with the most affordable properties for sale in Popley West are Netherfield Place at an average of £168,666, Faringdon Court at an average of £200,000 and Selby Walk at an average of £207,800.
Which train stations are available in or near Popley West?
Some of the train stations available in or near Popley West are Basingstoke, Bramley (Hampshire) and Hook.
Property Price Paid in Popley West by Year
The average sold property price by year was:
| Year | Average Sold Price | Price Change |
Sold Properties
|
|---|---|---|---|
| 2025 | £305,174 | 5% |
66 Properties |
| 2024 | £289,136 | -4% |
70 Properties |
| 2023 | £302,055 | 5% |
90 Properties |
| 2022 | £287,606 | 5% |
77 Properties |
| 2021 | £274,026 | 1% |
120 Properties |
| 2020 | £270,162 | -9% |
86 Properties |
| 2019 | £295,745 | 13% |
104 Properties |
| 2018 | £256,255 | -0,2% |
98 Properties |
| 2017 | £256,680 | -1% |
128 Properties |
| 2016 | £259,881 | 15% |
122 Properties |
| 2015 | £220,925 | 10% |
130 Properties |
| 2014 | £197,938 | 5% |
126 Properties |
| 2013 | £188,510 | 5% |
79 Properties |
| 2012 | £178,304 | -9% |
69 Properties |
| 2011 | £194,651 | -6% |
116 Properties |
| 2010 | £206,490 | 19% |
177 Properties |
| 2009 | £167,593 | -11% |
197 Properties |
| 2008 | £186,208 | -8% |
219 Properties |
| 2007 | £200,873 | 19% |
199 Properties |
| 2006 | £163,694 | 8% |
92 Properties |
| 2005 | £151,234 | 6% |
45 Properties |
| 2004 | £141,900 | 4% |
52 Properties |
| 2003 | £135,970 | 14% |
55 Properties |
| 2002 | £116,452 | 10% |
70 Properties |
| 2001 | £104,685 | 11% |
55 Properties |
| 2000 | £93,281 | 24% |
50 Properties |
| 1999 | £70,624 | -27% |
56 Properties |
| 1998 | £89,889 | 37% |
84 Properties |
| 1997 | £56,191 | 7% |
42 Properties |
| 1996 | £52,027 | 9% |
35 Properties |
| 1995 | £47,134 | - |
36 Properties |
Property Price per Property Type in Popley West
Here you can find historic sold price data in order to help with your property search.
The average Property Paid Price for specific property types in the last three years are:
| Property Type | Average Sold Price | Sold Properties |
|---|---|---|
| Semi Detached House | £374,214.00 | 21 Semi Detached Houses |
| Detached House | £488,652.00 | 23 Detached Houses |
| Terraced House | £300,347.00 | 133 Terraced Houses |
| Flat | £173,924.00 | 49 Flats |

