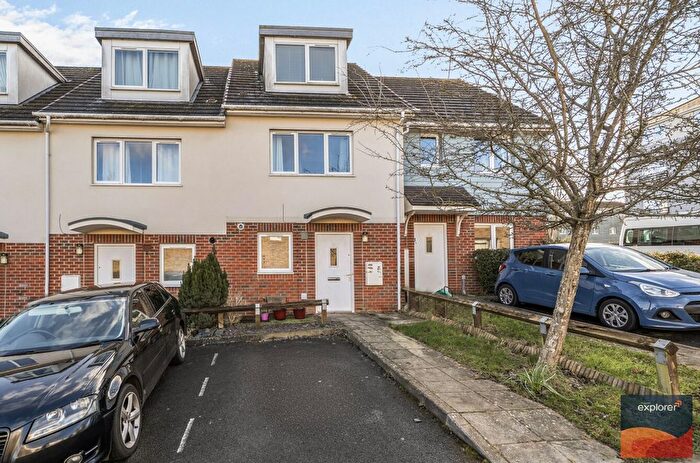
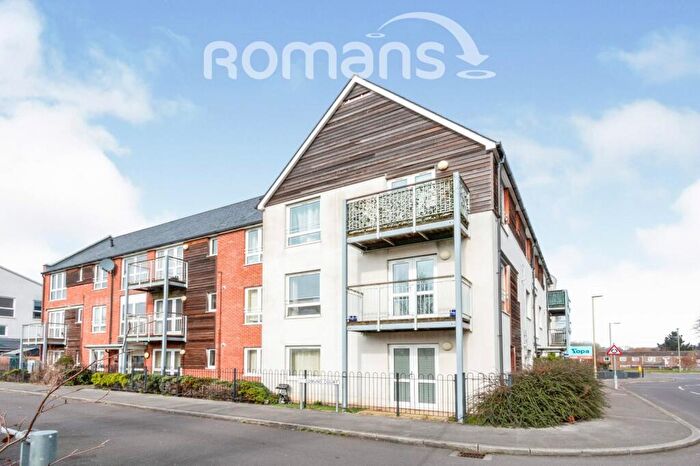
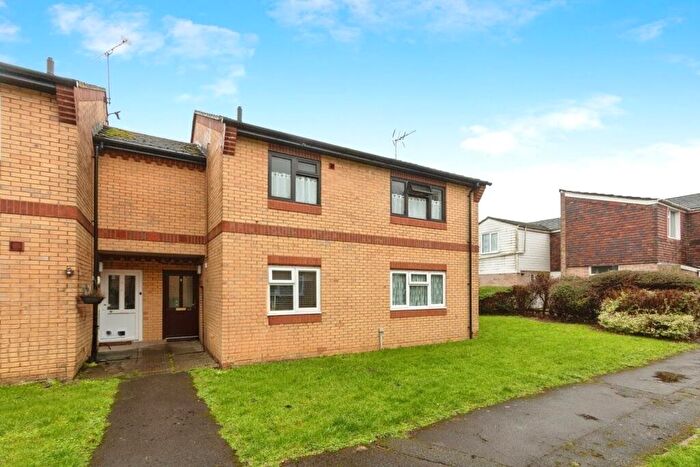
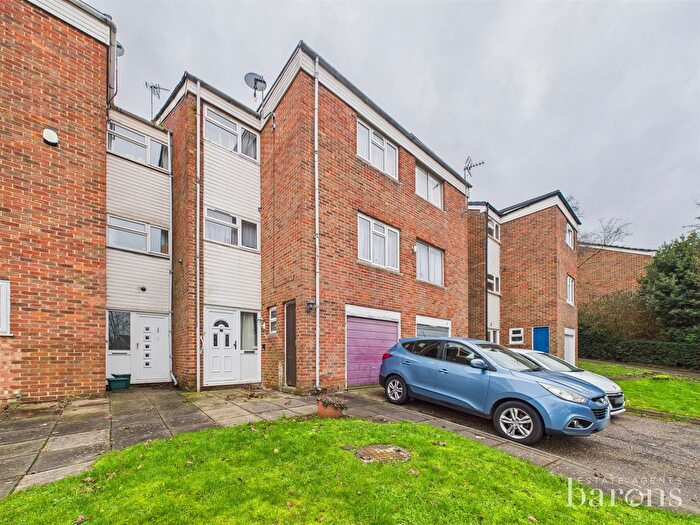
Houses for sale & to rent in Popley East, Basingstoke
House Prices in Popley East
Properties in Popley East have an average house price of £266,788.00 and had 179 Property Transactions within the last 3 years¹.
Popley East is an area in Basingstoke, Hampshire with 2,318 households², where the most expensive property was sold for £590,000.00.
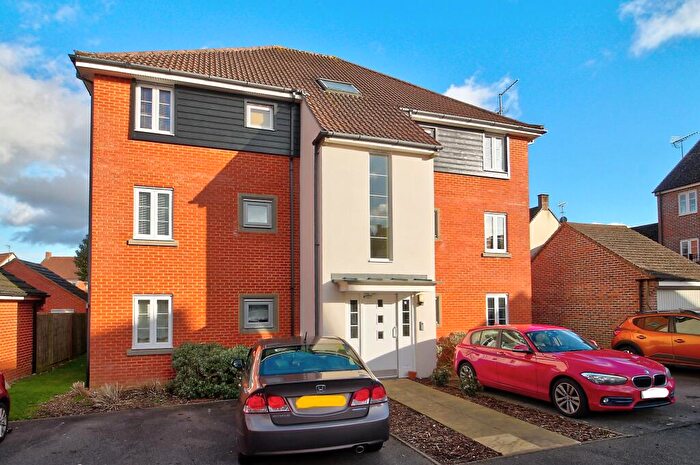
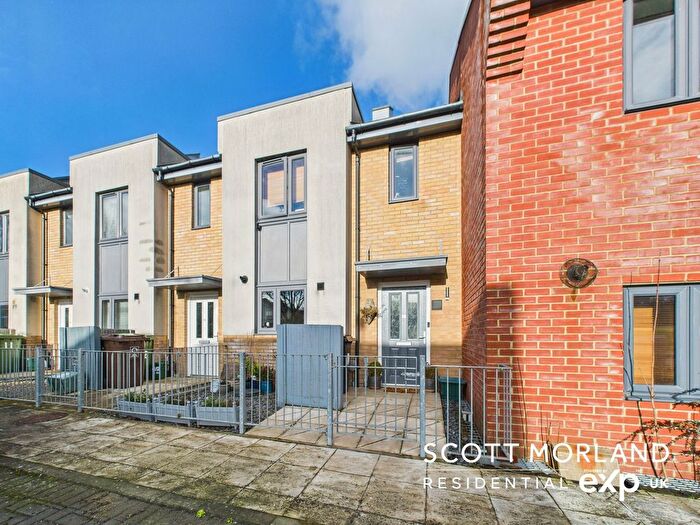
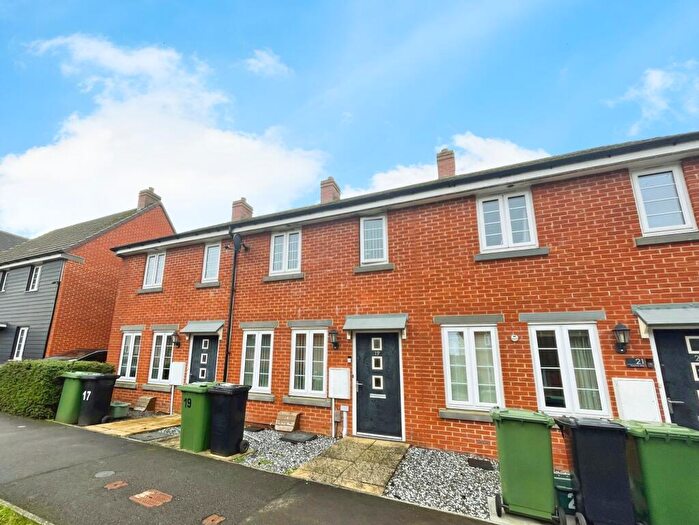
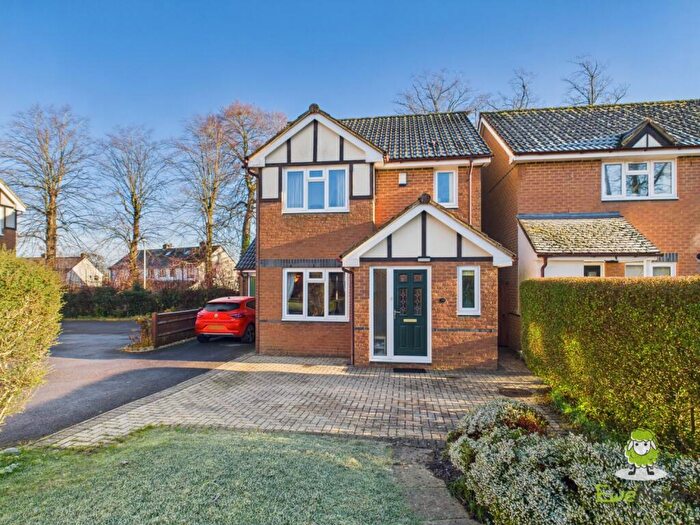
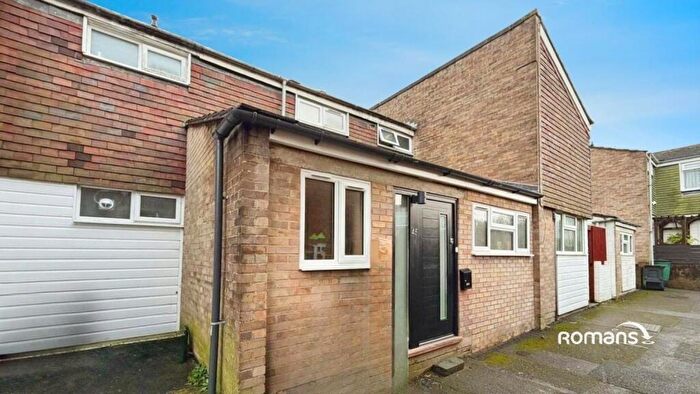
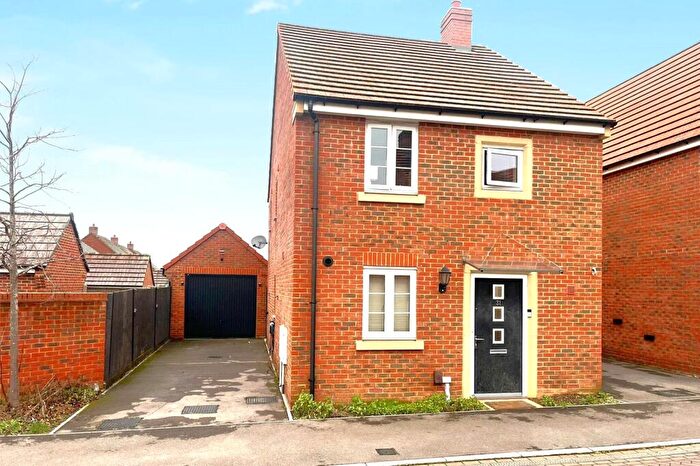
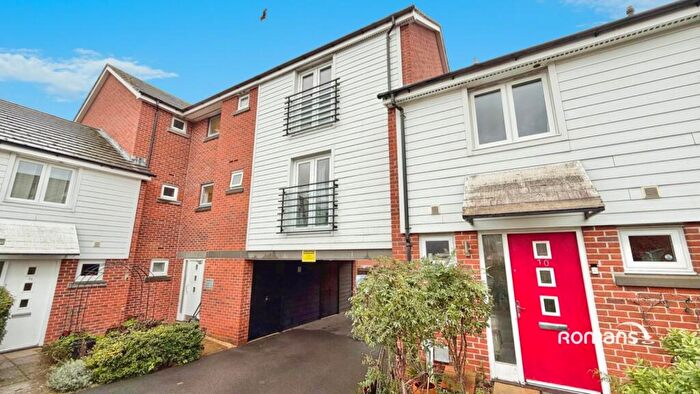
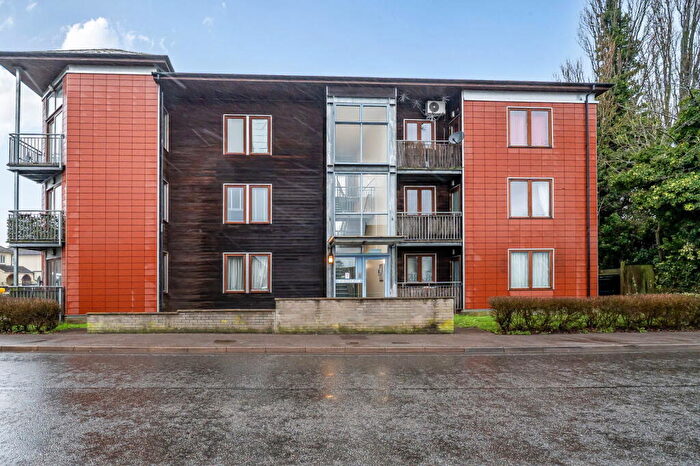
Properties for sale in Popley East
Roads and Postcodes in Popley East
Navigate through our locations to find the location of your next house in Popley East, Basingstoke for sale or to rent.
| Streets | Postcodes |
|---|---|
| Anglesey Close | RG24 9PP |
| Ascension Close | RG24 9AZ RG24 9BA |
| Bermuda Close | RG24 9PE |
| Bourdillon Gardens | RG24 9GG |
| Browning Close | RG24 9DG RG24 9DQ |
| Burns Close | RG24 9DB |
| Byron Close | RG24 9BN |
| Cayman Close | RG24 9AG RG24 9AQ |
| Chaucer Close | RG24 9DN RG24 9DW |
| Dominica Close | RG24 9PG |
| Dryden Close | RG24 9DJ RG24 9DL |
| Edmund Court | RG24 9FA RG24 9SZ |
| Evesham Walk | RG24 9BJ |
| Falkland Road | RG24 9PH RG24 9PJ RG24 9PL RG24 9PN |
| Faroe Close | RG24 9AL RG24 9AN |
| Gilbert Close | RG24 9PA |
| Guernsey Close | RG24 9PS |
| Hargreaves Close | RG24 9SS |
| Hathaway Gardens | RG24 9BF |
| Irvine Crescent | RG24 9TS |
| Jersey Close | RG24 9PR |
| John Hunt Drive | RG24 9TX |
| Keats Close | RG24 9BS |
| Lawrence Close | RG24 9DP |
| Lowe Gardens | RG24 9TR |
| Lundy Close | RG24 9AH RG24 9AJ |
| Madeira Close | RG24 9AY |
| Maldive Road | RG24 9AS RG24 9AU RG24 9AX |
| Mallory Road | RG24 9GB |
| Malta Close | RG24 9PD |
| Marlowe Close | RG24 9DD |
| Messner Street | RG24 9TT |
| Milton Close | RG24 9BT RG24 9BY |
| Montserrat Place | RG24 9PW |
| Montserrat Road | RG24 9PF |
| Orkney Close | RG24 9AR |
| Pershore Road | RG24 9BE RG24 9BG RG24 9BH RG24 9BQ |
| Pitcairn Close | RG24 9BB RG24 9BD |
| Rossetti Close | RG24 9FF |
| Shakespeare Road | RG24 9BW RG24 9DH |
| Shelley Close | RG24 9BZ RG24 9DA |
| Shetland Road | RG24 9WH |
| Tasmania Close | RG24 9PQ |
| Tenzing Gardens | RG24 9TW |
| Tewkesbury Close | RG24 9DU |
| Timor Close | RG24 9PB |
| Tobago Close | RG24 9PX |
| Trinidad Close | RG24 9PY |
| Wordsworth Close | RG24 9DE RG24 9DF |
| Wylie Gardens | RG24 9TU |
Transport near Popley East
-
Basingstoke Station
-
Bramley (Hampshire) Station
-
Hook Station
-
Mortimer Station
-
Winchfield Station
-
Overton Station
-
Aldermaston Station
-
Midgham Station
- FAQ
- Price Paid By Year
- Property Type Price
Frequently asked questions about Popley East
What is the average price for a property for sale in Popley East?
The average price for a property for sale in Popley East is £266,788. This amount is 27% lower than the average price in Basingstoke. There are 850 property listings for sale in Popley East.
What streets have the most expensive properties for sale in Popley East?
The streets with the most expensive properties for sale in Popley East are Irvine Crescent at an average of £590,000, Hathaway Gardens at an average of £430,000 and Hargreaves Close at an average of £400,000.
What streets have the most affordable properties for sale in Popley East?
The streets with the most affordable properties for sale in Popley East are Shetland Road at an average of £106,357, Tewkesbury Close at an average of £107,750 and Montserrat Place at an average of £145,000.
Which train stations are available in or near Popley East?
Some of the train stations available in or near Popley East are Basingstoke, Bramley (Hampshire) and Hook.
Property Price Paid in Popley East by Year
The average sold property price by year was:
| Year | Average Sold Price | Price Change |
Sold Properties
|
|---|---|---|---|
| 2025 | £270,053 | 4% |
65 Properties |
| 2024 | £257,976 | -6% |
63 Properties |
| 2023 | £273,513 | 11% |
51 Properties |
| 2022 | £244,162 | 3% |
83 Properties |
| 2021 | £237,057 | 0,2% |
99 Properties |
| 2020 | £236,576 | 4% |
74 Properties |
| 2019 | £226,310 | -1% |
79 Properties |
| 2018 | £227,604 | -1% |
99 Properties |
| 2017 | £230,484 | 7% |
89 Properties |
| 2016 | £214,339 | 10% |
106 Properties |
| 2015 | £193,787 | 13% |
90 Properties |
| 2014 | £169,366 | -20% |
106 Properties |
| 2013 | £202,721 | 15% |
146 Properties |
| 2012 | £171,745 | 3% |
114 Properties |
| 2011 | £165,877 | 4% |
75 Properties |
| 2010 | £158,473 | 12% |
73 Properties |
| 2009 | £139,768 | -7% |
44 Properties |
| 2008 | £150,217 | 3% |
106 Properties |
| 2007 | £145,823 | 5% |
149 Properties |
| 2006 | £139,081 | 2% |
110 Properties |
| 2005 | £136,584 | 5% |
87 Properties |
| 2004 | £130,177 | 12% |
88 Properties |
| 2003 | £115,145 | 12% |
101 Properties |
| 2002 | £101,330 | 14% |
124 Properties |
| 2001 | £86,686 | 7% |
126 Properties |
| 2000 | £80,934 | 9% |
82 Properties |
| 1999 | £73,713 | 15% |
119 Properties |
| 1998 | £62,652 | 16% |
87 Properties |
| 1997 | £52,326 | 8% |
105 Properties |
| 1996 | £48,111 | 5% |
95 Properties |
| 1995 | £45,853 | - |
77 Properties |
Property Price per Property Type in Popley East
Here you can find historic sold price data in order to help with your property search.
The average Property Paid Price for specific property types in the last three years are:
| Property Type | Average Sold Price | Sold Properties |
|---|---|---|
| Semi Detached House | £294,800.00 | 14 Semi Detached Houses |
| Detached House | £426,250.00 | 4 Detached Houses |
| Terraced House | £294,419.00 | 118 Terraced Houses |
| Flat | £167,011.00 | 43 Flats |

