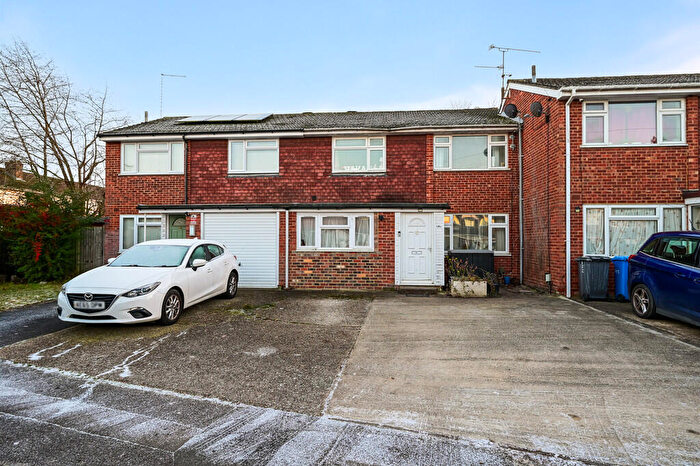
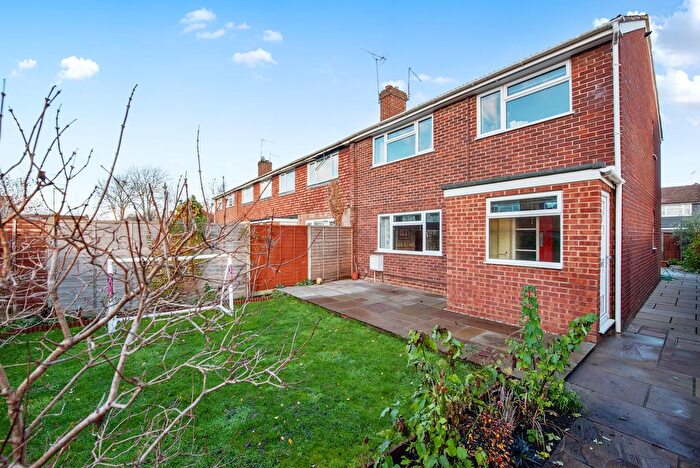
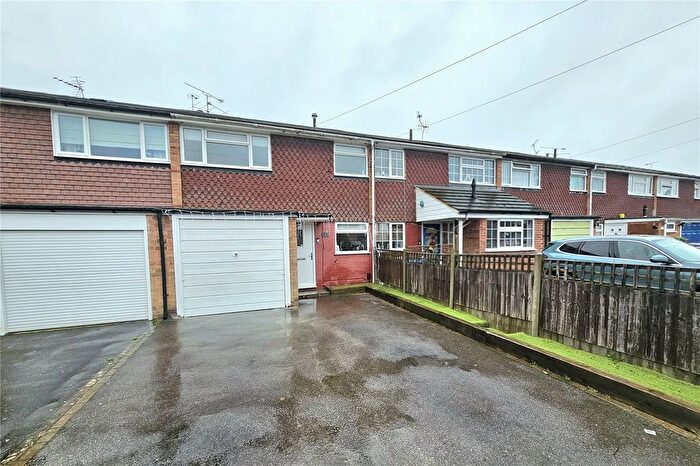
Houses for sale & to rent in Yateley East, Camberley
House Prices in Yateley East
Properties in Yateley East have an average house price of £492,503.00 and had 64 Property Transactions within the last 3 years¹.
Yateley East is an area in Camberley, Hampshire with 877 households², where the most expensive property was sold for £877,500.00.
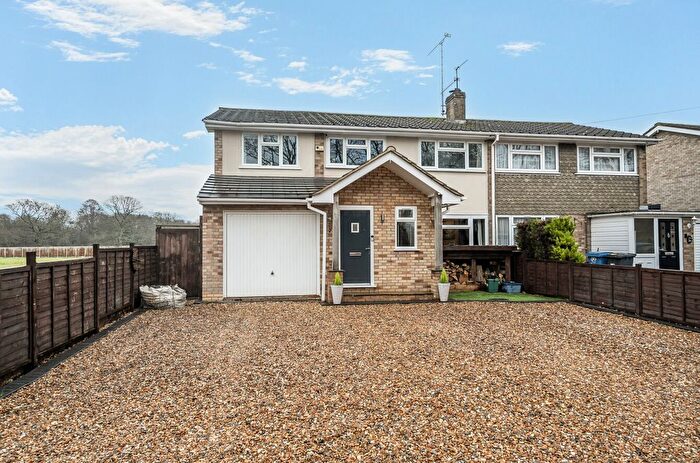
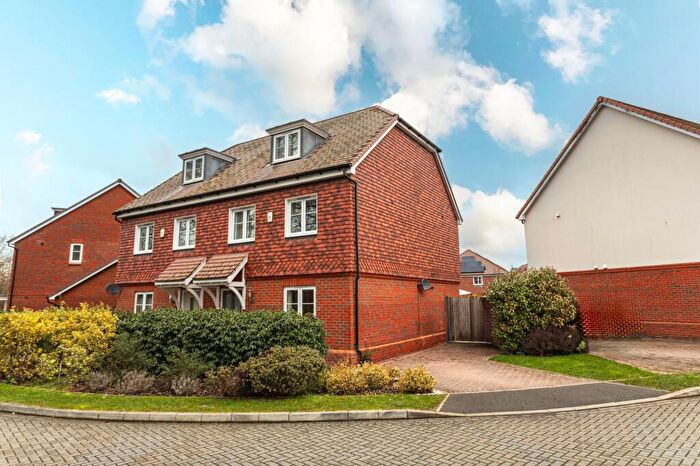
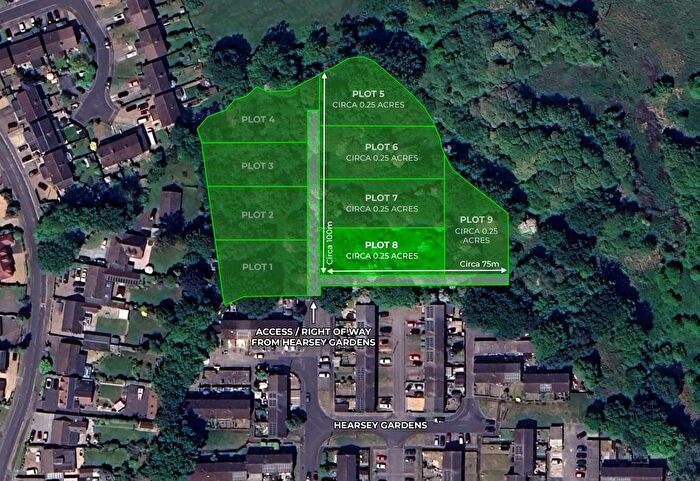
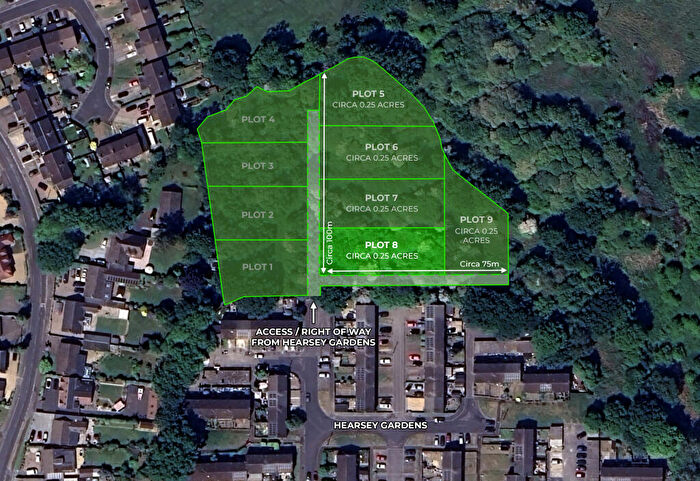
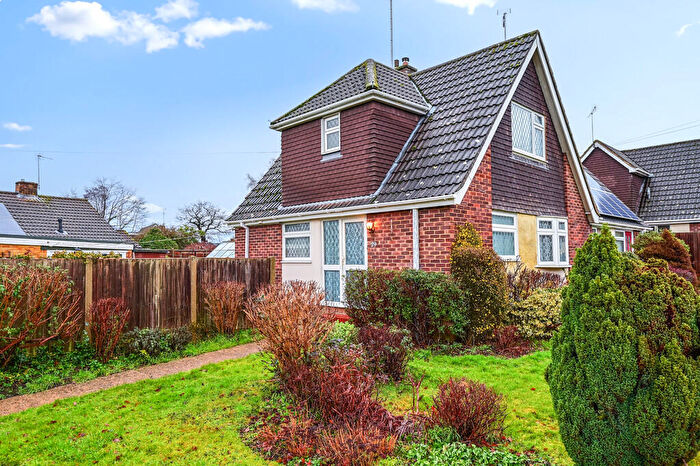
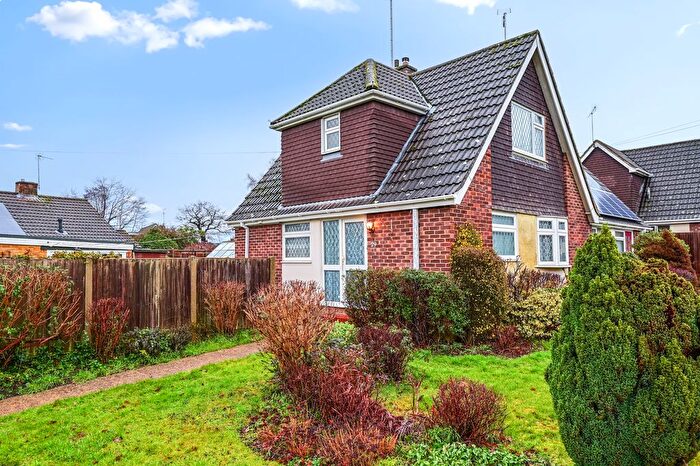
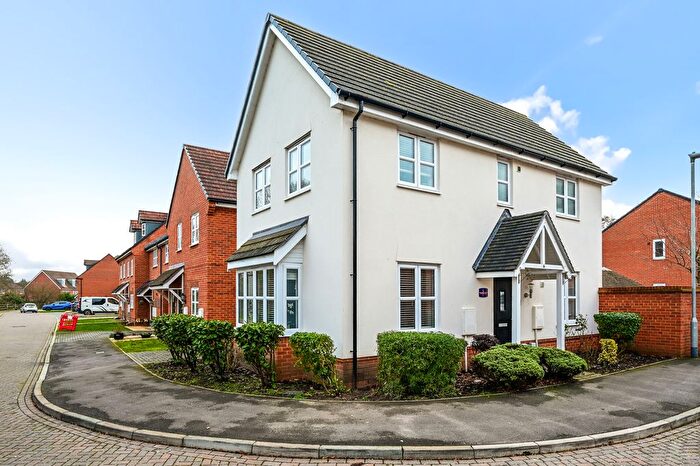
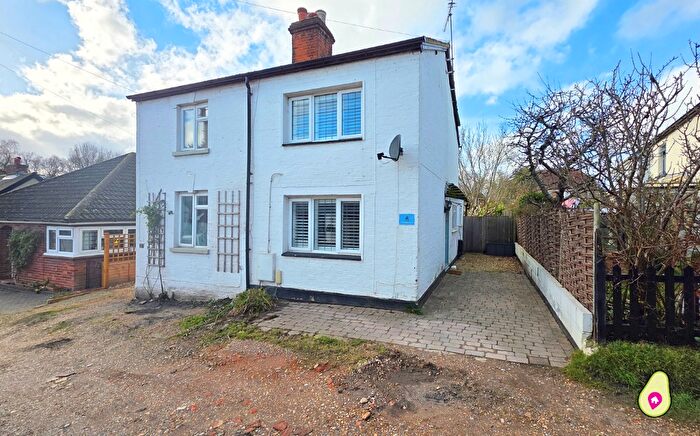
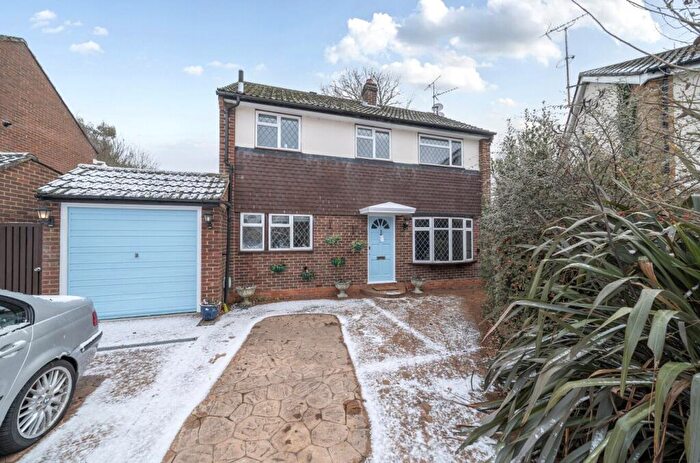
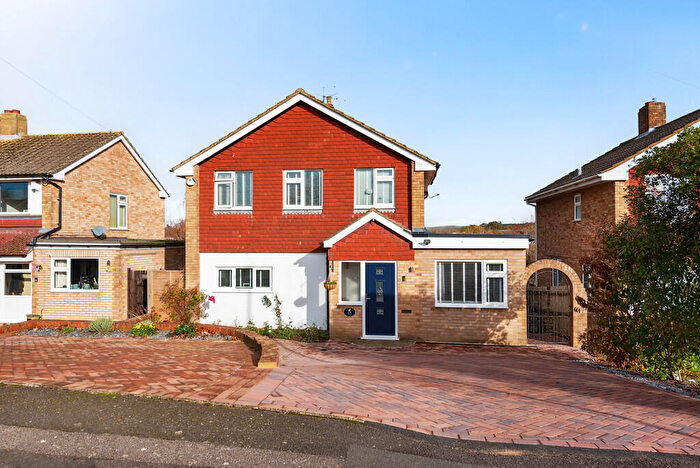
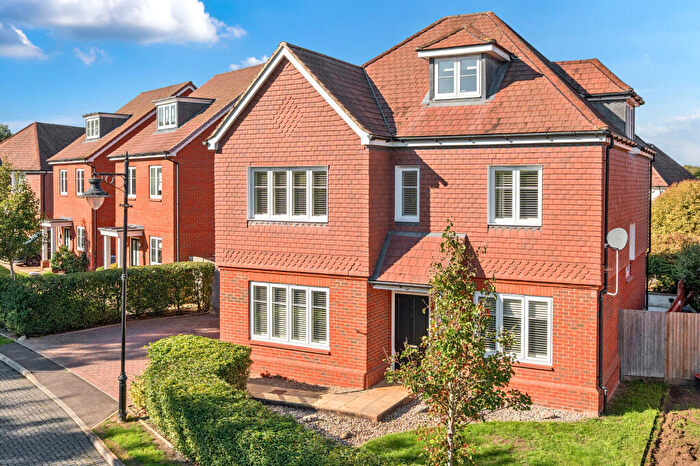
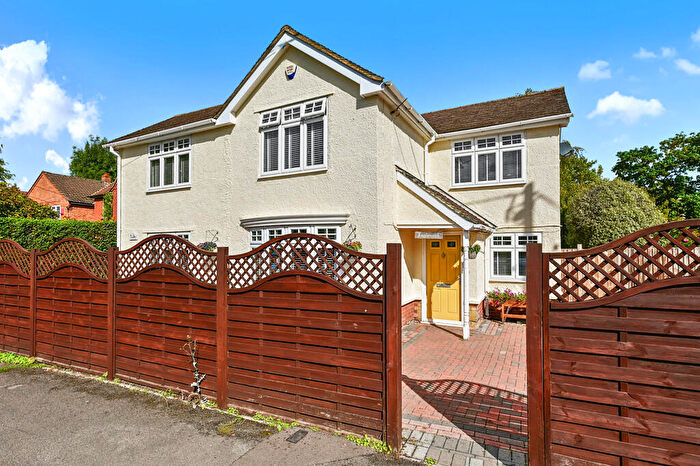
Properties for sale in Yateley East
Roads and Postcodes in Yateley East
Navigate through our locations to find the location of your next house in Yateley East, Camberley for sale or to rent.
| Streets | Postcodes |
|---|---|
| Acorn Road | GU17 0BZ |
| Adam Brown Avenue | GU17 0SE |
| Aspin Way | GU17 0BP |
| Baileys Close | GU17 0AP GU17 0AT |
| Beechnut Drive | GU17 0DJ |
| Bramley Lane | GU17 0BY |
| Brooksby Close | GU17 0ED |
| Clarks Farm Way | GU17 0SD |
| Cobbetts Lane | GU17 9LW |
| Cuckoo Crescent | GU17 0SB |
| Curlew Grove | GU17 0SF |
| Cypress Way | GU17 0EG |
| Darby Green Lane | GU17 0DL GU17 0DN GU17 0DW |
| Darby Green Road | GU17 0DT GU17 0DX |
| East Green | GU17 0AU |
| Frogmore Grove | GU17 0AJ |
| Frogmore Road | GU17 0BU GU17 0DB GU17 0NR GU17 0DD |
| Globe Farm Lane | GU17 0DY GU17 0DZ |
| Green Lane | GU17 0NU GU17 0NX GU17 0NY GU17 0NZ |
| Hearsey Gardens | GU17 0EP GU17 0ER GU17 0ES GU17 0ET |
| Larches Way | GU17 0EQ |
| London Road | GU17 9LJ |
| Lowlands Road | GU17 0AL |
| Moorhen Close | GU17 0SA |
| Olde Farm Drive | GU17 0DU |
| Priors Lane | GU17 0DR |
| Reading Road | GU17 0AX GU17 0AY GU17 0AZ GU17 0BA GU17 0BB GU17 0BE GU17 0BH GU17 0DS GU17 0BD GU17 0BJ |
| Sandhurst Lane | GU17 0DH GU17 0DQ |
| Stroud Lane | GU17 0AW GU17 0BL |
| Sydney Loader Place | GU17 0AF |
| The Birches | GU17 0EB |
| The Crescent | GU17 0EA |
| The Flats | GU17 0AN GU17 0AR GU17 0AS |
| The Green | GU17 0NT GU17 0NS |
| The Laburnums | GU17 0EF |
| The Sycamores | GU17 0EE |
| Woodbridge Road | GU17 0BS |
| Woodville Close | GU17 0BN |
Transport near Yateley East
- FAQ
- Price Paid By Year
- Property Type Price
Frequently asked questions about Yateley East
What is the average price for a property for sale in Yateley East?
The average price for a property for sale in Yateley East is £492,503. This amount is 15% higher than the average price in Camberley. There are 996 property listings for sale in Yateley East.
What streets have the most expensive properties for sale in Yateley East?
The streets with the most expensive properties for sale in Yateley East are Cuckoo Crescent at an average of £877,500, Priors Lane at an average of £695,000 and Reading Road at an average of £652,500.
What streets have the most affordable properties for sale in Yateley East?
The streets with the most affordable properties for sale in Yateley East are Hearsey Gardens at an average of £301,750, Adam Brown Avenue at an average of £373,166 and Baileys Close at an average of £395,200.
Which train stations are available in or near Yateley East?
Some of the train stations available in or near Yateley East are Sandhurst, Blackwater and Camberley.
Property Price Paid in Yateley East by Year
The average sold property price by year was:
| Year | Average Sold Price | Price Change |
Sold Properties
|
|---|---|---|---|
| 2025 | £546,053 | 16% |
14 Properties |
| 2024 | £458,166 | -8% |
24 Properties |
| 2023 | £495,365 | -20% |
26 Properties |
| 2022 | £592,269 | 14% |
26 Properties |
| 2021 | £507,238 | 7% |
44 Properties |
| 2020 | £470,520 | 5% |
24 Properties |
| 2019 | £449,156 | 1% |
32 Properties |
| 2018 | £445,032 | 5% |
31 Properties |
| 2017 | £421,518 | -12% |
24 Properties |
| 2016 | £470,628 | -3% |
33 Properties |
| 2015 | £483,971 | 8% |
57 Properties |
| 2014 | £444,418 | 21% |
56 Properties |
| 2013 | £352,155 | 8% |
41 Properties |
| 2012 | £325,057 | 12% |
20 Properties |
| 2011 | £285,588 | -2% |
27 Properties |
| 2010 | £291,750 | -1% |
16 Properties |
| 2009 | £295,284 | -9% |
19 Properties |
| 2008 | £320,666 | 2% |
18 Properties |
| 2007 | £314,725 | 11% |
28 Properties |
| 2006 | £281,220 | 7% |
31 Properties |
| 2005 | £260,576 | -3% |
49 Properties |
| 2004 | £268,336 | 13% |
38 Properties |
| 2003 | £234,570 | 10% |
47 Properties |
| 2002 | £210,287 | 13% |
45 Properties |
| 2001 | £182,105 | 12% |
42 Properties |
| 2000 | £159,980 | 15% |
44 Properties |
| 1999 | £136,396 | 0,5% |
44 Properties |
| 1998 | £135,740 | 21% |
43 Properties |
| 1997 | £106,775 | 12% |
48 Properties |
| 1996 | £94,117 | 10% |
34 Properties |
| 1995 | £84,990 | - |
33 Properties |
Property Price per Property Type in Yateley East
Here you can find historic sold price data in order to help with your property search.
The average Property Paid Price for specific property types in the last three years are:
| Property Type | Average Sold Price | Sold Properties |
|---|---|---|
| Semi Detached House | £436,630.00 | 23 Semi Detached Houses |
| Detached House | £600,008.00 | 28 Detached Houses |
| Terraced House | £359,807.00 | 13 Terraced Houses |

