
Houses for sale in St Marks, Farnborough
House Prices in St Marks
Properties in St Marks have an average house price of £309k and had 323 Property Transactions within the last 3 years¹.
St Marks is an area in Farnborough, Hampshire with 2,896 households², where the most expensive property was sold for £915k.
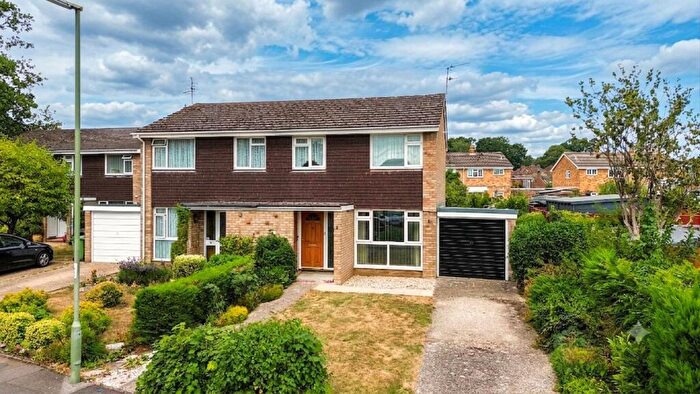
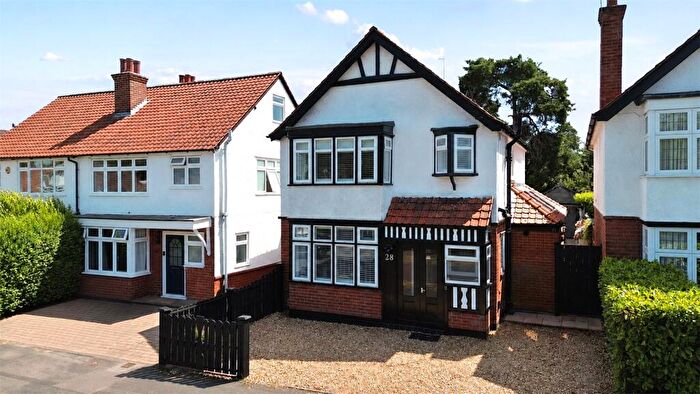
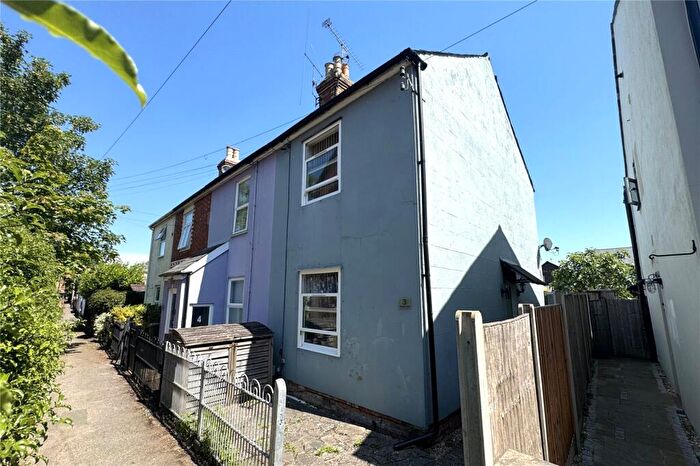
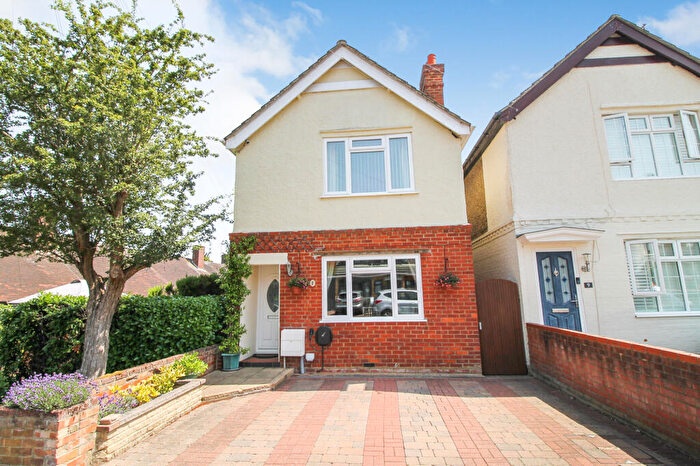
Properties for sale in St Marks
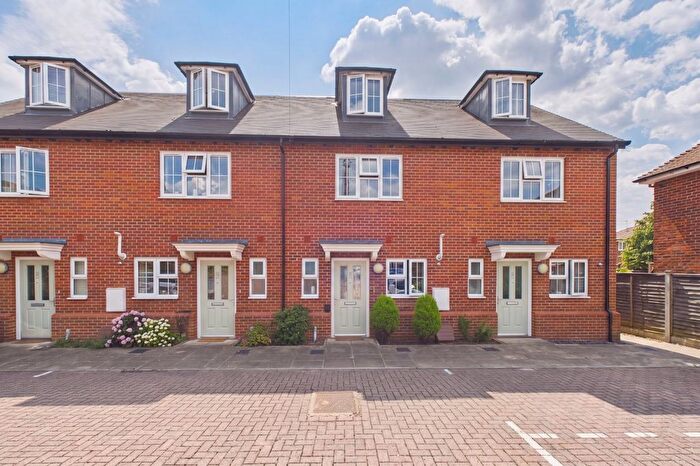


![]()
If you are looking to sell your house, let it out, or receive a property valuation, an expert can help you.
Click the button below to get started.


Roads and Postcodes in St Marks
Navigate through our locations to find the location of your next house in St Marks, Farnborough for sale or to rent.
Property price trends in St Marks
According to the latest Land Registry data, the average home in St Marks sold for £297,500 in 2026. That figure comes from 4,525 sales logged over the past 31 years.
Prices have softened over the last three years. Compared with 2023, when the typical sale came in around £307,879, that's a fall of roughly 3.4%.
Looking back five years, average prices are up about 2.8% since 2021, a gain of around £8,088 in cash terms.
Zoom out to the past decade for the fuller picture. Back in 2016, homes here averaged £286,762, so the typical sold price has climbed about 3.7% since then, roughly 0.4% a year. Stretch the view to fifteen years and that annual pace edges up closer to 2.5%.
Frequently asked questions about St Marks
What is the average price for a property for sale in St Marks?
The average price for a property for sale in St Marks is £308,692. This amount is 16% lower than the average price in Farnborough. There are 1,475 property listings for sale in St Marks.
What streets have the most expensive properties for sale in St Marks?
The streets with the most expensive properties for sale in St Marks are Reading Road at an average of £527,166, Netley Street at an average of £489,777 and Alfreds Court at an average of £450,000.
What streets have the most affordable properties for sale in St Marks?
The streets with the most affordable properties for sale in St Marks are KENLEY PLACE at an average of £108,000, Bruntile Close at an average of £164,500 and Wetherby Gardens at an average of £191,000.
Which train stations are available in or near St Marks?
Some of the train stations available in or near St Marks are North Camp, Ash Vale and Farnborough (Main).
Property Price Paid in St Marks by Year
The average sold property price by year was:
| Year | Average Sold Price | Price Change |
Sold Properties
|
|---|---|---|---|
| 2026 | £297,500 | -2% |
4 Properties |
| 2025 | £304,342.34 | -4% |
124 Properties |
| 2024 | £315,304.5 | 2% |
100 Properties |
| 2023 | £307,878.95 | 1% |
95 Properties |
| 2022 | £306,289.83 | 6% |
147 Properties |
| 2021 | £289,411.68 | 4% |
190 Properties |
| 2020 | £276,977.82 | 2% |
101 Properties |
| 2019 | £271,918.46 | 4% |
130 Properties |
| 2018 | £261,462.28 | -14% |
180 Properties |
| 2017 | £298,587.59 | 4% |
145 Properties |
Property Price per Property Type in St Marks
Here you can find historic sold price data in order to help with your property search.
The average Property Paid Price for specific property types in the last three years are:
| Property Type | Average Sold Price | Sold Properties |
|---|---|---|
| Semi Detached House | £397,072.58 | 62 Semi Detached Houses |
| Detached House | £504,890.00 | 32 Detached Houses |
| Terraced House | £338,180.77 | 91 Terraced Houses |
| Flat | £204,043.12 | 138 Flats |
