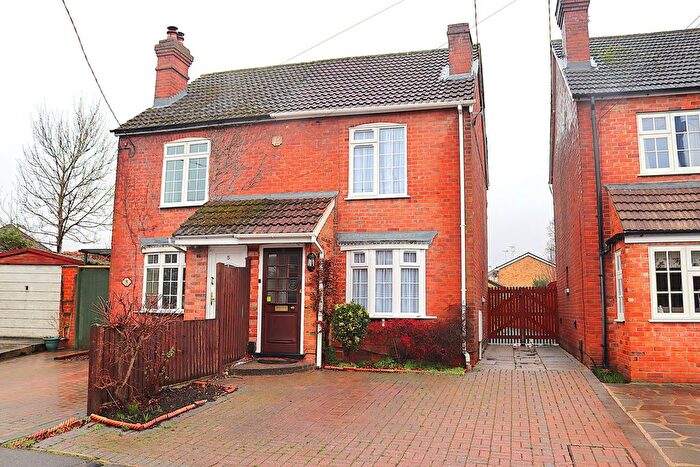
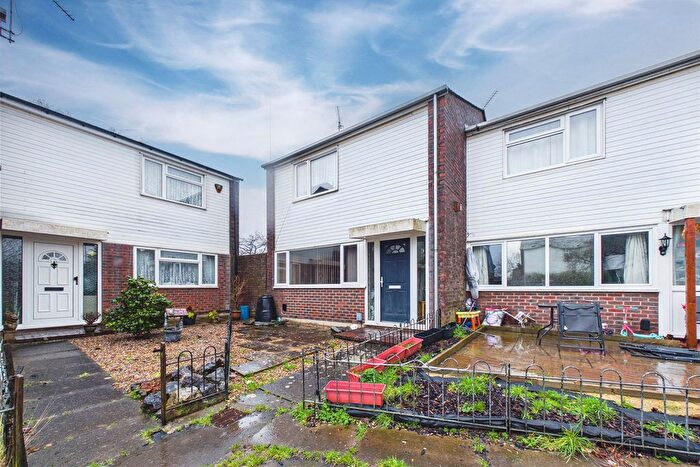
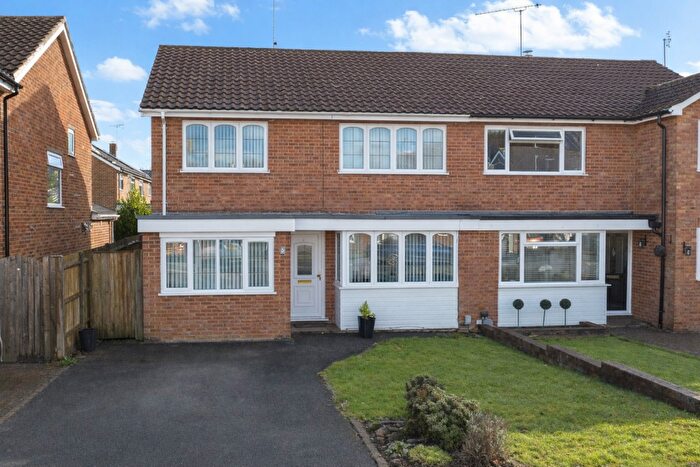
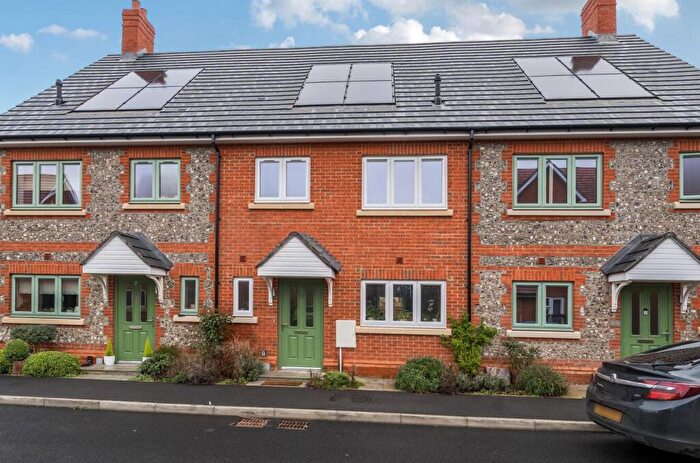
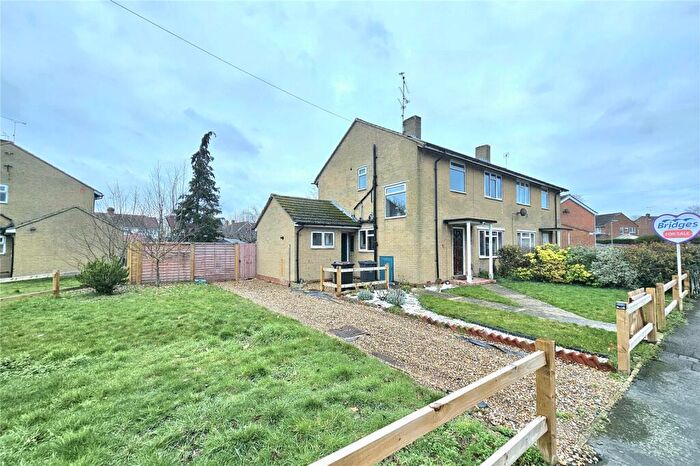
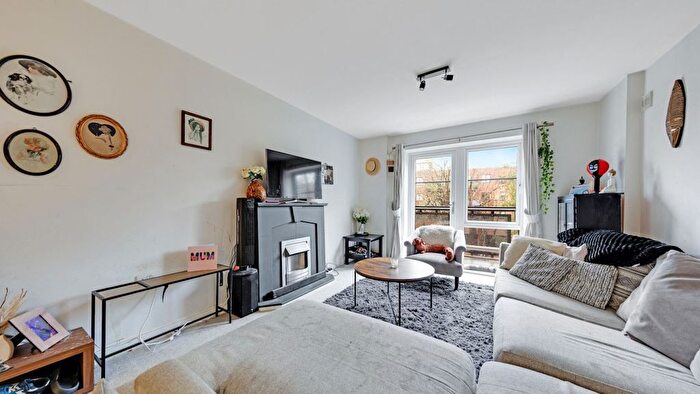
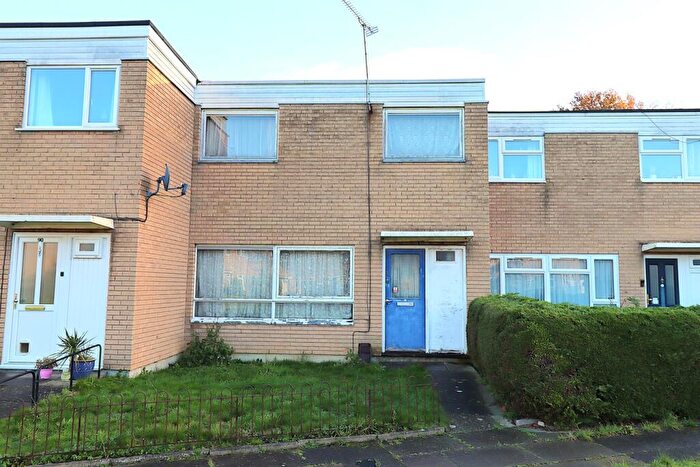
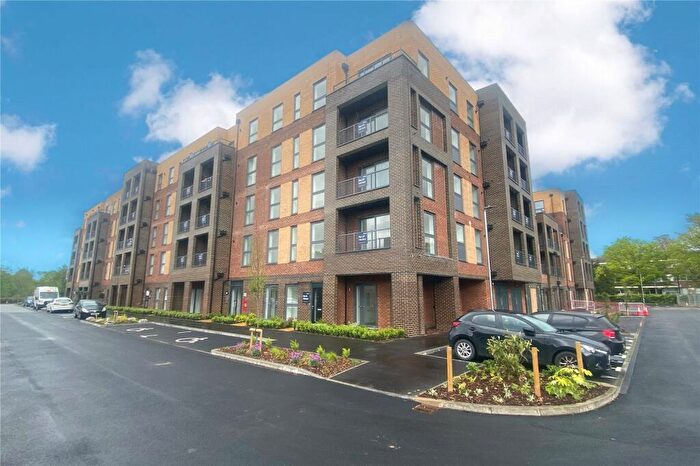
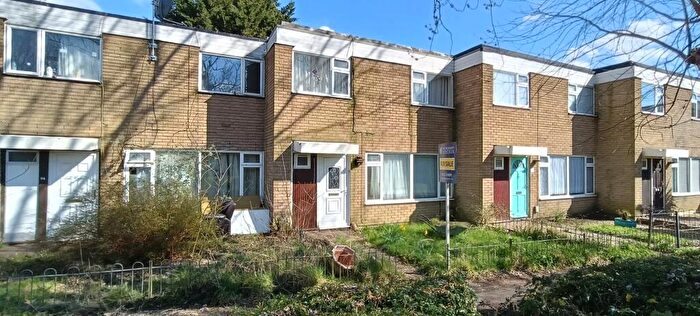
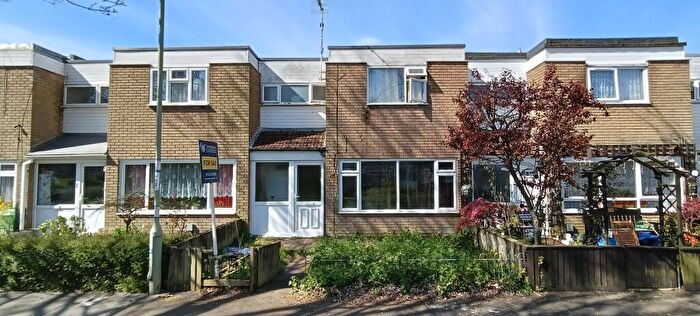
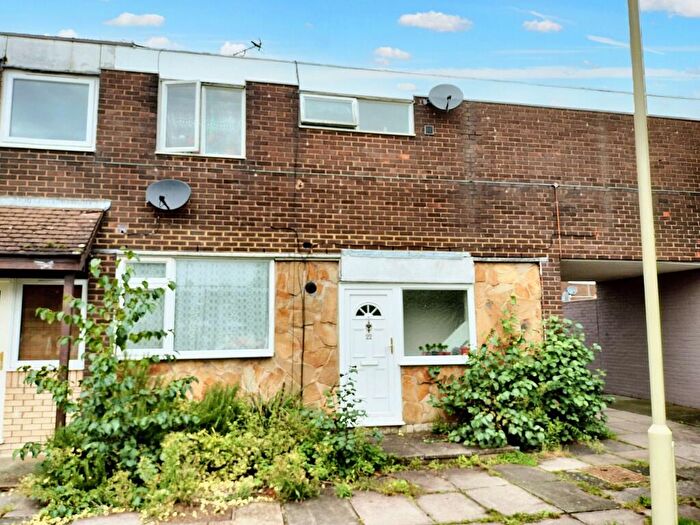
Houses for sale & to rent in Farnborough, Hampshire
House Prices in Farnborough
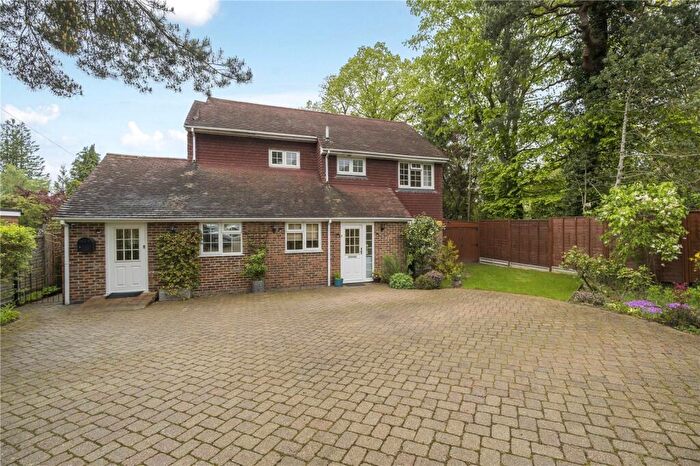
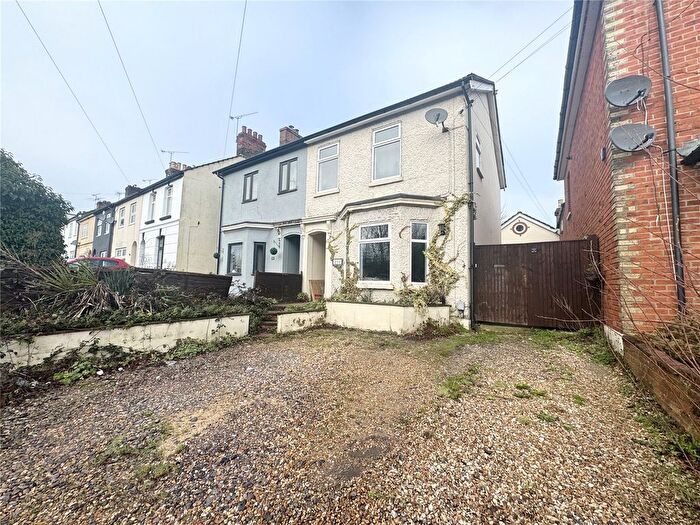
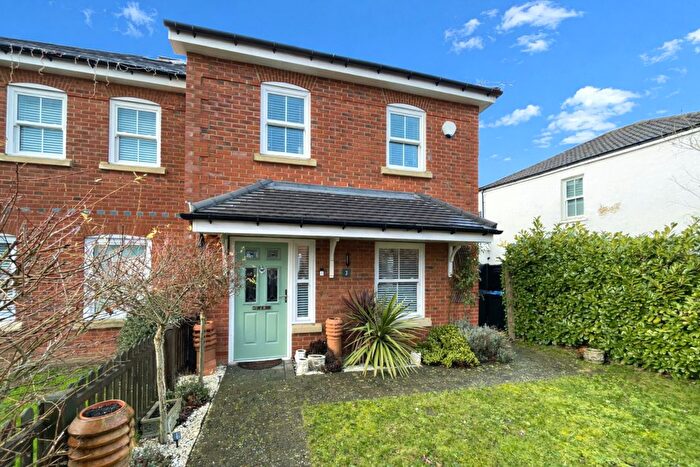
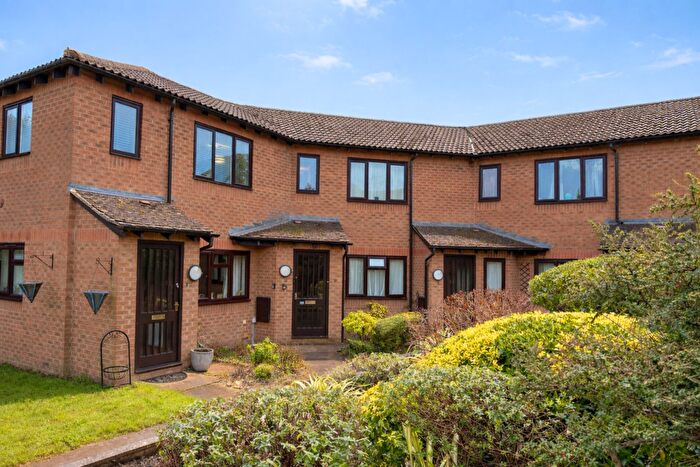
Properties in Farnborough have an average house price of £367,889.00 and had 2,024 Property Transactions within the last 3 years.¹
Farnborough is an area in Hampshire with 21,752 households², where the most expensive property was sold for £1,240,000.00.
Properties for sale in Farnborough
Neighbourhoods in Farnborough
Navigate through our locations to find the location of your next house in Farnborough, Hampshire for sale or to rent.
Transport in Farnborough
Please see below transportation links in this area:
-
Farnborough (Main) Station
-
Farnborough North Station
-
Frimley Station
-
North Camp Station
-
Ash Vale Station
-
Blackwater Station
-
Fleet Station
- FAQ
- Price Paid By Year
- Property Type Price
Frequently asked questions about Farnborough
What is the average price for a property for sale in Farnborough?
The average price for a property for sale in Farnborough is £367,889. This amount is 12% lower than the average price in Hampshire. There are 9,194 property listings for sale in Farnborough.
What locations have the most expensive properties for sale in Farnborough?
The locations with the most expensive properties for sale in Farnborough are Knellwood at an average of £477,621, West Heath at an average of £387,285 and St Johns at an average of £384,423.
What locations have the most affordable properties for sale in Farnborough?
The locations with the most affordable properties for sale in Farnborough are Cherrywood at an average of £310,214, St Marks at an average of £325,068 and Empress at an average of £334,388.
Which train stations are available in or near Farnborough?
Some of the train stations available in or near Farnborough are Farnborough (Main), Farnborough North and Frimley.
Property Price Paid in Farnborough by Year
The average sold property price by year was:
| Year | Average Sold Price | Price Change |
Sold Properties
|
|---|---|---|---|
| 2025 | £367,464 | -1% |
609 Properties |
| 2024 | £372,323 | 2% |
751 Properties |
| 2023 | £363,264 | -0,4% |
664 Properties |
| 2022 | £364,798 | 6% |
930 Properties |
| 2021 | £342,554 | 4% |
1,129 Properties |
| 2020 | £328,746 | 3% |
731 Properties |
| 2019 | £318,990 | 4% |
804 Properties |
| 2018 | £307,168 | -6% |
903 Properties |
| 2017 | £326,144 | 6% |
986 Properties |
| 2016 | £308,030 | 10% |
912 Properties |
| 2015 | £277,474 | 11% |
1,084 Properties |
| 2014 | £246,464 | 7% |
1,142 Properties |
| 2013 | £228,290 | 5% |
1,096 Properties |
| 2012 | £217,599 | -1% |
749 Properties |
| 2011 | £220,367 | -1% |
789 Properties |
| 2010 | £222,758 | 11% |
877 Properties |
| 2009 | £198,964 | -9% |
863 Properties |
| 2008 | £216,113 | -4% |
790 Properties |
| 2007 | £224,760 | 9% |
1,348 Properties |
| 2006 | £204,002 | 6% |
1,511 Properties |
| 2005 | £191,095 | 0,2% |
1,223 Properties |
| 2004 | £190,697 | 6% |
1,319 Properties |
| 2003 | £179,632 | 10% |
1,293 Properties |
| 2002 | £160,945 | 13% |
1,312 Properties |
| 2001 | £139,897 | 10% |
1,334 Properties |
| 2000 | £126,162 | 16% |
1,303 Properties |
| 1999 | £105,482 | 8% |
1,422 Properties |
| 1998 | £96,751 | 10% |
1,382 Properties |
| 1997 | £86,774 | 12% |
1,494 Properties |
| 1996 | £76,222 | 6% |
1,212 Properties |
| 1995 | £71,554 | - |
973 Properties |
Property Price per Property Type in Farnborough
Here you can find historic sold price data in order to help with your property search.
The average Property Paid Price for specific property types in the last three years are:
| Property Type | Average Sold Price | Sold Properties |
|---|---|---|
| Semi Detached House | £413,471.00 | 587 Semi Detached Houses |
| Terraced House | £338,859.00 | 571 Terraced Houses |
| Detached House | £588,750.00 | 334 Detached Houses |
| Flat | £210,091.00 | 532 Flats |

