
Houses for sale in Headley, Farnham
House Prices in Headley
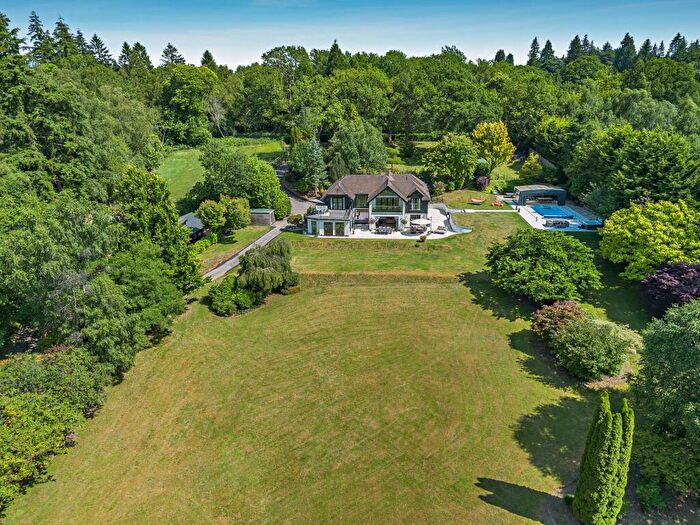
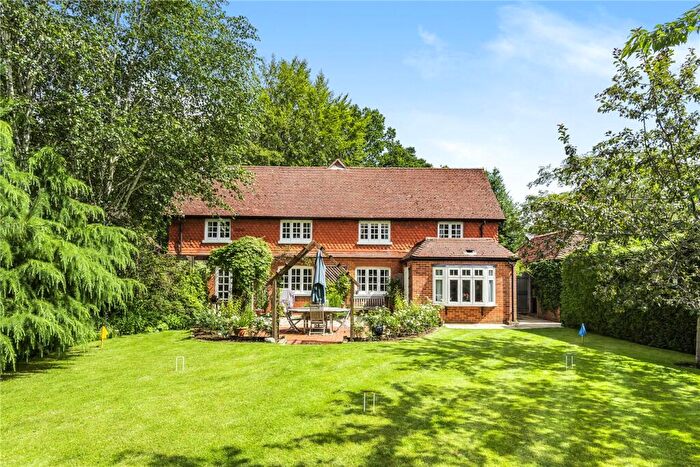
Properties in Headley have an average house price of £1.22M and had 3 Property Transactions within the last 3 years¹.
Headley is an area in Farnham, Hampshire with 69 households², where the most expensive property was sold for £2.1M.
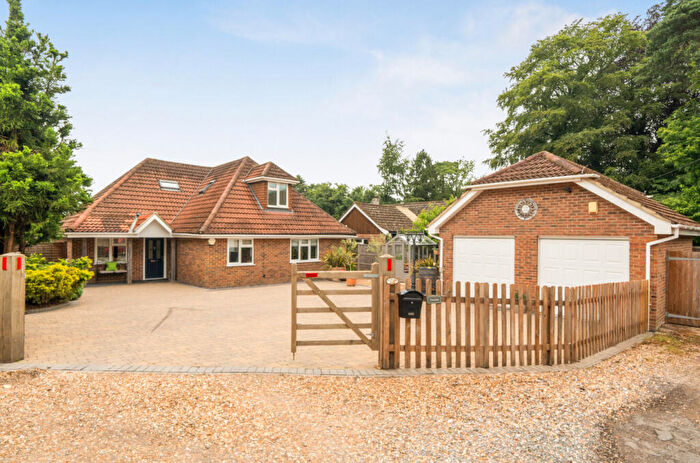
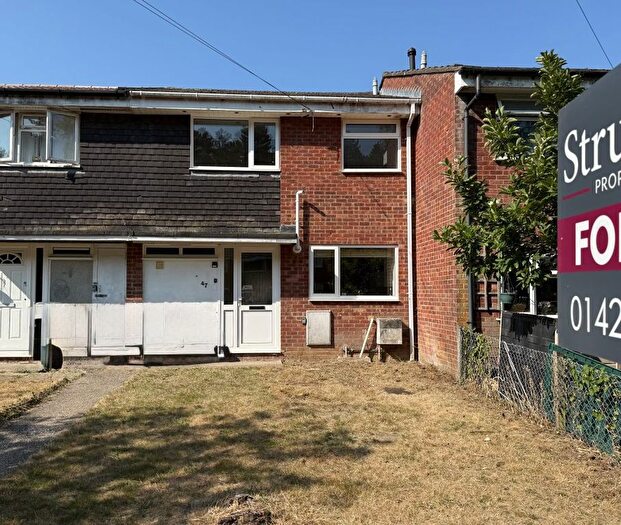
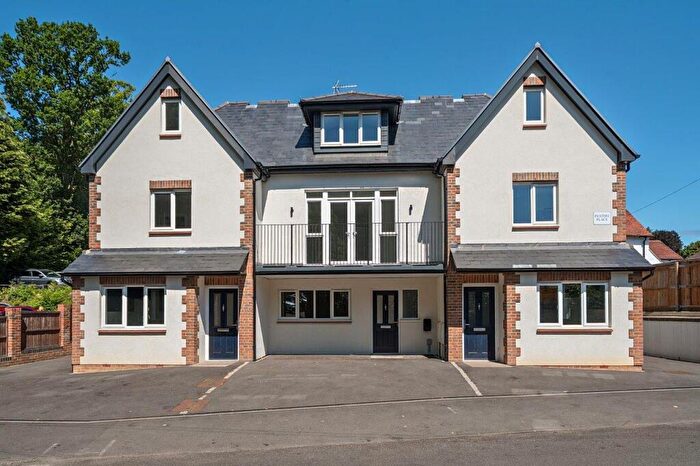
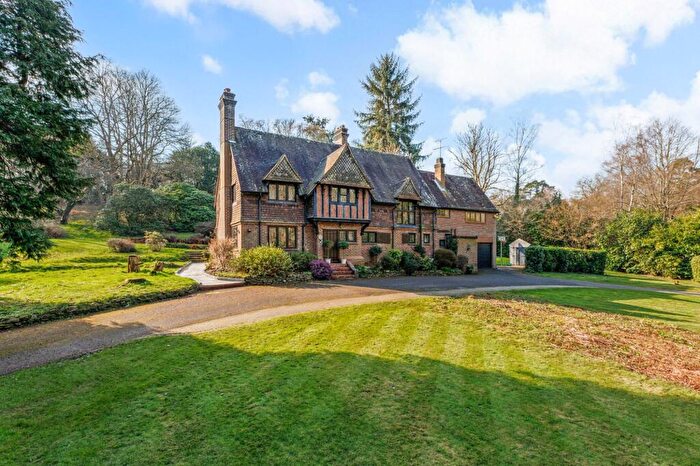
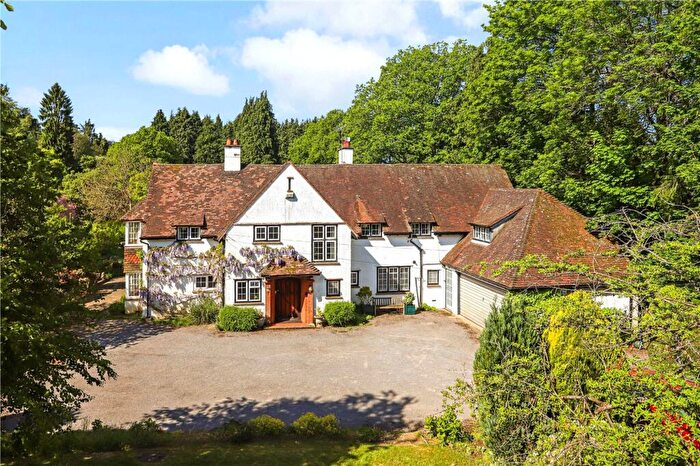
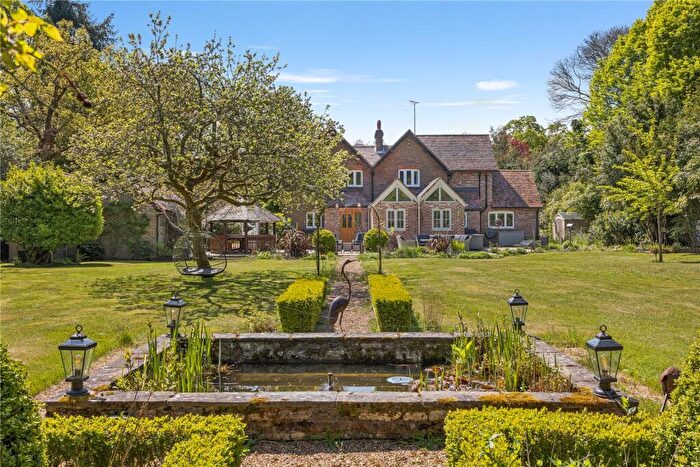
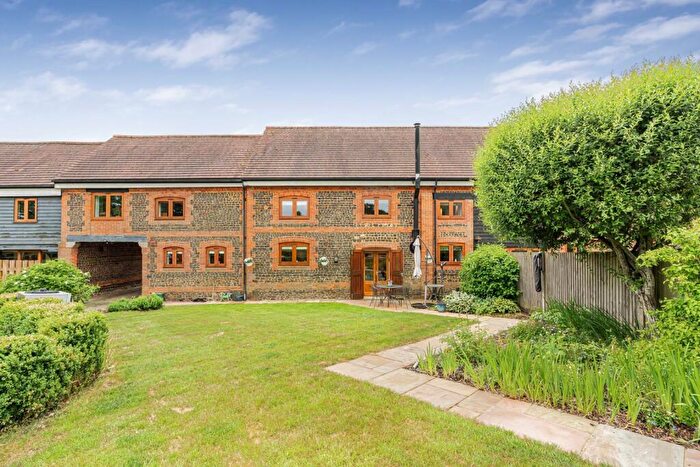
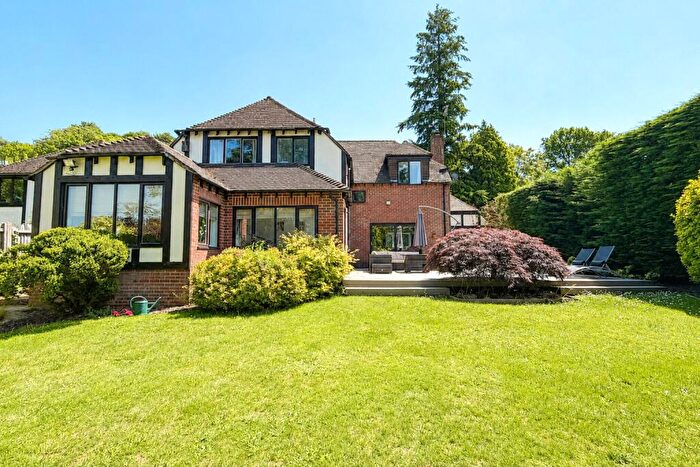
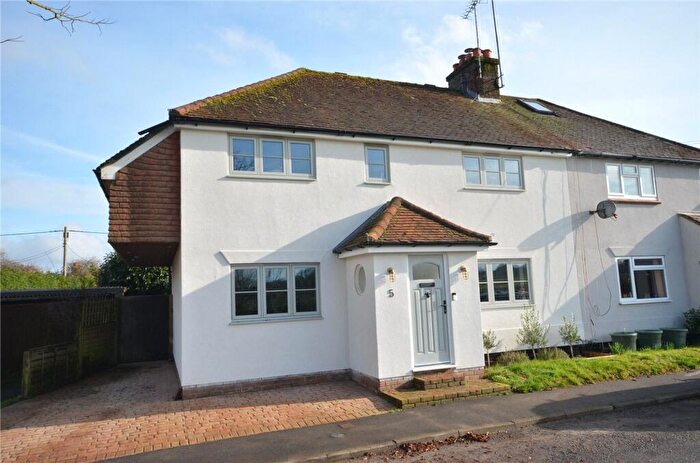
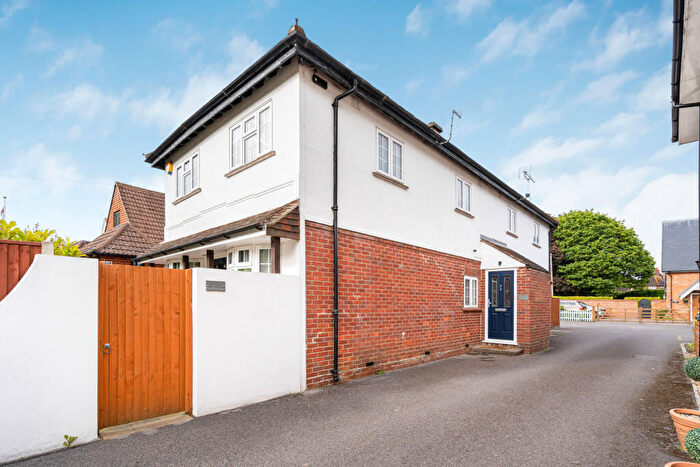
Properties for sale in Headley
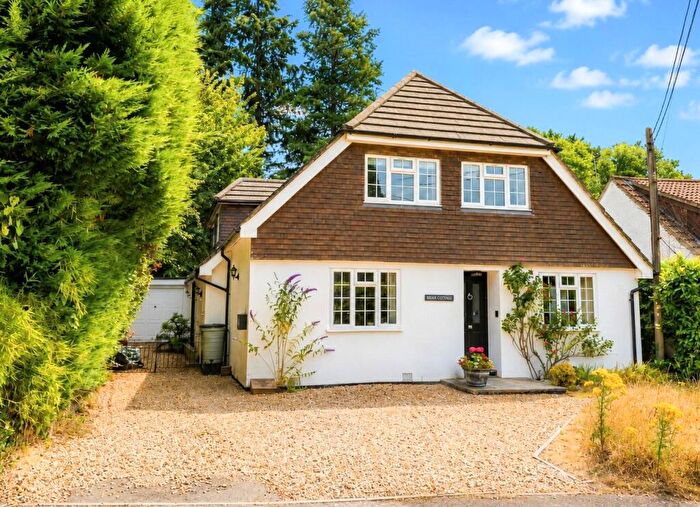
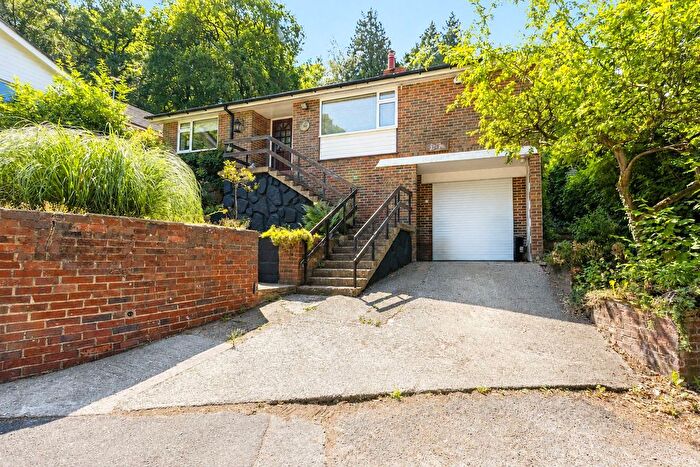
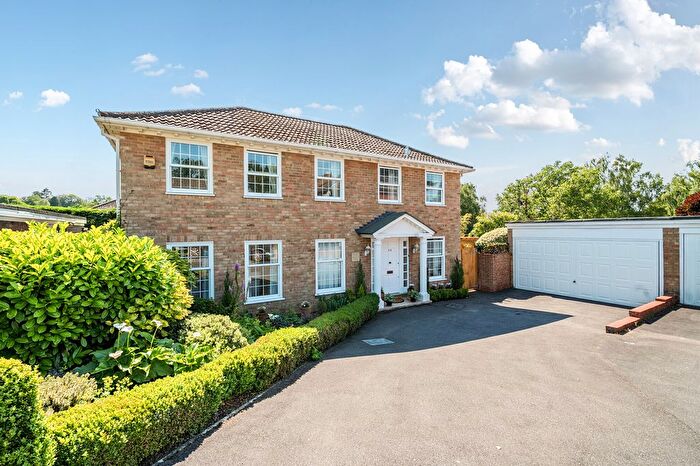
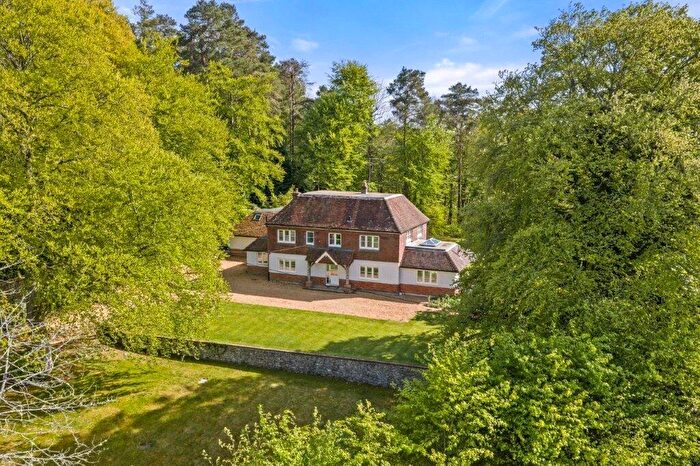
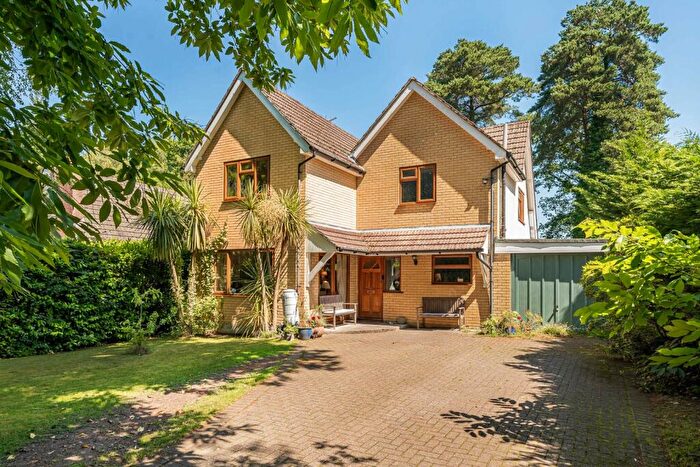
![]()
If you are looking to sell your house, let it out, or receive a property valuation, an expert can help you.
Click the button below to get started.

Roads and Postcodes in Headley
Navigate through our locations to find the location of your next house in Headley, Farnham for sale or to rent.
| Streets | Postcodes |
|---|---|
| Bacon Lane | GU10 2QE |
| Churt Road | GU10 2QS GU10 2QT GU10 2QU |
| Frensham Lane | GU10 2QG GU10 2QH GU10 2QQ |
| Hammer Lane | GU10 2QX |
| Heath Hill | GU10 4HH |
| Smithy Lane | GU10 4HJ |
| Wishanger Lane | GU10 2QF GU10 2QJ GU10 2QL |
| GU10 2PJ |
Property price trends in Headley
According to the latest Land Registry data, the average home in Headley sold for £1,446,000 in 2024. That figure comes from 83 sales logged over the past 28 years.
Prices have fallen back over the last three years. Compared with 2021, when the typical sale came in around £7,215,000, that's a fall of roughly 80%.
Looking back five years, average prices are up about 90.3% since 2019, a gain of around £686,000 in cash terms.
Zoom out to the past decade for the fuller picture. Back in 2014, homes here averaged £1,450,000, so the typical sold price has fallen about 0.3% since then, around 0% a year lower. Stretch the view to fifteen years and that annual pace edges up closer to 8.1%.
Frequently asked questions about Headley
What is the average price for a property for sale in Headley?
The average price for a property for sale in Headley is £1,215,800. This amount is 53% higher than the average price in Farnham. There are 508 property listings for sale in Headley.
Which train stations are available in or near Headley?
Some of the train stations available in or near Headley are Bentley, Liphook and Farnham.
Property Price Paid in Headley by Year
The average sold property price by year was:
| Year | Average Sold Price | Price Change |
Sold Properties
|
|---|---|---|---|
| 2024 | £1,446,000 | 48% |
2 Properties |
| 2023 | £755,400 | -99% |
1 Property |
| 2022 | £1,502,500 | -380% |
4 Properties |
| 2021 | £7,215,000 | 84% |
3 Properties |
| 2020 | £1,145,833 | 34% |
3 Properties |
| 2019 | £760,000 | -11% |
2 Properties |
| 2018 | £841,000 | -13% |
3 Properties |
| 2017 | £948,750 | 2% |
2 Properties |
| 2016 | £933,673 | -22% |
4 Properties |
| 2015 | £1,142,000 | -27% |
1 Property |
Property Price per Property Type in Headley
Here you can find historic sold price data in order to help with your property search.
The average Property Paid Price for specific property types in the last three years are:
| Property Type | Average Sold Price | Sold Properties |
|---|---|---|
| Semi Detached House | £792,000.00 | 1 Semi Detached House |
| Detached House | £1,427,700.00 | 2 Detached Houses |
