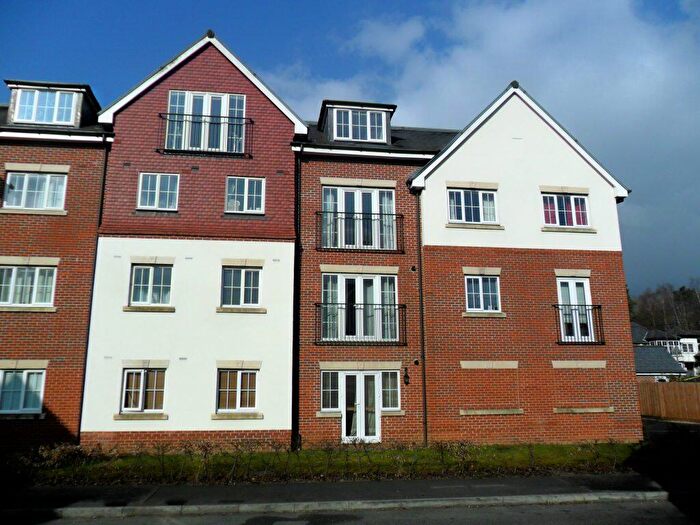
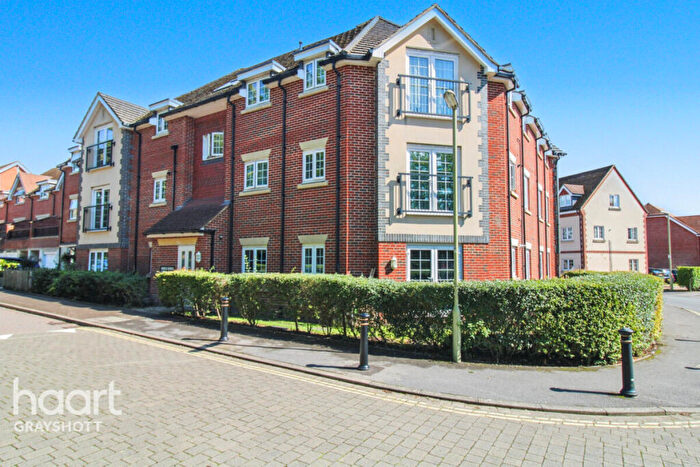
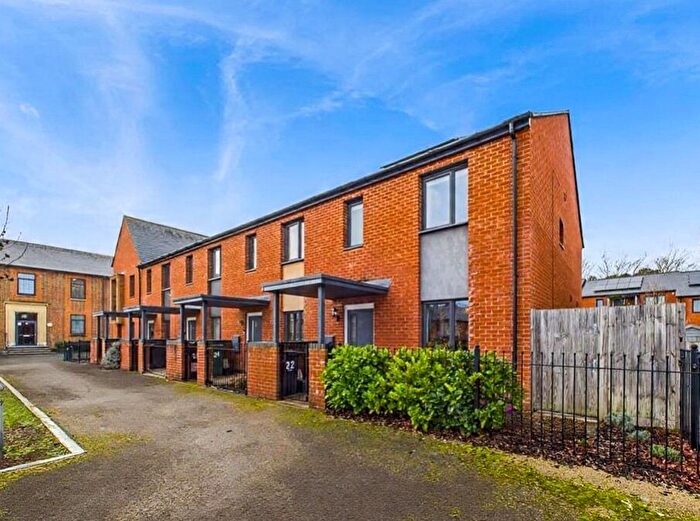
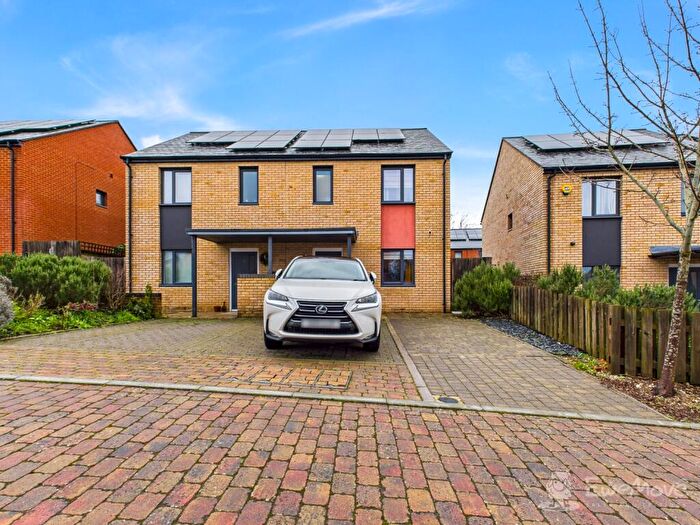
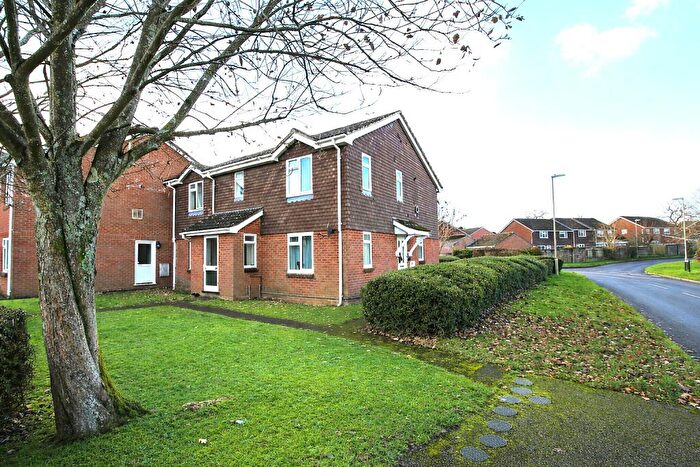
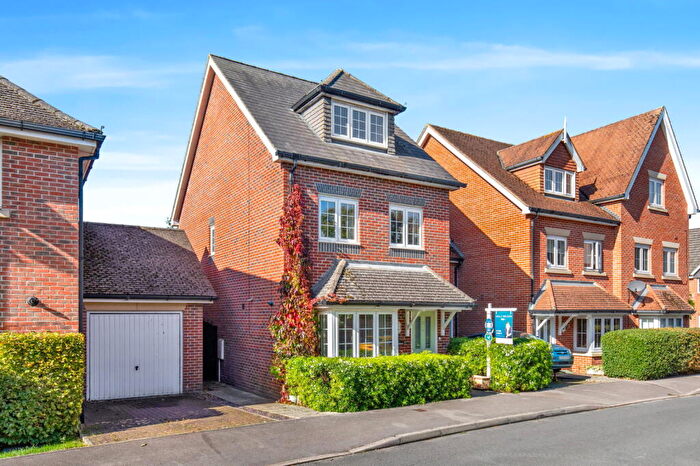
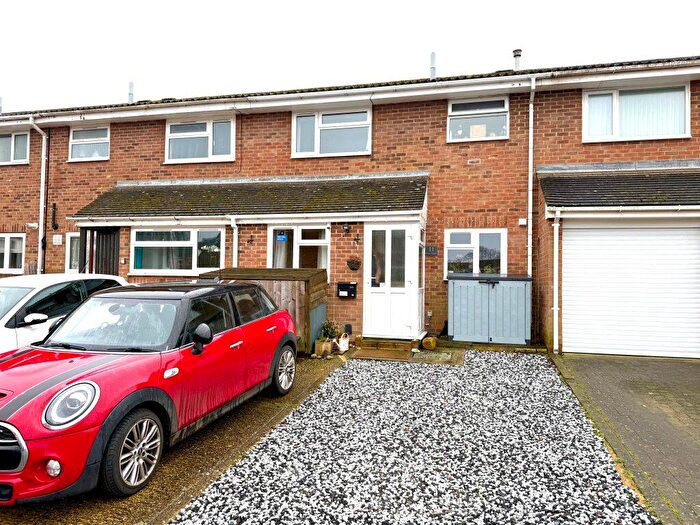
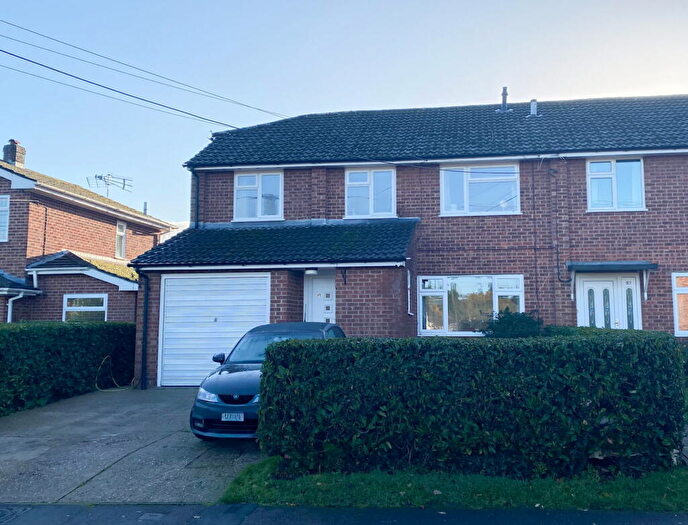
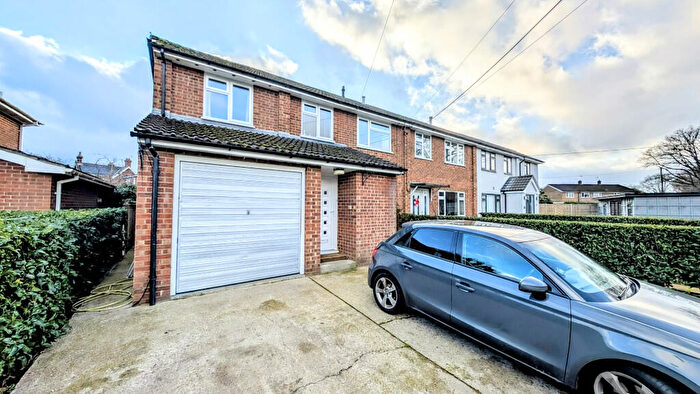
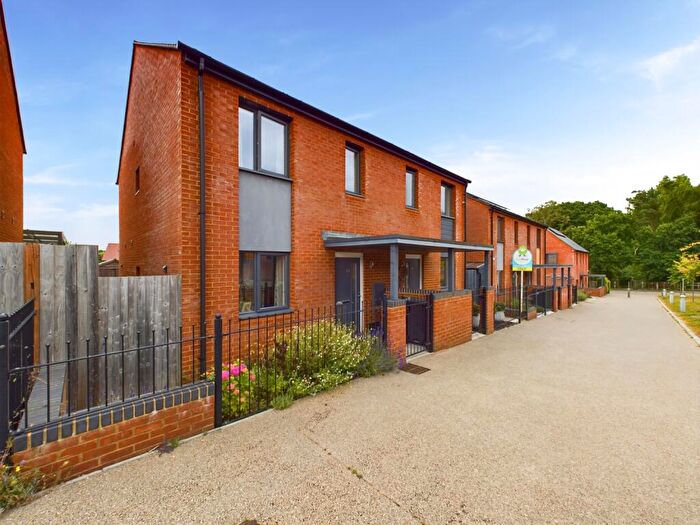
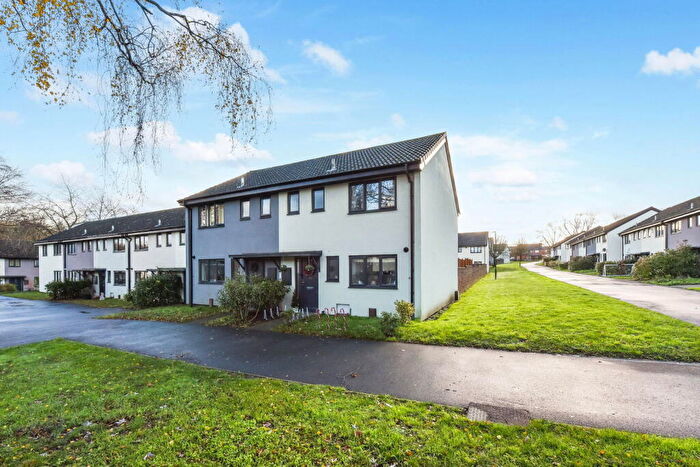
Houses for sale & to rent in Lindford, Bordon
House Prices in Lindford
Properties in Lindford have an average house price of £426,845.00 and had 107 Property Transactions within the last 3 years¹.
Lindford is an area in Bordon, Hampshire with 1,113 households², where the most expensive property was sold for £950,000.00.
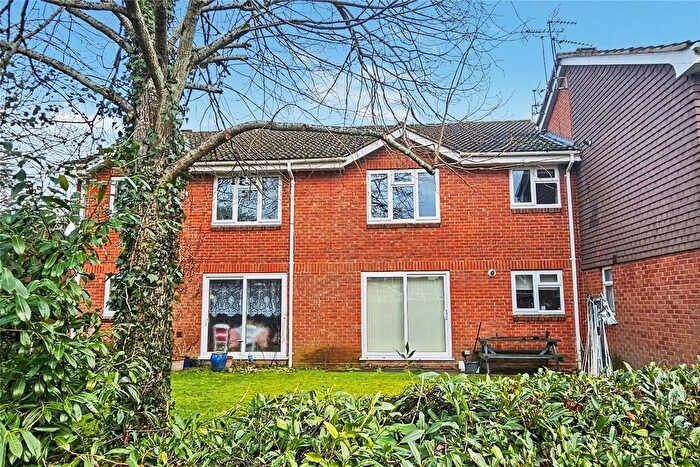
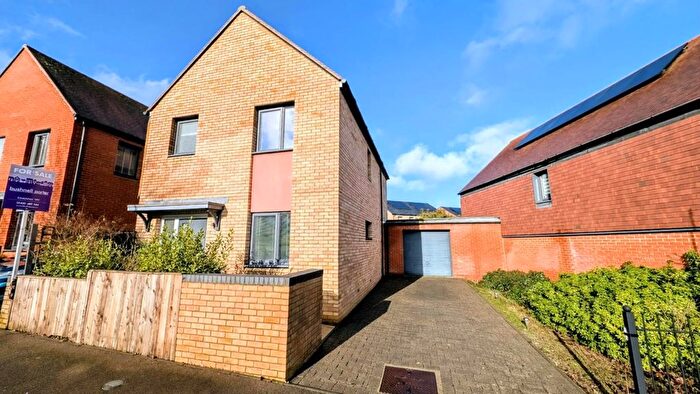
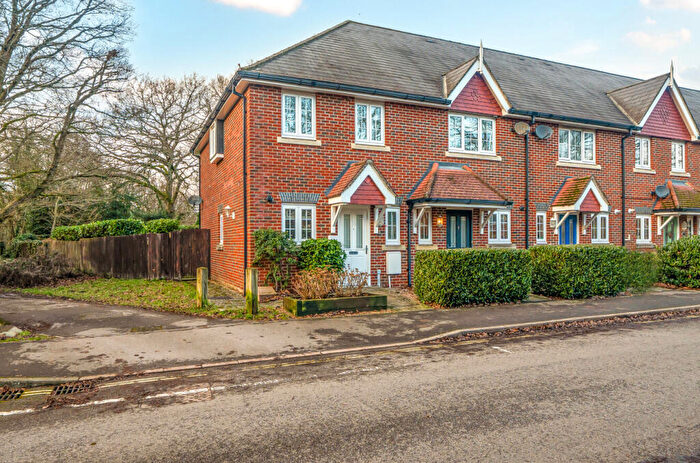
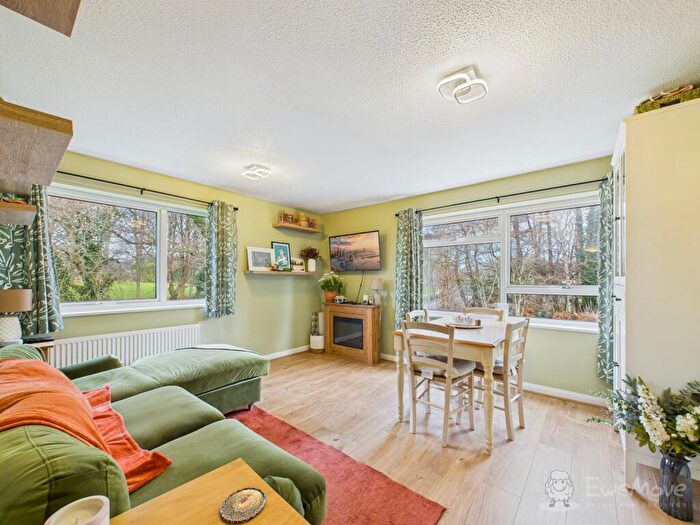
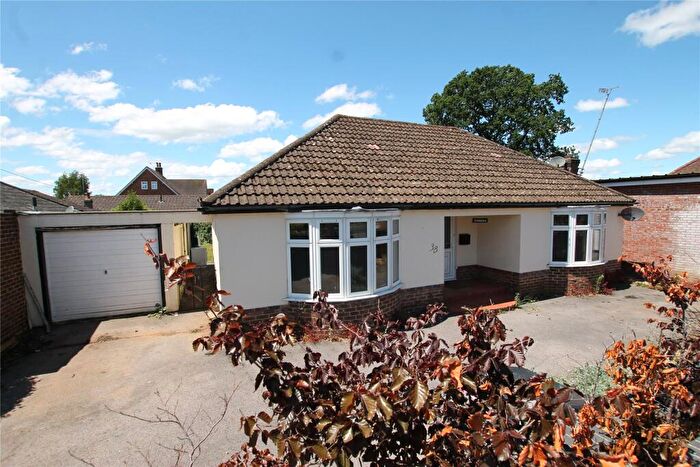
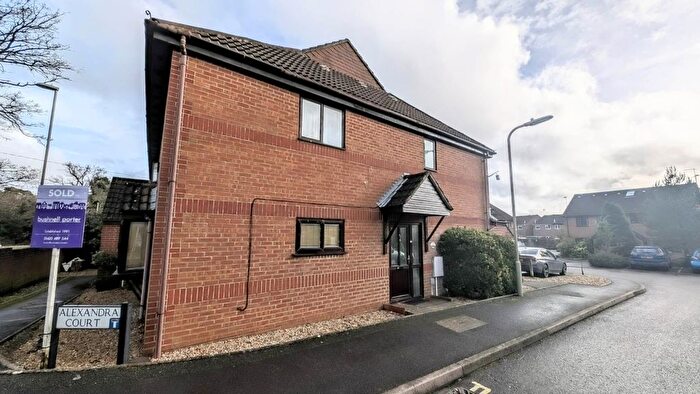
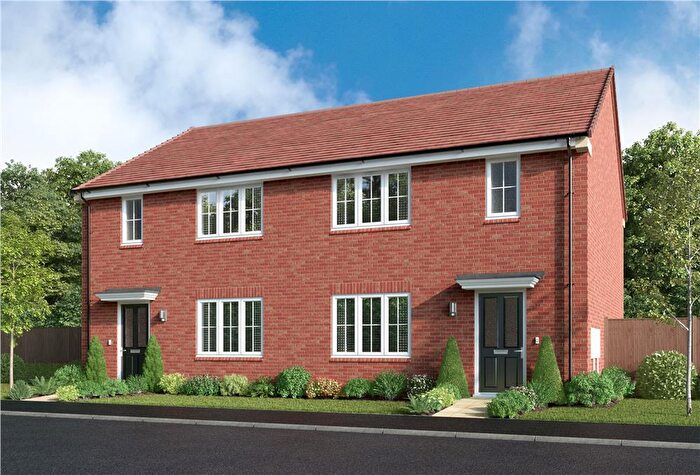
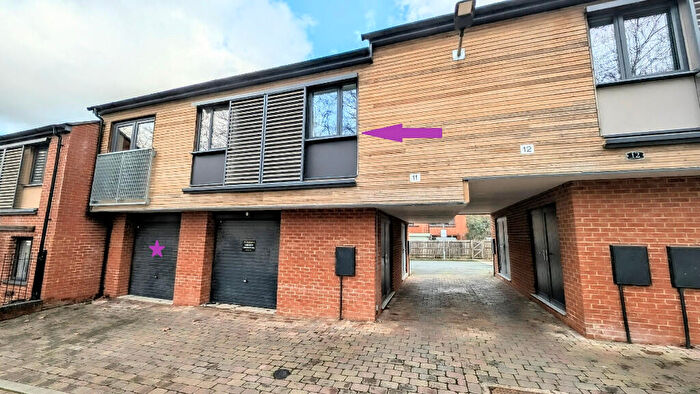
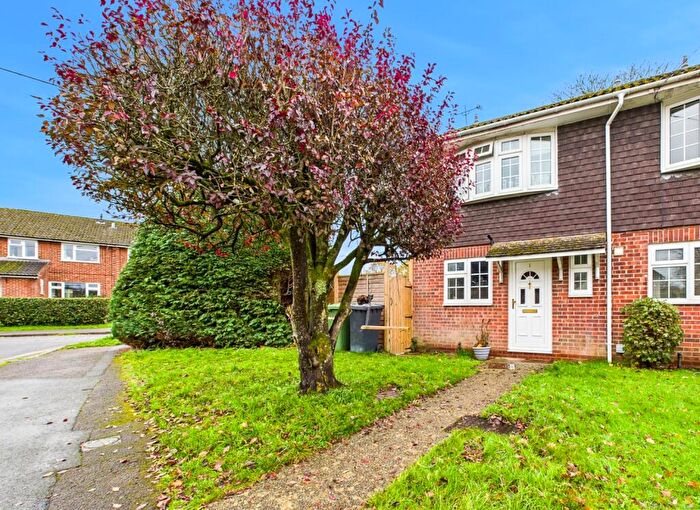
Properties for sale in Lindford
Roads and Postcodes in Lindford
Navigate through our locations to find the location of your next house in Lindford, Bordon for sale or to rent.
| Streets | Postcodes |
|---|---|
| Azalea Avenue | GU35 0YD |
| Bluebell Road | GU35 0YN |
| Buttercup Close | GU35 0YR |
| Campion Close | GU35 0YG |
| Canes Lane | GU35 0RP |
| Chapel Gardens | GU35 0TA |
| Chase Road | GU35 0RG GU35 0RR GU35 0RS GU35 0RU GU35 0RW GU35 0SY GU35 0FE GU35 0SX |
| Clover Close | GU35 0YH |
| Coltsfoot Road | GU35 0YS |
| Cowslip Close | GU35 0YF |
| Cricket Lea | GU35 0PY |
| Elder Crescent | GU35 0RF |
| Elderberry Road | GU35 0YE |
| Five Acres Close | GU35 0SJ |
| Frensham Lane | GU35 0QG GU35 0QH GU35 0QJ GU35 0QQ |
| Grayshott Laurels | GU35 0QB |
| Hawthorn Way | GU35 0RB GU35 0RJ |
| Headley Road | GU35 0NZ GU35 0PA |
| Heather Drive | GU35 0RN |
| Imadene Close | GU35 0PJ |
| Imadene Crescent | GU35 0PH |
| Lands End Lane | GU35 0SS |
| Lindford Chase | GU35 0TB |
| Lindford Road | GU35 0NX |
| Lindford Wey | GU35 0SZ |
| Liphook Road | GU35 0PF GU35 0PG GU35 0PN GU35 0PP GU35 0PT GU35 0PU GU35 0PW GU35 0PX GU35 0QA GU35 0PQ |
| Lynwood Close | GU35 0QD |
| Mallow Close | GU35 0YJ |
| Mill Lane | GU35 0PE |
| Mimosa Close | GU35 0YW |
| Mount Pleasant Road | GU35 0PR GU35 0PS |
| Orchard Drive | GU35 0PL |
| Pear Tree Close | GU35 0SR |
| Pear Tree Road | GU35 0SP |
| Periwinkle Close | GU35 0YQ |
| Privet Road | GU35 0YL |
| Rosewood Road | GU35 0YP |
| Rowan Road | GU35 0RE |
| Sycamore Road | GU35 0RD |
| Taylors Close | GU35 0SL |
| Taylors Lane | GU35 0SW |
| Torrington Close | GU35 0QE |
| Washford Lane | GU35 0RH GU35 0RT |
| Weyford Close | GU35 0FA |
| Windsor Road | GU35 0RX GU35 0RY GU35 0RZ GU35 0SA GU35 0SB GU35 0SD GU35 0SQ |
| Windsor Walk | GU35 0SE GU35 0SF GU35 0SG GU35 0SH |
Transport near Lindford
-
Liphook Station
-
Bentley Station
-
Liss Station
-
Alton Station
-
Haslemere Station
-
Farnham Station
-
Witley Station
-
Petersfield Station
-
Aldershot Station
-
Milford (Surrey) Station
- FAQ
- Price Paid By Year
- Property Type Price
Frequently asked questions about Lindford
What is the average price for a property for sale in Lindford?
The average price for a property for sale in Lindford is £426,845. This amount is 9% higher than the average price in Bordon. There are 631 property listings for sale in Lindford.
What streets have the most expensive properties for sale in Lindford?
The streets with the most expensive properties for sale in Lindford are Taylors Lane at an average of £770,000, Grayshott Laurels at an average of £617,525 and Azalea Avenue at an average of £605,500.
What streets have the most affordable properties for sale in Lindford?
The streets with the most affordable properties for sale in Lindford are Torrington Close at an average of £200,000, Rosewood Road at an average of £270,000 and Hawthorn Way at an average of £270,437.
Which train stations are available in or near Lindford?
Some of the train stations available in or near Lindford are Liphook, Bentley and Liss.
Property Price Paid in Lindford by Year
The average sold property price by year was:
| Year | Average Sold Price | Price Change |
Sold Properties
|
|---|---|---|---|
| 2025 | £414,250 | -1% |
32 Properties |
| 2024 | £418,250 | -7% |
38 Properties |
| 2023 | £446,567 | 2% |
37 Properties |
| 2022 | £439,584 | 19% |
41 Properties |
| 2021 | £353,866 | 6% |
62 Properties |
| 2020 | £333,567 | -1% |
43 Properties |
| 2019 | £338,010 | -1% |
46 Properties |
| 2018 | £341,522 | -12% |
43 Properties |
| 2017 | £383,529 | 15% |
50 Properties |
| 2016 | £326,017 | 7% |
61 Properties |
| 2015 | £301,657 | 10% |
60 Properties |
| 2014 | £272,530 | 12% |
55 Properties |
| 2013 | £239,895 | -1% |
30 Properties |
| 2012 | £242,356 | -1% |
48 Properties |
| 2011 | £245,029 | -16% |
34 Properties |
| 2010 | £285,238 | 21% |
30 Properties |
| 2009 | £224,030 | 0,5% |
67 Properties |
| 2008 | £222,929 | -21% |
91 Properties |
| 2007 | £270,418 | 20% |
98 Properties |
| 2006 | £215,229 | -2% |
60 Properties |
| 2005 | £218,573 | 1% |
60 Properties |
| 2004 | £217,071 | 7% |
84 Properties |
| 2003 | £202,370 | -11% |
52 Properties |
| 2002 | £225,221 | 34% |
57 Properties |
| 2001 | £149,077 | 2% |
62 Properties |
| 2000 | £146,340 | 9% |
55 Properties |
| 1999 | £133,499 | 3% |
48 Properties |
| 1998 | £129,246 | 24% |
54 Properties |
| 1997 | £98,373 | 9% |
58 Properties |
| 1996 | £89,258 | 18% |
53 Properties |
| 1995 | £72,985 | - |
39 Properties |
Property Price per Property Type in Lindford
Here you can find historic sold price data in order to help with your property search.
The average Property Paid Price for specific property types in the last three years are:
| Property Type | Average Sold Price | Sold Properties |
|---|---|---|
| Semi Detached House | £445,204.00 | 24 Semi Detached Houses |
| Detached House | £574,160.00 | 38 Detached Houses |
| Terraced House | £337,906.00 | 32 Terraced Houses |
| Flat | £181,269.00 | 13 Flats |

