Houses for sale & to rent in Odiham, Farnham
House Prices in Odiham
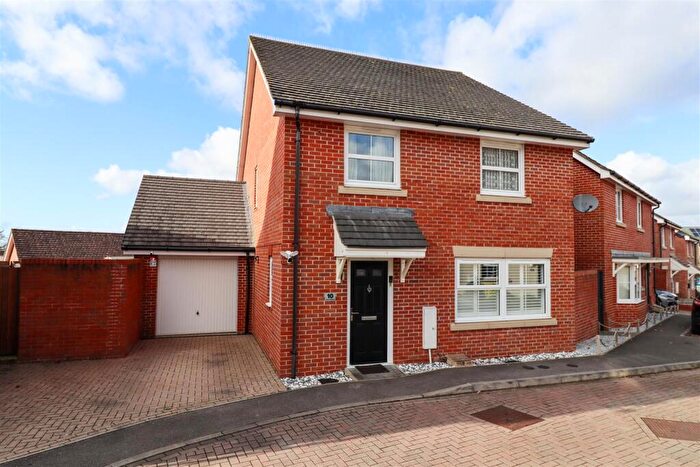
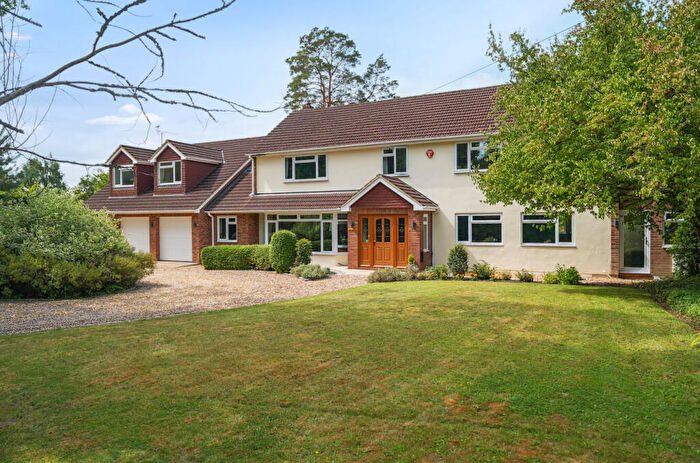
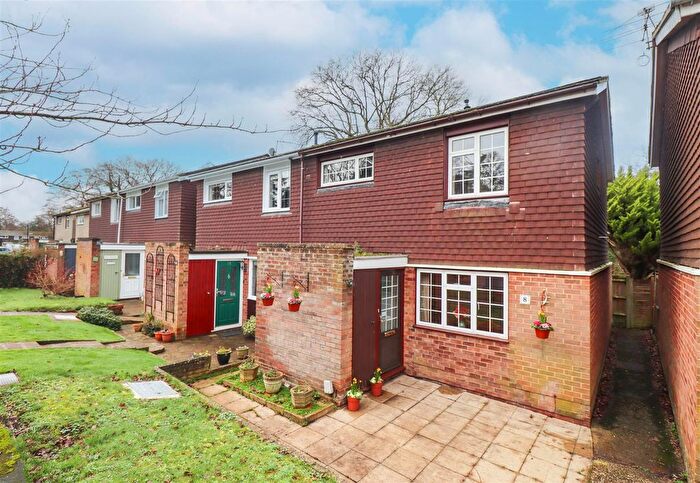
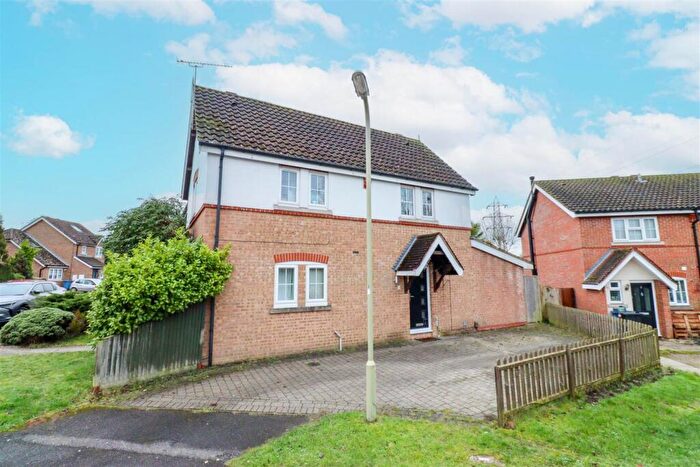
Properties in Odiham have an average house price of £877,849.00 and had 63 Property Transactions within the last 3 years¹.
Odiham is an area in Farnham, Hampshire with 692 households², where the most expensive property was sold for £2,350,000.00.
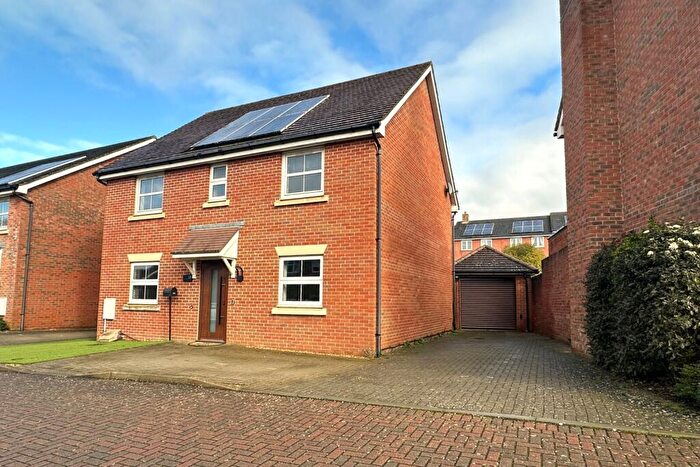
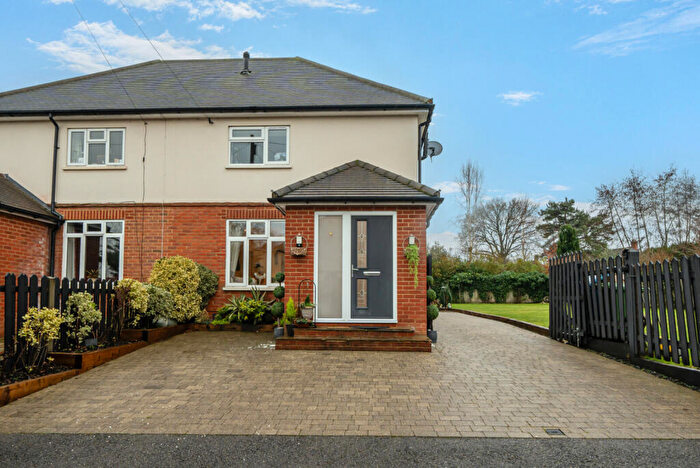
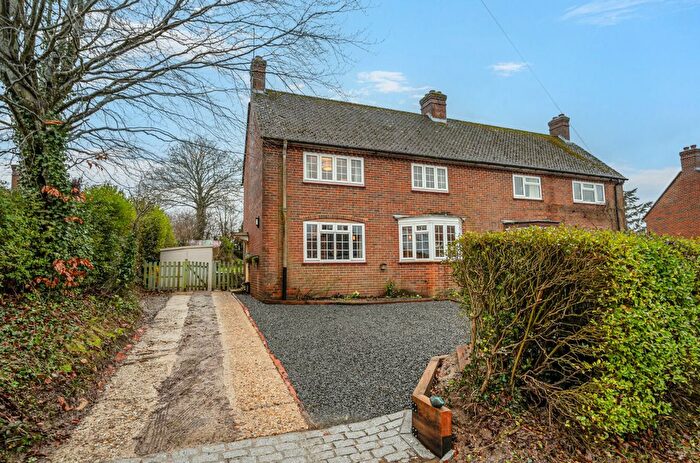
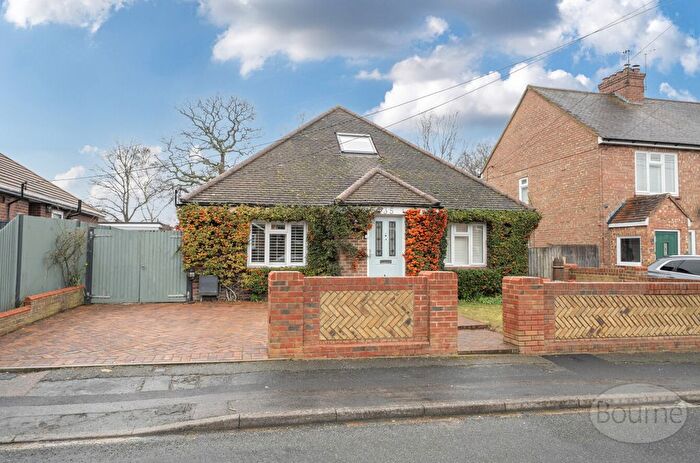
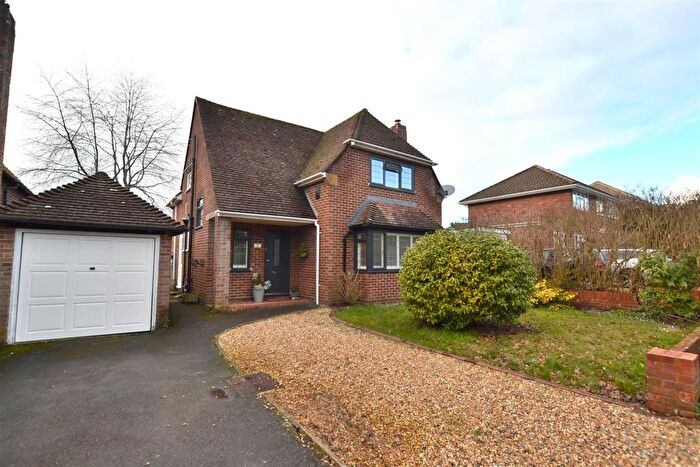
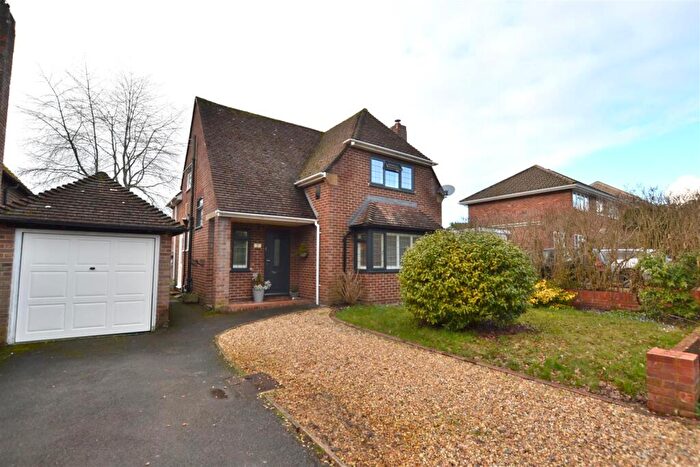
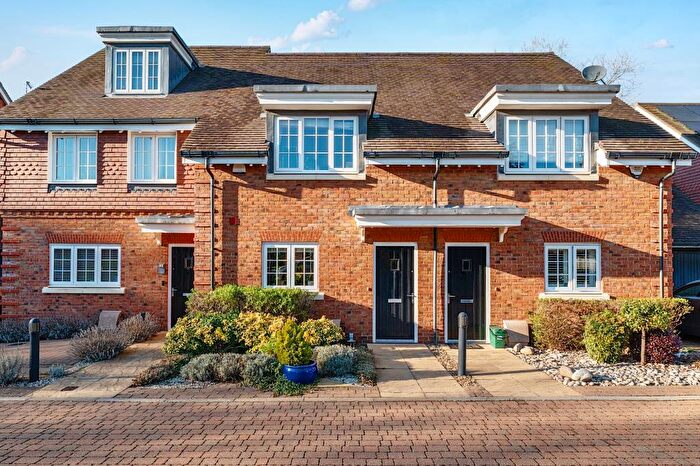
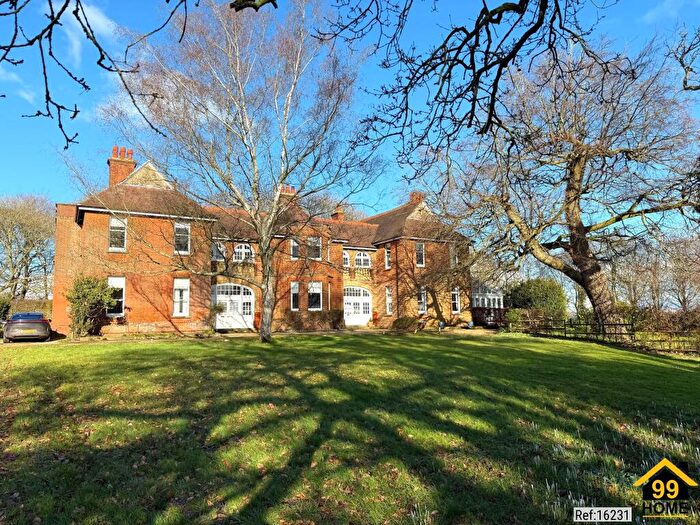
Properties for sale in Odiham
Roads and Postcodes in Odiham
Navigate through our locations to find the location of your next house in Odiham, Farnham for sale or to rent.
| Streets | Postcodes |
|---|---|
| Aquarius Close | GU10 5RZ |
| Ashley Close | GU10 5RD |
| Bowenhurst Lane | GU10 5HP |
| Bowling Alley | GU10 5RJ GU10 5RL GU10 5RN GU10 5RW |
| Chaundlers Croft | GU10 5PH |
| Chilloway Close | GU10 5SB |
| Chilloway Terrace | GU10 5QY |
| Church Hill Terrace | GU10 5QH |
| Church Street | GU10 5QQ GU10 5QR GU10 5QL |
| Clare Park | GU10 5DT GU10 5XX |
| Council Bungalows | GU10 5PP |
| Croft Lane | GU10 5QD GU10 5QF GU10 5QG |
| Crondall Road | GU10 5RU |
| Dippenhall Street | GU10 5NX GU10 5NY GU10 5NZ GU10 5PE GU10 5PF |
| Doras Green Lane | GU10 5DX GU10 5DZ |
| Farm Lane | GU10 5QE |
| Farnham Road | GU10 5BA GU10 5RS GU10 5BB |
| Finns Industrial Park | GU10 5RX |
| Glebe Road | GU10 5PJ GU10 5PL |
| Green Springs | GU10 5RB GU10 5RE GU10 5TP |
| Handcroft Close | GU10 5RY |
| Hannams Farm Close | GU10 5PD |
| Heath Lane | GU10 5AW GU10 5PA GU10 5PB |
| Hyde Lane | GU10 5QW |
| Itchel Lane | GU10 5PR GU10 5PT GU10 5PU |
| Lefroys Field | GU10 5SA |
| Mill Lane | GU10 5RP GU10 5RR |
| Orchard Court | GU10 5QP |
| Pankridge Street | GU10 5QJ GU10 5QT GU10 5QU GU10 5QX GU10 5QZ GU10 5RA GU10 5RG GU10 5RH GU10 5RQ |
| Ralph Court | GU10 5QB |
| Ravelin Close | GU10 5PS |
| Redlands Lane | GU10 5RF |
| Rye Common Lane | GU10 5DD GU10 5DE GU10 5EQ |
| St Cross Road | GU10 5PG GU10 5PQ |
| Swanthorpe Cottages | GU10 5HQ |
| The Borough | GU10 5NT GU10 5NU |
| The Hollow | GU10 5AP |
| The Withies | GU10 5QS |
| Well Road | GU10 5HJ GU10 5PN GU10 5PW GU10 5QA |
| Wimble Hill | GU10 5HL |
| GU10 5EB GU10 5HG GU10 5HH GU10 5PX GU10 5PY GU10 5RT |
Transport near Odiham
- FAQ
- Price Paid By Year
- Property Type Price
Frequently asked questions about Odiham
What is the average price for a property for sale in Odiham?
The average price for a property for sale in Odiham is £877,849. This amount is 9% higher than the average price in Farnham. There are 2,031 property listings for sale in Odiham.
What streets have the most expensive properties for sale in Odiham?
The streets with the most expensive properties for sale in Odiham are Heath Lane at an average of £2,140,000, Farm Lane at an average of £1,975,000 and Itchel Lane at an average of £1,496,250.
What streets have the most affordable properties for sale in Odiham?
The streets with the most affordable properties for sale in Odiham are Rye Common Lane at an average of £293,000, Glebe Road at an average of £370,000 and Wimble Hill at an average of £450,000.
Which train stations are available in or near Odiham?
Some of the train stations available in or near Odiham are Farnham, Bentley and Winchfield.
Property Price Paid in Odiham by Year
The average sold property price by year was:
| Year | Average Sold Price | Price Change |
Sold Properties
|
|---|---|---|---|
| 2025 | £849,533 | -7% |
15 Properties |
| 2024 | £911,312 | 5% |
24 Properties |
| 2023 | £862,083 | -18% |
24 Properties |
| 2022 | £1,014,822 | -2% |
22 Properties |
| 2021 | £1,033,980 | 18% |
25 Properties |
| 2020 | £848,761 | 34% |
30 Properties |
| 2019 | £562,202 | -59% |
32 Properties |
| 2018 | £896,447 | 32% |
19 Properties |
| 2017 | £610,141 | -8% |
17 Properties |
| 2016 | £659,485 | -34% |
34 Properties |
| 2015 | £883,927 | 37% |
22 Properties |
| 2014 | £558,146 | 14% |
34 Properties |
| 2013 | £478,052 | -77% |
19 Properties |
| 2012 | £847,472 | 17% |
18 Properties |
| 2011 | £704,388 | 27% |
28 Properties |
| 2010 | £511,772 | -17% |
20 Properties |
| 2009 | £599,356 | 17% |
16 Properties |
| 2008 | £495,378 | 10% |
9 Properties |
| 2007 | £444,652 | -8% |
23 Properties |
| 2006 | £479,228 | 16% |
33 Properties |
| 2005 | £400,208 | -5% |
35 Properties |
| 2004 | £418,815 | 17% |
22 Properties |
| 2003 | £347,049 | -58% |
29 Properties |
| 2002 | £550,063 | 33% |
24 Properties |
| 2001 | £368,871 | 13% |
32 Properties |
| 2000 | £322,656 | 26% |
30 Properties |
| 1999 | £238,258 | 2% |
23 Properties |
| 1998 | £234,396 | 16% |
29 Properties |
| 1997 | £195,918 | -6% |
27 Properties |
| 1996 | £207,709 | 27% |
39 Properties |
| 1995 | £151,596 | - |
32 Properties |
Property Price per Property Type in Odiham
Here you can find historic sold price data in order to help with your property search.
The average Property Paid Price for specific property types in the last three years are:
| Property Type | Average Sold Price | Sold Properties |
|---|---|---|
| Semi Detached House | £645,394.00 | 19 Semi Detached Houses |
| Detached House | £1,238,481.00 | 27 Detached Houses |
| Terraced House | £574,375.00 | 8 Terraced Houses |
| Flat | £556,444.00 | 9 Flats |

